Comparative mitogenomics and phylogenetic implications of Dawkinsia apsara and Dawkinsia denisonii (Cypriniformes, Cyprinidae)
Xiao Ma, Yang Xu, Xiao-Die Chen, Cheng-He Sun, Chang-Hu Lu

TL;DR
This study compares the mitochondrial genomes of two fish species, Dawkinsia apsara and Dawkinsia denisonii, to clarify their evolutionary relationships and resolve classification issues.
Contribution
The first complete mitochondrial genome of Dawkinsia apsara is sequenced, providing new phylogenetic insights into the Dawkinsia genus.
Findings
The mitochondrial genomes of D. apsara and D. denisonii show similar nucleotide composition but differ in control region structure.
Phylogenetic analysis confirms the monophyly of the genus Dawkinsia and improves resolution compared to prior studies.
Structural variations in the control region, including tandem repeats, are revealed between closely related species.
Abstract
The classification of the Puntius-Dawkinsia complex has long been controversial due to overlapping morphological characteristics and inconsistent phylogenetic tree topology based on short mtDNA fragments. In order to better clarify the species relationship within the genus Dawkinsia, the complete mitochondrial genome of Dawkinsia apsara was determined for the first time, and the mitochondrial genome of Dawkinsia denisonii was newly sequenced independently for comparative analysis. The results showed that the nucleotide composition of mtDNA of D. apsara (16,470 bp) and D. denisonii (16,900 bp) was similar. The total AT content of the two fish species was 58.9% and 58.2%, respectively. RSCU and amino acid composition showed that A/T-ending synonymous codons, and Leu was the most abundant amino acid. However, there are significant differences in the length and structure of the control…
Genes, proteins, chemicals, diseases, species, mutations and cell lines named across the full text — each resolved to its canonical identifier and authoritative record.
Click any figure to enlarge with its caption.
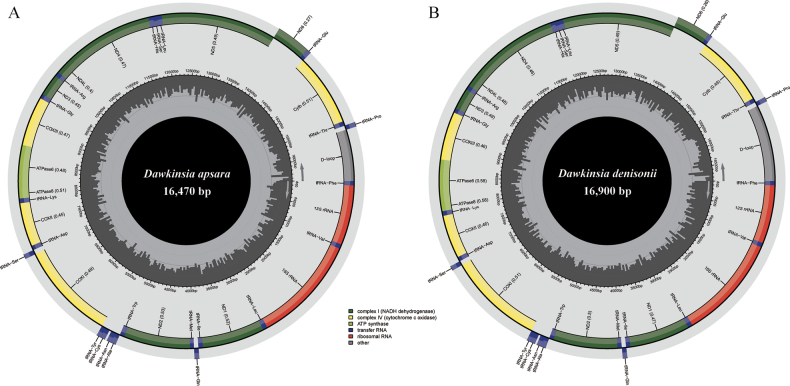 Figure 1
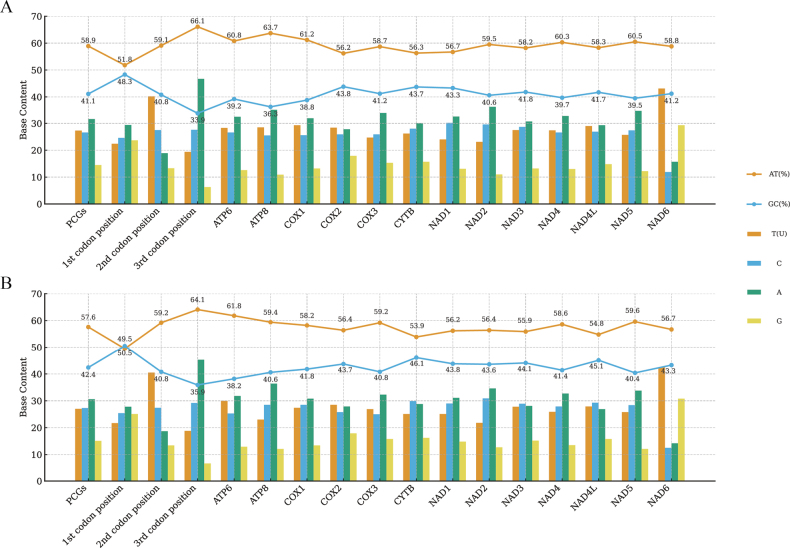 Figure 2
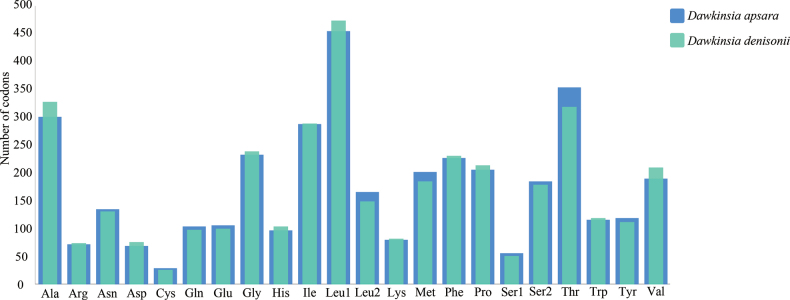 Figure 3
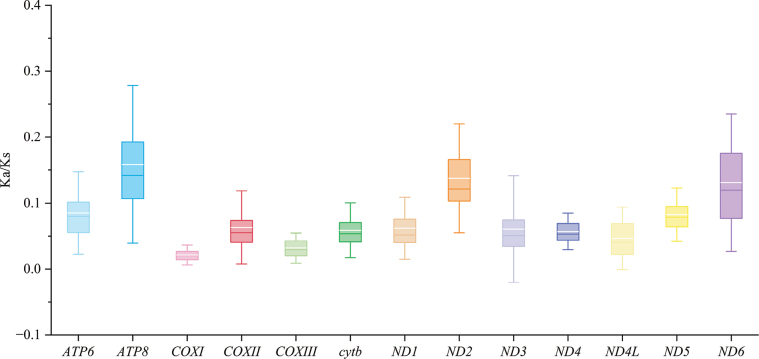 Figure 4
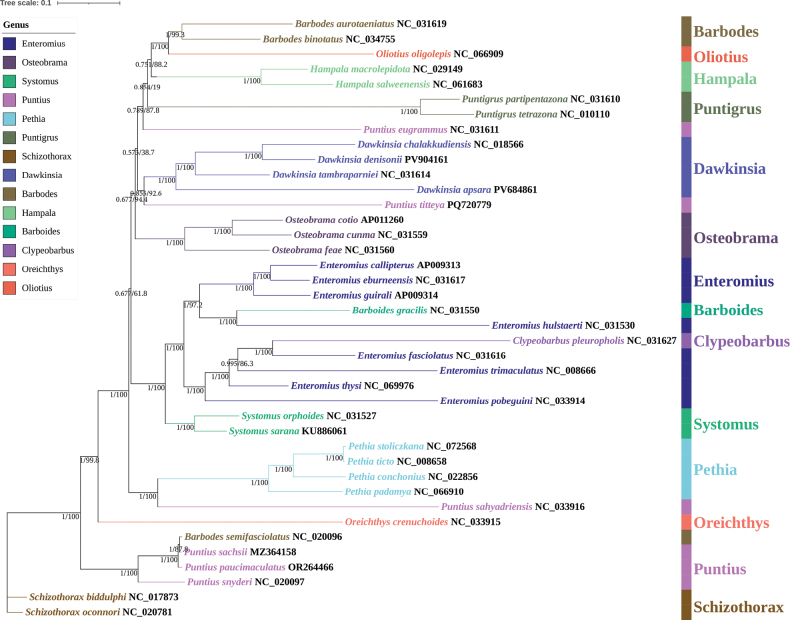 Figure 5
| Subfamily | Species | Size (bp) | ID |
|---|---|---|---|
|
|
| 16562 |
|
|
| 16573 |
| |
|
| 16594 |
| |
|
| 16566 |
| |
|
| 16570 |
| |
|
| 16470 |
| |
|
| 16989 |
| |
|
| 16900 |
| |
|
| 16610 |
| |
|
| 16859 |
| |
|
| 16678 |
| |
|
| 16566 |
| |
|
| 16793 |
| |
|
| 16775 |
| |
|
| 16933 |
| |
|
| 16688 |
| |
|
| 16417 |
| |
|
| 16766 |
| |
|
| 16913 |
| |
|
| 16636 |
| |
|
| 16894 |
| |
|
| 16584 |
| |
|
| 16650 |
| |
|
| 16578 |
| |
|
| 17082 |
| |
|
| 16792 |
| |
|
| 16996 |
| |
|
| 17302 |
| |
|
| 16597 |
| |
|
| 16550 |
| |
|
| 16847 |
| |
|
| 16590 |
| |
|
| 16587 |
| |
|
| 16798 |
| |
|
| 16578 |
| |
|
| 16593 |
| |
|
| 16590 |
| |
|
|
| 16585 |
|
|
| 16590 |
|
| Gene | Position | Size | Intergenic nucleotides | Codon | Anticodon | Strand | ||
|---|---|---|---|---|---|---|---|---|
| From | To | Start | Stop | |||||
|
| 1\1 | 69\69 | 69\69 | 0\0 | GCT | H | ||
|
| 70\70 | 1024\1026 | 955\957 | 0\0 | H | |||
|
| 1025\1027 | 1096\1098 | 72\72 | 0\0 | CAG\CGG | H | ||
|
| 1097\1099 | 2793\2790 | 1697\1692 | 0\0 | H | |||
|
| 2794\2791 | 2867\2866 | 74\76 | 0\0 | ACT | H | ||
|
| 2869\2868 | 3843\3842 | 975\975 | 1\1 | ATG | TAA | H | |
|
| 3855\3847 | 3925\3918 | 71\72 | 11\4 | GGA | H | ||
|
| 3924\3917 | 3994\3987 | 71\71 | -2\-2 | TAG | L | ||
|
| 3996\3989 | 4059\4057 | 64\69 | 1\1 | GGC | H | ||
|
| 4065\4058 | 5109\5099 | 1045\1042 | 5\0 | ATG | T | H | |
|
| 5110\5100 | 5182\5170 | 73\71 | 0\0 | GTG\AGG | H | ||
|
| 5184\5172 | 5252\5240 | 69\69 | 1\1 | GAG\AGG | L | ||
|
| 5254\5242 | 5326\5314 | 73\73 | 1\1 | TAG | L | ||
|
| 5359\5346 | 5425\5411 | 67\66 | 32\31 | AAC\AGC | L | ||
|
| 5425\5411 | 5493\5479 | 69\69 | -1\-1 | GGT | L | ||
|
| 5495\5481 | 7045\7031 | 1551\1551 | 1\1 | GTG | TAA | H | |
|
| 7046\7032 | 7116\7102 | 71\71 | 0\0 | AAG | L | ||
|
| 7118\7104 | 7189\7175 | 72\72 | 1\1 | AAG | H | ||
|
| 7195\7189 | 7885\7879 | 691\691 | 5\13 | ATG | T | H | |
|
| 7886\7880 | 7961\7955 | 76\76 | 0\0 | CTC\CAC | H | ||
|
| 7964\7957 | 8128\8121 | 165\165 | 2\1 | ATG | TAG | H | |
|
| 8122\8115 | 8804\8797 | 683\683 | -7\-7 | ATG | TA | H | |
|
| 8805\8798 | 9589\9582 | 785\785 | 0\0 | ATG | TA | H | |
|
| 9590\9583 | 9663\9655 | 74\73 | 0\0 | ATC | H | ||
|
| 9664\9656 | 10012\10004 | 349\349 | 0\0 | ATA | T | H | |
|
| 10013\10005 | 10083\10074 | 71\70 | 0\0 | AGG\ | H | ||
|
| 10084\10075 | 10380\10371 | 297\297 | 0\0 | ATG | TAA | H | |
|
| 10374\10365 | 11754\11745 | 1381\1381 | -7\-7 | ATG | T | H | |
|
| 11755\11746 | 11823\11814 | 69\69 | 0\0 | GTA | H | ||
|
| 11824\11815 | 11891\11883 | 68\69 | 0\0 | GGG\AAG | H | ||
|
| 11893\11885 | 11965\11957 | 73\73 | 1\1 | GCT | H | ||
|
| 11967\11960 | 13784\13780 | 1818\1821 | 1\2 | ATG | TAA | H | |
|
| 13781\13777 | 14302\14298 | 522\522 | -4\-4 | GTG | TAG | L | |
|
| 14303\14299 | 14371\14366 | 69\68 | 0\0 | ATT\GTT | L | ||
|
| 14377\14373 | 15513\15509 | 1137\1137 | 5\6 | ATG | TAA | H | |
|
| 15517\15514 | 15588\15584 | 72\71 | 3\4 | GCC | H | ||
|
| 15587\15584 | 15656\15654 | 70\71 | -2\-1 | CAG | L | ||
| D-loop | 15657\15655 | 16470\16900 | 814\1246 | 0\0 | H | |||
| Species | Regions | Size (bp) | T(U)/% | C/% | A/% | G/% | AT/% | GC/% | AT skew | GC skew |
|---|---|---|---|---|---|---|---|---|---|---|
|
| Full genome | 16470 | 25.4 | 26.2 | 33.5 | 14.9 | 58.9 | 41.1 | 0.138 | -0.273 |
|
| 11391 | 27.3 | 26.6 | 31.6 | 14.5 | 58.9 | 41.1 | 0.073 | -0.296 | |
| rRNAs | 2652 | 19.9 | 24.4 | 36.1 | 19.6 | 56 | 44 | 0.288 | -0.108 | |
| tRNAs | 1557 | 27.2 | 20.6 | 29.3 | 22.9 | 56.5 | 43.5 | 0.038 | 0.053 | |
| D-loop | 814 | 34.4 | 18.8 | 35.7 | 11.1 | 70.1 | 29.9 | 0.019 | -0.258 | |
|
| Full genome | 16900 | 25.2 | 26.5 | 33 | 15.3 | 58.2 | 41.8 | 0.134 | -0.266 |
|
| 11391 | 27 | 27.3 | 30.6 | 15.1 | 57.6 | 42.4 | 0.063 | -0.289 | |
| rRNAs | 2649 | 19.3 | 25.1 | 35.4 | 20.2 | 54.7 | 45.3 | 0.295 | -0.107 | |
| tRNAs | 1560 | 27 | 21.2 | 29.1 | 22.7 | 56.1 | 43.9 | 0.038 | 0.034 | |
| D-loop | 1246 | 34.6 | 15.5 | 38.8 | 11.2 | 73.4 | 26.6 | 0.057 | -0.161 |
| Codon |
| Codon |
| ||
|---|---|---|---|---|---|
|
|
|
|
| ||
| UUU(F) | 1.05 | 0.96 | UAU(Y) | 0.71 | 0.95 |
| UUC(F) | 0.95 | 1.04 | UAC(Y) | 1.29 | 1.05 |
| UUA(L) | 1.37 | 1.29 | UAA(*) | 2.86 | 2.86 |
| UUG(L) | 0.23 | 0.14 | UAG(*) | 1.14 | 1.14 |
| CUU(L) | 0.83 | 0.78 | CAU(H) | 0.54 | 0.42 |
| CUC(L) | 0.68 | 0.73 | CAC(H) | 1.46 | 1.58 |
| CUA(L) | 2.5 | 2.69 | CAA(Q) | 1.88 | 1.78 |
| CUG(L) | 0.39 | 0.37 | CAG(Q) | 0.12 | 0.22 |
| AUU(I) | 0.99 | 1.06 | AAU(N) | 0.62 | 0.56 |
| AUC(I) | 1.01 | 0.94 | AAC(N) | 1.38 | 1.44 |
| AUA(M) | 1.71 | 1.65 | AAA(K) | 1.82 | 1.93 |
| AUG(M) | 0.29 | 0.35 | AAG(K) | 0.17 | 0.07 |
| GUU(V) | 0.88 | 0.84 | GAU(D) | 0.64 | 0.55 |
| GUC(V) | 0.55 | 0.57 | GAC(D) | 1.36 | 1.45 |
| GUA(V) | 2.19 | 2.08 | GAA(E) | 1.7 | 1.7 |
| GUG(V) | 0.38 | 0.51 | GAG(E) | 0.3 | 0.3 |
| UCU(S) | 0.75 | 0.83 | UGU(C) | 0.55 | 0.38 |
| UCC(S) | 1.12 | 1.49 | UGC(C) | 1.45 | 1.62 |
| UCA(S) | 2.56 | 2.19 | UGA(W) | 1.71 | 1.71 |
| UCG(S) | 0.17 | 0.16 | UGG(W) | 0.29 | 0.29 |
| CCU(P) | 0.39 | 0.34 | CGU(R) | 0.56 | 0.38 |
| CCC(P) | 0.54 | 0.75 | CGC(R) | 0.39 | 0.54 |
| CCA(P) | 2.78 | 2.56 | CGA(R) | 2.89 | 2.92 |
| CCG(P) | 0.29 | 0.36 | CGG(R) | 0.17 | 0.16 |
| ACU(T) | 0.68 | 0.5 | AGU(S) | 0.3 | 0.29 |
| ACC(T) | 1.21 | 1.37 | AGC(S) | 1.1 | 1.04 |
| ACA(T) | 2.07 | 2.04 | AGA(*) | 0 | 0 |
| ACG(T) | 0.05 | 0.09 | AGG(*) | 0 | 0 |
| GCU(A) | 0.7 | 0.7 | GGU(G) | 0.36 | 0.35 |
| GCC(A) | 1.62 | 1.68 | GGC(G) | 0.62 | 0.69 |
| GCA(A) | 1.55 | 1.46 | GGA(G) | 2.27 | 2.18 |
| GCG(A) | 0.12 | 0.16 | GGG(G) | 0.76 | 0.79 |
Peer Reviews
No public reviews on file for this paper yet. If you reviewed it on a platform where reviews are public (OpenReview, ICLR, NeurIPS, ICML), you can paste yours below so the community can read it here.
Videos
No videos yet. Explain this paper in a talk, walkthrough, or lecture? Add one.
Taxonomy
TopicsGenomics and Phylogenetic Studies · Identification and Quantification in Food · Fish Biology and Ecology Studies
Introduction
Species identification is fundamentally based on morphological evidence and is increasingly supported by molecular biological approaches within an integrative taxonomic framework. Among them, the mitochondrial genome has become an ideal molecular marker for phylogenetic research and species identification due to its maternal inheritance, compact structure, and moderate evolutionary rate (Sun et al. 2024; Liu et al. 2025). The mitochondrial DNA of fish is usually a double-stranded circular molecule of approximately 15–20 kb (Boore 1999), containing 13 protein-coding genes (PCGs), two rRNA genes, 22 tRNA genes and a non-coding control region (D-loop) (Pereira 2000). Although gene fragments such as COXI (Chang et al. 2017; Sheraliev and Peng 2021) and 12S rRNA (Miya et al. 2015) are often used as DNA barcodes, the complete mitochondrial genome can provide more comprehensive and uniform genetic variation information, effectively overcoming the phylogenetic uncertainty of single gene markers (Chen et al. 2021; Xie et al. 2022). In recent years, thanks to the popularity of high-throughput sequencing and assembly technology, the number of fish mitochondrial genome data has grown rapidly (Zhang et al. 2023). Osteichthyes has accumulated a large number of mitochondrial genomes and covered dozens of order-level groups, providing sufficient data for cross-group phylogenetic and molecular identification studies (Wang et al. 2022; Zhu et al. 2024).
Cyprinidae is one of the most diverse groups in freshwater fish, and the phylogenetic relationship within it, especially the Puntius-Dawkinsia complex, has long been controversial (Ren et al. 2020; Sudasinghe et al. 2023). Since the work of Pethiyagoda et al. (2012), who analyzed 16S rRNA and Cytb gene fragments from 31 South Asian species traditionally referred to Puntius, it has become evident that the conventional concept of Puntius represents a highly polyphyletic assemblage. Based on molecular evidence and a combination of stable morphological characters—including the absence of rostral barbels, a smooth last unbranched dorsal-fin ray, and a complete lateral line bearing 18–22 lateral line scales—Pethiyagoda and colleagues established Dawkinsia as a distinct genus. Later, Tan and Armbruster (2018) placed Dawkinsia within the subfamily Smiliogastrinae under a broader phylogenetic framework, further clarifying its evolutionary affinities with Pethia, Puntius, Puntigrus, and related genera. However, the genomic divergence among many species within Dawkinsia has not yet been systematically evaluated, and their species boundaries as well as potential molecular diagnostic characters remain unclear. Previous studies have largely relied on short mitochondrial fragments or a limited number of nuclear markers, lacking comprehensive examinations of control-region variation, genome-wide structural differences, and the phylogenetic resolving power of complete mitogenomes (Sudasinghe et al. 2021). As a result, phylogenetic reconstructions have often yielded unstable node support or conflicting topologies across studies, leaving the evolutionary relationships within the complex unresolved.
The Dawkinsia apsara Katwate, Knight, Anoop, Rajeev Raghavan & Dahanukar, 2020 is distinguished by its metallic purple sheen and black lateral spots, whereas D. denisonii (Day, 1865) is well known for the longitudinal scarlet stripes extending across the head and tail (Raghavan et al. 2013; Ali et al. 2015; Katwate et al. 2020). Although the complete mitochondrial genome of D. denisonii has been preserved in GenBank (AP011244), the species is widely traded in the ornamental fish market and has been reported to have hidden lineages (Collins et al. 2012; Jain et al. 2022). In order to verify the stability of the existing mitochondrial genome and evaluate potential intraspecific divergence, we compared the existing sequences with the new test results. Therefore, in this study, we sequenced the complete mitochondrial genome of D. apsara for the first time and independently re-sequenced that of D. denisonii to verify the reliability of existing data. We compared the two species in terms of genome structure, protein-coding gene evolutionary patterns, and D-loop organization, and further reconstructed genus-level phylogenetic relationships using available mitogenome data from the subfamily Smiliogastrinae. Complete mitochondrial genomes are expected to reveal species-level differences that cannot be detected by short fragments and to provide new taxonomic and evolutionary insights into the systematic placement of Dawkinsia and its close relatives.
Materials and methods
Sample collection and DNA extraction
Living samples of D. apsara and D. denisonii were obtained from the Fangcun Flower, Bird, Fish and Insect Market (Guangzhou), and voucher specimens were deposited at the College of Life Sciences, Nanjing Forestry University (Nanjing, China) under accession numbers NFU-Daw-1 and NFU-Daw-2, respectively. In view of the common mislabeling and hybridization problems in the ornamental fish trade, we compared the key characteristics such as body color, body side markings, presence and length of dorsal fin filaments, and body shape ratio of the samples. Among them, D. apsara has the characteristics of metallic purple luster and black spots on the body side, while D. denisonii takes the bright red longitudinal striations throughout the head to the caudal peduncle as the typical morphological markers (Ali et al. 2015; Katwate et al. 2020). The muscle tissue samples of each species were preserved in anhydrous ethanol, and high-quality total DNA was extracted from the tissues using the CTAB method (Porebski et al. 1997).
Mitochondrial genome sequencing and assembly
DNA samples meeting the quality standards were sent to Personal Biotechnology Co., Ltd. (Shanghai, China) for 350 bp small fragment library construction and high-throughput sequencing. PE150 sequencing was performed based on the Illumina NovaSeq 6000 platform, and the sequencing data was retained by quality control to retain valid reads greater than 6–10 GB. The raw reads were subjected to strict quality control using Fastp v0.23.0 software, and the ‘-careful’ mode of SPAdes v3.15.0 software (Bankevich et al. 2012; Nurk et al. 2017) was used to de novo assemble all clean data to obtain complete and circular mitochondrial genome sequences.
Genome annotation and data submission
The assembled circular mitochondrial genome was submitted to the MITOS2 online server (http://mitos2.bioinf.uni-leipzig.de) for automated gene annotation, and the genetic code was set as the vertebrate mitochondrial genetic code table (Bernt et al. 2013). Subsequently, the annotation results were compared with the NCBI NR database by BLAST to verify the accuracy, and the secondary structure of tRNA gene was further verified by tRNAscan-SE software (Lowe and Eddy 1997). Finally, the mitochondrial genome map was drawn using the MitoFish online website (https://mitofish.aori.u-tokyo.ac.jp/) (Zhu et al. 2023). The complete mitochondrial genome sequences of the assembled and annotated two species of Dawkinsia were submitted to the NCBI GenBank database.
Genome analysis
PhyloSuite v1.2.1 was used to calculate the length of each protein-coding gene, rRNA gene, tRNA gene and D-loop region, base composition (A, T, G, C content and AT content, GC content, etc.) and relative synonymous codon usage (RSCU), and identify the start codon and stop codon of all protein-coding genes (Zhang et al. 2020). MEGA v11 was used to calculate the relative usage of synonymous codons of each protein-coding gene in the two species, and the number of effective codons was counted to evaluate the codon usage preference (Kumar et al. 1994). In order to explore the evolutionary dynamics of protein-coding genes, DnaSP v5 was used to calculate the ratio of non-synonymous substitution rate to synonymous substitution rate of each protein-coding gene, and the selection pressure of the gene was evaluated (Librado and Rozas 2009).
Phylogenetic analysis
The mitochondrial genome sequences of Smiliogastrinae fishes were downloaded from NCBI GenBank database, and Schizothorax biddulphi and S. oconnori in another subfamily Schizothoracinae of the same family were selected as outgroups (Table 1). The MAFFT tool was used for multiple sequence alignment (Katoh and Standley 2013). The PCG data set was further optimized using MACSE (Ranwez et al. 2018), and the unclear comparison regions were trimmed with Gblocks (Talavera and Castresana 2007). At the same time, trimAl was used to trim the RNA genes sequence, and Gblocks was used to trim the exogenous sequence. After concatenating the data, the ModelFinder (Kalyaanamoorthy et al. 2017) in PhyloSutie v1.2.1 was used to select the optimal partitioning strategy and model, and the IQ-TREE v1.6.8 (Nguyen et al. 2015) was used to construct the maximum likelihood (ML) phylogenetic tree. The support rate of each branch was evaluated by 50000 ultra-fast bootstrap tests, and the bootstrap value of each branch was calculated. The Bayesian inference (BI) phylogenetic tree was constructed using MrBayes v3.2.6 (Ronquist et al. 2012), and Markov chain Monte Carlo simulation was performed. Two independent Markov chains were set to run a total of 10,000,000 generations. Sampling was performed once every 1,000 generations. The first 25% of the samples were discarded as aging samples. The posterior probability was calculated according to the remaining samples, and the Bayesian posterior probability value of each node was calculated. Finally, the iTOL (https://itol.embl.de/) online website was used to beautify the phylogenetic tree (Letunic and Bork 2016).
Results
Mitochondrial genome structure
The complete mitochondrial genomes of D. apsara and D. denisonii showed a typical circular double-stranded structure, including 37 genes (13 PCGs, 22 tRNA genes and two rRNA genes) and a major non-coding control region (Fig. 1). The genome length of D. apsara is 16,470 bp, and the D-loop region is 814 bp. The genome length of D. denisonii is 16,900 bp, and the D-loop region is 1,246 bp. Most of the genes were located in the heavy chain, and only ND6 and eight tRNA were distributed in the light chain (Table 2). In addition, there are many gene intervals and overlaps in the genome, among which there are seven base overlap regions between ATP8 and ATP6 and between ND4L and ND4. The largest intergenic spacer was located between tRNA-Cys and tRNA-Tyr, with lengths of 31 bp and 32 bp, respectively.
Mitochondrial genome information diagram of D. apsara (A) and D. denisonii (B). Dark green blocks: complex I (NADH dehydrogenase), yellow blocks: complex IV (cytochrome c oxidase), light green blocks: ATP synthase, blue blocks: transfer RNA, red blocks: ribosomal RNA, gray blocks: other.
Table 2.: Mitochondrial genome characteristics of D. apsara and D. denisonii.
Comparison between the newly sequenced mitogenome and the published D. denisonii reference (AP011244) revealed substantial mitochondrial variation. Across the 16,915 bp alignment, 881 polymorphic sites (SNPs) and 22 independent InDel events were detected, corresponding to 881 nucleotide differences and a genome-wide p-distance of 0.0524. These values indicate a level of divergence far exceeding typical sequencing noise and instead suggest marked intraspecific mitochondrial differentiation.
Difference of D-loop
Marked structural divergence was observed in the mitochondrial D-loop between D. apsara and D. denisonii. The D-loop of D. apsara was relatively short (814 bp), whereas that of D. denisonii was substantially longer (1246 bp). This pronounced length difference was primarily attributable to the expansion of a tandem repeat array in D. denisonii. A conserved repeat unit of approximately 60 bp (ACATAATGTATTAGTACATATATGTATTATCACCATAAATTTTATTTAGACCATAAAGCAGGTACTAAATA TTAAGAT) was identified and duplicated six times in the control region of D. denisonii, while this repeat motif was absent in D. apsara. Apart from the repeat array, the remaining regions of the control region showed no large-scale structural rearrangements.
Mitochondrial genome base preference
The genome-wide AT content of D. apsara was slightly higher, 58.9%, and the GC content was 41.1%; the genome-wide AT content of D. denisonii was 58.2%, and the GC content was 41.8% (Table 3). In both species, protein-coding genes, rRNA, tRNA and D-loop regions showed similar AT preference, and the AT content in D-loop region was the highest, reaching 70.1% and 73.4% in D. apsara and D. denisonii, respectively (Table 3). Fig. 2 shows the base composition and quantities, as well as AT content and CG content, of the 13 PCGs in D. apsara and D. denisonii. The analysis of base skew showed that the two species showed consistent positive AT skew and negative GC skew in the whole genome and most regions. The skew values of AT were all positive (D. apsara 0.138, D. denisonii 0.134), indicating that the content of adenine is higher than that of thymine; the GC skewness values were all negative (D. apsara -0.273, D. denisonii -0.266), indicating that the content of cytosine is higher than that of guanine.
The base composition and quantities, as well as AT content and CG content, of the 13 PCGs in D. apsara (A) and D. denisonii (B). X axis: different genomic regions/codon positions. Y axis: percentage of base content (%).
Table 3.: Nucleotide composition of D. apsara and D. denisonii mitochondrial genome.
Mitochondrial genome codon usage frequency
Codon usage frequency analysis showed that the most frequently used amino acids in both species were leucine, followed by isoleucine, threonine, and alanine (Fig. 3). In the analysis of the relative usage of synonymous codons, both species were significantly inclined to use codons ending with A or U (Table 4). For example, the RSCU values of CUA encoding leucine, GUA encoding valine, CCA encoding proline, GGA encoding glycine, and CGA encoding arginine were all greater than 2, showing a strong preference for usage. At the same time, synonymous codons ending with G or C are mostly less used, and the RSCU value is generally less than 0.6. It is worth noting that although AUA usually encodes methionine, its use frequency (RSCU: 1.71 and 1.65) is much higher than the standard AUG methionine codon (RSCU: 0.29 and 0.35) in the mitochondrial genomes of these two fish species.
Codon distribution of D. apsara and D. denisonii mitogenome. Numbers on the Y-axis refer to the total number of codons, and codon families are provided on the X-axis.
Table 4.: Comparison of RSCU between D. apsara and D. denisonii.
Protein-coding genes
It can be seen from Fig. 4 that Ka/Ks values of all PCGs are less than 1. Among them, COXIII showed the smallest Ka/Ks ratio (0.015), and ND2 had the highest Ka/Ks ratio (0.070). COXIII and ND2 represent the two extremes of molecular evolution: COXIII shows strong purification selection, while ND2 shows relatively high evolutionary flexibility. In terms of protein-coding genes, the gene composition and order of the two species are highly conserved. The termination codon analysis showed that ND2, COXII, ND3 and ND4 genes were terminated by a single T base in both species. ATP6 and COXIII genes use TA; the remaining genes such as ND1, ND4L, ND5 and Cytb use the complete TAA or TAG termination codon (Table 2).
Analysis of Ka/Ks ratios for 13 protein-coding genes across 37 species of Smiliogastrinae. The white horizontal line is the mean line, and the horizontal line with the same color as the box is the median line.
Phylogenetic relationship
Phylogenetic analysis clearly showed that all Dawkinsia species clustered into a monophyletic group with high support, confirming the effectiveness of the genus (Fig. 5). D. denisonii formed a strongly supported sister relationship with D. chalakkudiensis, and this pair subsequently clustered with D. tambraparniei; this three-species clade was then grouped with D. apsara. All Dawkinsia species formed a well-supported monophyletic group. At a higher level of classification, the phylogenetic tree revealed that the genus Dawkinsia was closely related to some species of Puntigrus and Puntius (such as P. eugrammus), which together constituted a strong monophyletic branch. This clade formed a sister group relationship with Barbodes, Systomus, Pethia, and other genera.
Phylogenetic tree inferred from Bayesian inference (BI) and maximum likelihood (ML) analyses based on the nucleotide sequences from 37 Smiliogastrinae fishes and two outgroups. Nodal support values are shown as BI posterior probabilities/ML bootstrap values.
Discussion
Genome structure characteristics
The mitochondrial genome lengths of D. apsara and D. denisonii obtained in this study fall within the typical size range reported for fish mitogenomes, 15–19 kb (Gong et al. 2025). The control region length heterogeneity between D. apsara and D. denisonii is explained by lineage-specific expansion of tandem repeats rather than by random insertions or sequencing artifacts. Tandem repeat expansion in the mitochondrial control region is a well-documented source of length variation in teleost fishes and is generally associated with the hypervariable nature of this D-loop (Lee et al. 1995; Kundu et al. 2023). Combined with Dawkinsia filamentosa (full length 16,598 bp, D-loop 931 bp) in this genus, this situation can be more proved (Sun and Lu 2024). The presence of six repeat copies in D. denisonii, contrasted with their absence in D. apsara, indicates pronounced interspecific structural divergence and suggests is a more prudent description of the control region within Dawkinsia. Such repeat copy number variation may arise through replication slippage and has been reported in several cyprinid lineages, further supporting that the observed pattern represents genuine biological variation, such as Pethia padamya (Pan et al. 2023), Pethia nigrofasciata (Sun and Lu 2024) and Pethia stoliczkana (Qiao et al. 2024), which exhibit mtDNA lengths ranging from 16,792 to 16,966 bp and D-loop regions from 1,134 to 1,340 bp. However, these structural differences can reflect the evolutionary dynamics of lineage specificity, rather than the main criteria for taxonomic classification (Mahai et al. 2024). Therefore, the inference of phylogenetic relationships mainly comes from protein-coding genes, which provide more conserved and comparable evolutionary signals.
The newly sequenced D. denisonii mitogenome exhibited 5.24% divergence from the published GenBank sequence, together with 881 SNPs and 22 InDel events, indicating substantial mitochondrial variability within the species. Such levels of divergence are well above the range of technical or assembly-related artifacts and have been documented in several cyprinid taxa as signatures of geographically structured populations or cryptic mitochondrial lineages (Collins et al. 2012). Given that D. denisonii is heavily traded in the ornamental fish market, individuals from different river systems may be mixed under the same commercial label, potentially explaining the observed mitochondrial divergence (Jain et al. 2022). Our resequencing effort therefore provides an essential complementary dataset and highlights previously unrecognized intraspecific diversity in Dawkinsia.
Base composition preference and mutation pressure
Both Dawkinsia mitochondrial genomes showed significant AT bias (~ 58%), and showed consistent positive AT bias and negative GC bias. This pattern is highly consistent with the report of Pethia (Qiao et al. 2024), Enteromius (Kundu et al. 2023), Puntius (Jang-Liaw et al. 2013), and Systomus (Biswal et al. 2017), reflecting the co-evolution trajectory of the mitochondrial genome of Cyprinidae under the action of replication mechanism and chain-specific mutation pressure. This cross-group consistent base composition characteristic strengthens the reliability of the two results of Dawkinsia, suggesting that the AT/GC bias can be used as an important background parameter for comparative genomics research of Cyprinidae fish, but its diagnostic value in genus classification is limited.
Codon usage pattern and selection pressure
Codon usage analysis showed that both species strongly preferred synonymous codons ending with A/U, with leucine (Leu) being the most frequently used, and the use of AUA (encoding methionine) was significantly more than that of the standard codon AUG. This codon usage pattern is consistent with the ‘strong A/U terminal preference’ reported by Pethia stoliczkana (Qiao et al. 2024), Enteromius thysi (Kundu et al. 2023) and other related species, which is mainly driven by AT mutation pressure at the genome level, rather than translation efficiency optimization. Selection pressure analysis further revealed that all protein-coding genes were subjected to purification selection (Ka/Ks < 1), but there were significant differences among different genes. This differential selection pattern reflects the different functional importance of different genes in the energy metabolism system. Similar gene-specific selection differences have also been reported in studies of Osteobrama belangeri (Barman et al. 2017), Oliotius oligolepis (Sun et al. 2023) and Puntius conchonius (Xu et al. 2015).
Conservatism of gene overlap/interval
Typical short overlaps such as ATP8-ATP6 and ND4L-ND4 and a small number of unequally spaced regions were observed in both species, which was consistent with the ‘compact’ mitochondrial gene arrangement of Hampala macrolepidota (Liu et al. 2015), P. conchonius (Xu et al. 2015), E. thysi (Kundu et al. 2023), etc., reflecting the long-term selection constraints of carp mitochondria on compact tissue structure. This conservation means that even if the control region length drifts, the relative position of the coding region, the reading frame and the cross-gene boundary relationship remain stable, thus ensuring the robustness of protein synthesis and respiratory chain function.
Phylogenetic relationship and taxonomic significance
ML and BI analyses based on the mitochondrial PCGs, rRNA genes and tRNA genes showed that D. denisonii first formed a strongly supported sister relationship with D. chalakkudiensis, which together clustered with D. tambraparniei; this clade was subsequently grouped with D. apsara. All Dawkinsia species formed a well-supported monophyletic group. In this study, only the mitochondrial D-loop were not used for phylogenetic reconstruction because they allow reliable codon-based alignments and retain sufficient phylogenetic signal at the interspecific level. In contrast, the D-loop were excluded due to their high sequence variability, potential substitution saturation, and alignment ambiguities caused by length variation and tandem repeats. This is consistent with the results of recent studies on multiple mitochondrial systems: in the phylogenetic tree of P. stoliczkana, P. ticto, P. padamya, and D. denisonii were clustered into adjacent branches (Qiao et al. 2024); Oliotius oligolepis is also located within Smiliogastrinae, adjacent to the Puntius group (Sun et al. 2023). Previous phylogenetic studies of Dawkinsia and its related genera mainly relied on mitochondrial short fragments, such as 16S rRNA and Cytb, which generated inconsistent or weakly supported topologies in multiple interspecific relationships (Pethiyagoda et al. 2012). In contrast, the phylogenetic framework inferred from complete mitochondrial protein-coding genes in this study provides a more robust and well-supported topology that addresses these previously ambiguous nodes through a consistent stepwise clustering pattern within Dawkinsia. The strong support values recovered at the main node indicate that the use of complete mitochondrial genomes greatly improves the resolution of phylogenetics and clarifies previously uncertain interspecific relationships, thereby strengthening the systematic position of species within the genus.
In the past, Dawkinsia was seen as a composite subgroup of Puntius (Zheng et al. 2016; Tan and Armbruster 2018). However, with the accumulation of high-throughput sequencing data, many studies have pointed out that Puntius is a multi-lineage group, while Dawkinsia, Pethia, and Sahyadria are independent evolutionary branches. The phylogenetic tree showed that some species traditionally classified as Puntius were not clustered in the core Puntius branch, but formed closer phylogenetic relationships with Dawkinsia and Pethia, respectively. This result provides more solid molecular evidence for the taxonomic revision of Dawkinsia separated from Puntius, and also suggests that the traditional concept of Puntius may still contain heterogeneous groups that need to be further clarified. Recent studies on the genus Enteromius in Africa have also revealed significant phylogenetic differentiation, indicating that the phylogenetic relationship of small carps is complex and often accompanied by geographical isolation (Kundu et al. 2023).
Conclusions
In this study, the complete mitochondrial genome sequence of D. apsara was obtained for the first time, and D. denisonii was re-sequenced, which significantly enriched the genome resources of the genus Dawkinsia. By combining this sequence with the extended Smiliogastrinae mitochondrial genome dataset, we verified and refined the phylogenetic relationship between Dawkinsia and its related genera such as Puntius and Pethia at the genome scale. In addition, the comparative analysis further revealed significant differences in the structure of the mitochondrial control region between the two species, indicating that there is an evolutionary differentiation at the mitochondrial genome level within the Dawkinsia genus. Taken together, this study not only deepens the understanding of the phylogenetic relationship and evolutionary differentiation pattern of the genus Dawkinsia at the complete mitochondrial genome level, but also provides new molecular evidence for the taxonomic study of the genus Dawkinsia and its related groups.
The reference list from the paper itself. Each links out to its DOI / PubMed record.
- 1Ali A, Raghavan R, Dahanukar N (2015) Sahyadria denisonii. The IUCN Red List of Threatened Species 2015: e.T 169662 A 70082469. 10.2305/IUCN.UK.2015-1.RLTS.T 169662 A 70082469.en · doi ↗
- 2Bankevich A, Nurk S, Antipov D, Gurevich AA, Dvorkin M, Kulikov AS, Lesin VM, Nikolenko SI, Pham S, Prjibelski AD, Pyshkin AV, Sirotkin AV, Vyahhi N, Tesler G, Alekseyev MA, Pevzner PA (2012) SP Ades: A new genome assembly algorithm and its applications to single-cell sequencing. Journal of Computational Biology: A Journal of Computational Molecular Cell Biology 19(5): 455–477. 10.1089/cmb.2012.0021 PMC 334251922506599 · doi ↗ · pubmed ↗
- 3Barman AS, Singh M, Pandey PK (2017) Complete mitochondrial genome of near threatened fish species Osteobrama belangeri (Cypriniformes: Cyprinidae). Mitochondrial DNA, Part B, Resources 2(1): 300–301. 10.1080/23802359.2017.1331327 PMC 780049633473805 · doi ↗ · pubmed ↗
- 4Bernt M, Donath A, Jühling F, Externbrink F, Florentz C, Fritzsch G, Pütz J, Middendorf M, Stadler PF (2013) MITOS: Improved de novo metazoan mitochondrial genome annotation. Molecular Phylogenetics and Evolution 69(2): 313–319. 10.1016/j.ympev.2012.08.02322982435 · doi ↗ · pubmed ↗
- 5Biswal JR, Singh RK, Dutta N, Pathak A, Lal KK, Mohindra V, Sah RS, Jena JK (2017) The complete mitochondrial genome of olive barb, Systomus sarana sarana (Hamilton, 1822) and its phylogenetic status. Mitochondrial DNA. Part B, Resources 2(2): 940–942. 10.1080/23802359.2017.1413319 PMC 780053133474046 · doi ↗ · pubmed ↗
- 6Boore JL (1999) Animal mitochondrial genomes. Nucleic Acids Research 27(8): 1767–1780. 10.1093/nar/27.8.1767 PMC 14838310101183 · doi ↗ · pubmed ↗
- 7Chang CH, Shao KT, Lin HY, Chiu YC, Lee MY, Liu SH, Lin PL (2017) DNA barcodes of the native ray-finned fishes in Taiwan. Molecular Ecology Resources 17(4): 796–805. 10.1111/1755-0998.1260127717215 · doi ↗ · pubmed ↗
- 8Chen X, Yuan Z, Li C, Dietrich CH, Song Y (2021) Structural features and phylogenetic implications of Cicadellidae subfamily and two new mitogenomes of leafhoppers. PLOS ONE 16(5): e 0251207. 10.1371/journal.pone.0251207 PMC 812132533989310 · doi ↗ · pubmed ↗