Large-scale comparative analysis of the nuclear factor-Y transcription factors across 320 horticultural and other plants
Kai Luo, Mingchao Li, Man Liu, Xitao Jia, Zhou Li, Xuechun Zhao, Jihui Chen, Xinyao Gu, Jin He, Chao Chen, Rui Dong

TL;DR
This paper studies the evolution of NF-Y genes in 320 plant species, revealing how they expanded and diversified across different plant lineages.
Contribution
The study provides the first large-scale comparative analysis of NF-Y transcription factors across a broad range of horticultural and other plant species.
Findings
NF-Y genes originated in charophytes and expanded through different duplication mechanisms in various plant lineages.
Higher plants show motif loss in some NF-Y genes, indicating evolutionary sequence variations.
NF-Y genes in Arabidopsis interact with other transcription factors like Myb_DNA-binding and APETALA2 families.
Abstract
Nuclear factor Y (NF-Y), evolutionarily conserved heterotrimeric transcription factors (TFs), are found throughout eukaryotic organisms. Comprising the NF-YA, NF-YB, and NF-YC subfamilies, this family is established as playing critical roles in plant growth and development. While earlier research has mainly centered on the functional and evolutionary characteristics of NF-Y within individual plant species, large-scale analyses and evolutionary patterns of these genes across major plant lineages remain largely unexplored. Here, we systematically identified 15 392 nonredundant genes of NF-Y family from 320 horticultural and representative plant species. Our findings showed that this gene family originated from charophytes. In bryophytes, pteridophytes, and gymnosperms, dispersed duplication served as the predominant mode of NF-Y gene expansion, whereas in angiosperms, their expansion was…
Genes, proteins, chemicals, diseases, species, mutations and cell lines named across the full text — each resolved to its canonical identifier and authoritative record.
Click any figure to enlarge with its caption.
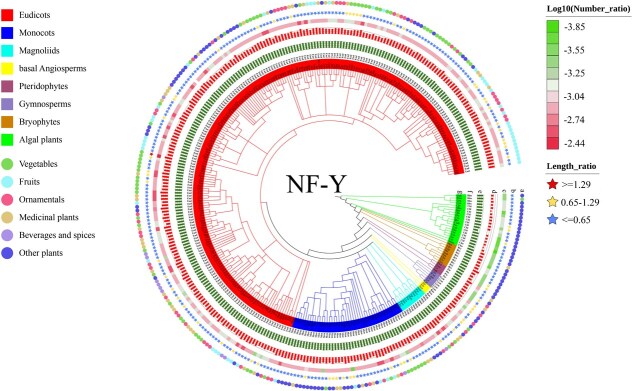 Figure 1
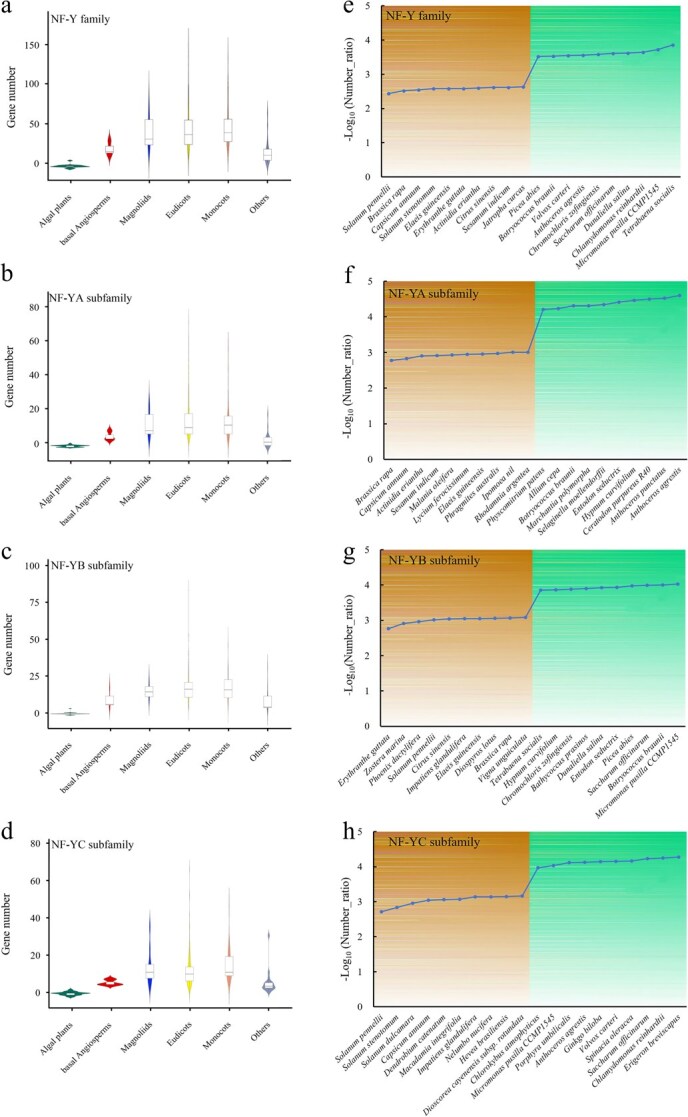 Figure 2
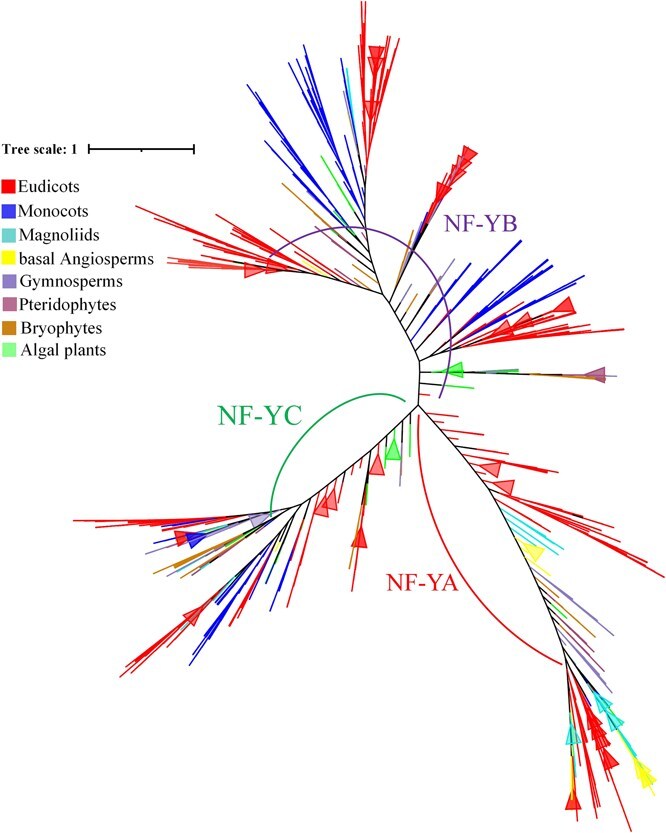 Figure 3
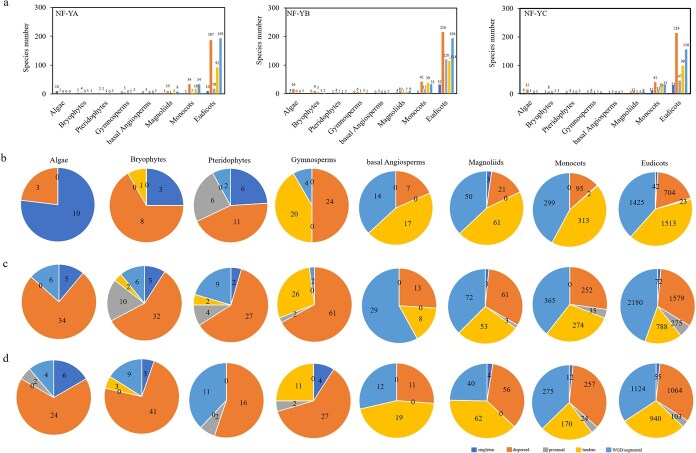 Figure 4
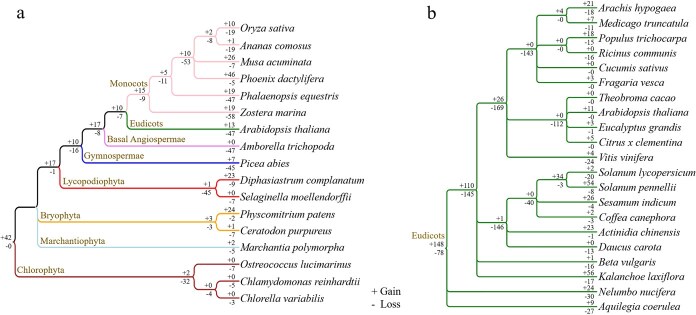 Figure 5
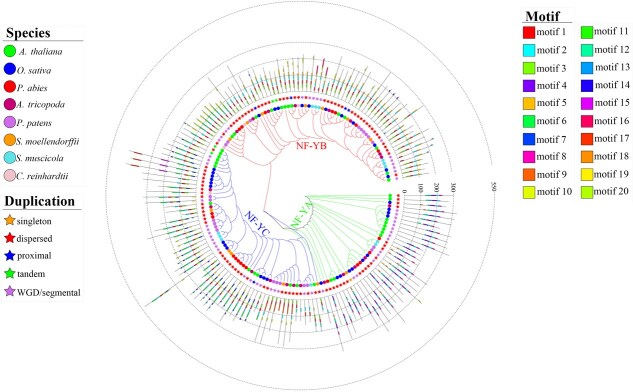 Figure 6
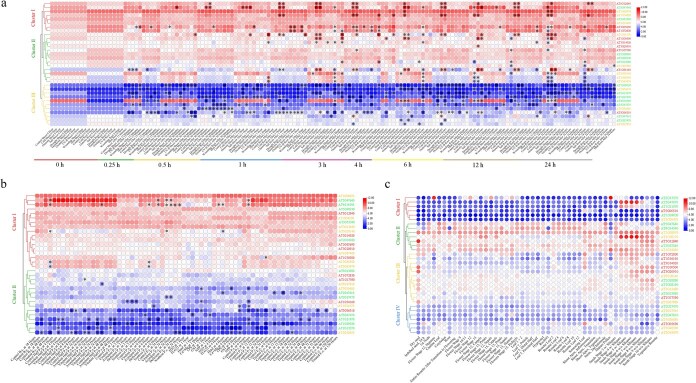 Figure 7
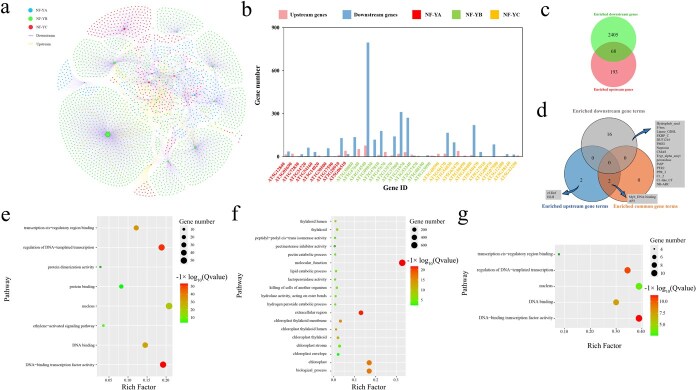 Figure 8
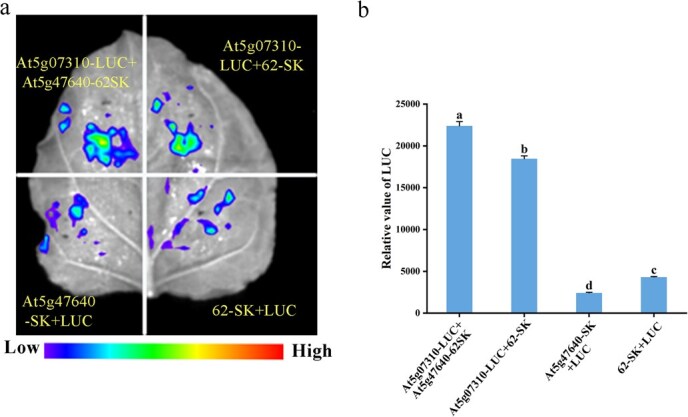 Figure 9
- —GZMARS-Forage Industry Technology System of Guizhou Province
- —Qian Ke He Cheng Guo
- —National Natural Science Foundation of China10.13039/501100001809
Peer Reviews
No public reviews on file for this paper yet. If you reviewed it on a platform where reviews are public (OpenReview, ICLR, NeurIPS, ICML), you can paste yours below so the community can read it here.
Videos
No videos yet. Explain this paper in a talk, walkthrough, or lecture? Add one.
Taxonomy
TopicsPlant Molecular Biology Research · Plant Gene Expression Analysis · Polysaccharides and Plant Cell Walls
Introduction
Plant development in natural environments is governed by diverse gene regulatory network and precisely regulated by numerous transcription factors (TFs) [1]. These TFs primarily regulate gene expression by binding promoter cis-acting elements or activating specific sequences that modulate transcriptional activity [2]. In plants, the complexity of TF regulatory networks arises from two key sources: the sheer abundance of TFs (reaching up to 2000 per genome) and their extensive diversity, spanning >50 families defined by DNA-binding domains [3]. Due to their central role in gene regulation, TFs offer promising targets for genetic manipulation to enhance crop productivity and improve resilience against biotic and abiotic stresses. Nuclear factor Y (NF-Y), alternatively termed CCAAT-binding factor (CBF) or heme activator protein (HAP), represents a ubiquitous and highly conserved family of TFs in eukaryotes. A defining feature of NF-Y is its selective binding to the conserved CCAAT motif in gene promoters [4]. The canonical NF-Y complex comprises three evolutionarily conserved subunits, namely NF-YA (also known as HAP2/CBF-B), NF-YB (HAP3/CBF-A), and NF-YC (HAP5/CBF-C), which assemble into a heterotrimer to perform their regulatory functions [5,6]. Among them, the NF-YA subunit contains critical domains for interactions with the other two subunits, as well as a DNA-binding domain that enables sequence specifically recognize of the CCAAT motif. Meanwhile, possessing a highly conserved histone-fold motif (HFM), NF-YB and NF-YC share structural features with histones H2B and H2A, respectively [7,8]. Within the NF-Y heterotrimer, NF-YA serves as the DNA-binding component, while the other two subunits stabilize the complex facilitate chromatin remodeling and recruit additional regulatory proteins [9,10]. In contrast to yeast and mammals, where each NF-Y subunit is typically encoded by a single gene, plant genomes possess multiple genes encoding members of each subunit category [11]. Arabidopsis thaliana harbors 36 NF-Y subunits (10 NF-YAs, 13 NF-YBs, 13 NF-YCs), while rice (Oryza sativa) contains 34 with 11 NF-YAs, 11 NF-YBs, and 12 NF-YCs subunits [12,13]. Given that the functional NF-Y complex typically comprises single copy from each subunit group, it is theoretically possible for a vast array of assemblies to theoretically. Recent phylogenomic evidence suggests that the evolutionary origin of NF-Y TFs traces back to early streptophyte algae, marking their emergence prior to the colonization of land [11]. During the transition to terrestrial environments, bryophytes, such as Physcomitrium patens expanded the NF-Y repertoire through dispersed duplication, resulting in multiple paralogs exhibiting divergent expression in response to desiccation and abscisic acid (ABA) signaling [14]. Similarly, in lycophytes and ferns, NF-Y members display structural conservation but increased regulatory diversity, reflecting early subfunctionalization of the three NF-Y subunits [8,15].
Recent research has highlighted the critical role of NF-Y TFs in plant organ development, as well as responses to biotic/abiotic stresses [6,16]. In A. thaliana, AtNF-YB9 (LEC1) functions as a pivotal regulator in embryonic development and seed development, while AtNF-YC3, AtNF-YC4, and AtNF-YC9 contribute to photomorphogenesis and seed dormancy [17–23]. In wheat (Triticum aestivum), TaNF-YB1 interacts with TaMADS29 to regulate kernel development [24]. CmNF-YB8 gene in chrysanthemum (Chrysanthemum morifolium) could regulate flowering time by directly regulating cmo-miR156 [25]. Furthermore, OsNF-YB1 has been shown to be essential for grain filling in rice by modulating the expression of sucrose transporter genes, whereas OsNF-YA7 contributes to improved drought resilience via its involvement in the ABA-mediated signaling pathway [26,27]. NF-Y genes also contribute to symbiotic root nodule formation in legumes, where they participate in hierarchical transcriptional activation cascades within nodule morphogenetic signaling [28–31]. Moreover, NF-Y modulate plant-pathogen interactions, demonstrating their functional significance in immune mechanisms [32–34]. The results of these studies suggest that NF-Y members in plants might have functionally diverged.
During recent decades, a growing number of NF-Y homologous genes have been revealed in several single species, such as Zea mays [35,36], Glycine max [37], Solanum tuberosum [38], Vitis vinifera [39], Brassica napus [40], Cucumis melo [41], Solanum lycopersicum [42], Prunus persica [43], Medicago sativa [44], Malus domestica [45], Populus trichocarpa [46], and Ginkgo biloba [47]. While studies in a limited number of species suggest that NF-Y proteins originated before the emergence of land plants, no research to date has provided a comprehensive view of the genome-wide expansion and evolution of this gene family in other major plant lineages, such as bryophytes, pteridophytes, and algae. As more plant genomes become available, our understanding of the origin and evolution of NF-Y genes will continue to improve.
Thus, to improve knowledge on the evolutionary of the NF-Y family in plants, we conduct a large-scale comparative study of NF-Y gene in 320 species across the major plant lineages by using high-quality genomic data. Our analysis explores their evolutionary origins, expansion mechanisms, expression patterns, and regulatory networks, providing new insights into their functional roles. These findings offer a theoretical framework for future research and potential applications in crop improvement strategies.
Results
Identification and distribution of NF-Y family members across 320 species
To trace the evolutionary trajectory of plant NF-Y proteins, we analyzed 320 species representing major plant lineages. All selected species completed whole-genome sequencing and represent major plant taxa. The examined species comprised 20 algae and 300 land plants. The latter group included 223 eudicots, 44 monocots, 3 basal angiosperms, 11 magnoliids, 9 bryophytes, 6 gymnosperms, and 4 pteridophytes. Notably, more than 70% of these species were horticultural plants, including 47 fruit trees, 69 vegetables, 51 ornamental plants, 48 medicinal plants, and 11 beverage and spice plants (Fig. 1; Figs S1–S3; Table S1).
A comparative study on NF-Y gene families spanning 320 plant species. (a) Classification of 320 species, encompassing horticultural plants (fruits, vegetables, ornamentals, medicinal plants, and beverages and spices) alongside other representative species. (b) The ratio of the NF-Y protein length to the mean length of all proteins encoded in the genome of each species. (c) Log10 ratio of the number of NF-Y genes in each species to the number of protein-coding genes in its whole-genome. (d) Log2 value of the number of NF-Y genes in each species. (e) Log10 of the number of total protein-coding genes for each species. (f) Classification of each species. (g) The abbreviated Latin names of each species, with full names provided in Table S1.
A total of 15 392 nonredundant NF-Y genes (4702 NF-YAs, 6302 NF-YBs, and 4388 NF-YCs) were identified across these 320 species based on the detection of conserved NF-Y domains (Fig. 1; Figs S1–S3; Tables S2–S6). A notable expansion in the number of genes encoding NF-Y orthologs was observed in land plants relative to algal species (Fig. 2a–d). The observed variation in gene copy number among land plants, ranging from 9 to 163, likely stems from episodic whole-genome or segmental duplications, coupled with subsequent gene loss events. The algal plants possessed 1 to 12 NF-Y genes, while only one such genes could be found in the Picochlorum sp. SENEW3, a unicellular aquatic alga. Despite this variability, all 320 examined species contained NF-Y gene, suggesting that the plant NF-Y family originated during the charophyte period.
Comparative investigation of NF-Y gene families across plant species. (a–d) Distribution of NF-Y gene numbers among different categories of plants, visualized as a boxplot. (e–h) Comparison of NF-Y gene to protein-coding gene numbers in representative plants, expressed as a -log10 ratio. The ten species on the left of the horizontal axis correspond to those with the maximal ratio of identified NF-Y genes, whereas the ten species on the right correspond to those with the minimal ratio.
Our study further compared per-species gene number for this family with total number of protein-coding genes in its genome (Fig. 2e–h; Tables S3–S6). Comparative analysis demonstrated expanded NF-Y gene numbers in land plants relative to algal lineages. The top 10 species by NF-Y gene abundance are all higher plants, containing nine eudicots (Solanum pennellii, Brassica rapa, Capsicum annuum, Solanum stenotomum, Erythranthe guttata, Actinidia eriantha, Citrus sinensis, Sesamum indicum, and Jatropha curcas) and one monocot (Elaeis guineensis) (Fig. 2e; Table S3). Conversely, 7 out of the 10 species with the lowest proportion of this family were classified as algal plants (Fig. 2e; Table S2). In Tetrabaena socialis, which had the lowest percentage of NF-Y family genes, only 2 NF-Y genes were identified among its 14, 296 total proteins, accounting for just 0.014% of its genome (Table S3). Similarly, the 10 species with the highest and lowest proportions of the 3 NF-Y subfamily members were shown in Fig. 2f–h, and Tables S4–S6. Notably, no NF-YA genes were detected in one rhodophyte (Cyanidiococcus yangmingshanensis) and seven chlorophytes (Chlamydomonas reinhardtii, Dunaliella salina, T. socialis, Volvox carteri, Chromochloris zofingiensis, Micromonas pusilla CCMP1545, and Picochlorum sp. SENEW3) (Table S4). Additionally, two chlorophytes (T. socialis and Picochlorum sp. SENEW3) lacked NF-YC genes (Table S6). Despite interspecific variation in the number of NF-Y gene copies, the number of NF-Y homologs in plant genomes is positively correlated with the total number of protein-coding genes according to Spearman correlation analysis (r = 0.655, P < 0.001) (Fig. S4).
Predicted NF-Y protein sequences across species typically ranged from 200 to 300 amino acids, beginning with an initiation codon and ending with a stop codon. The average length of NF-Y members exceeded those of all protein database sequences in only two species (S. pennellii and Solanum pimpinellifolium) (Table S3). Among the 3 NF-Y subfamilies, NF-YA genes were the longest on average (297.5 a.a.), followed by NF-YC (245.8 a.a.), while NF-YB genes were the shortest (190.3 a.a.) (Fig. 1; Table S3). Additionally, we analyzed and contrasted the average protein length of NF-Y members with the average lengths of all proteins within each species’ genome (Figs S1–S3; Tables S3–S5).
To investigate the classification and evolutionary dynamics of NF-Y genes, we performed phylogenetic analysis based on 15 392 NF-Y sequences identified from 320 plant species (Fig. 3). The resulting phylogeny grouped NF-Y members into 3 main categories, NF-YA, NF-YB, and NF-YC, which match the known subfamily classifications. In each subfamily, most branches include NF-Y genes from diverse plant taxa, with those from algal plants located at the root of the phylogenetic tree. Interestingly, certain branches within the NF-YA and NF-YB subfamilies exclusively comprised monocot and dicot genes, with these lineages exhibiting clear phylogenetic separation. This pattern suggested that NF-Y genes evolved independently within each lineage following species divergence.
Phylogenetic analysis of the NF-Y gene family across 320 species. Amino acid sequences were aligned to construct phylogenetic tree using FastTree (v2.1.11).
Characterization of duplication types within the NF-Y family
In plant lineages, frequent gene expansion or duplication events are typically followed by sequence or functional divergence, contributing to subfunctionalization, the emergence of novel material, and potential adaptive benefits [48,49]. Multiple mechanisms have been proposed to account for gene duplication in plants, including whole genome duplication (WGD), segmental duplication, local events such as tandem and proximal duplications, as well as dispersed duplication [48–51]. The various duplication models differ in their gene retention tendencies, with some favoring the preservation of redundant copies, while others facilitate the emergence of novel functions and evolutionary diversification. To investigate NF-Y gene duplication across species, we inferred the underlying duplication mechanisms for all identified NF-Y family members in the analyzed genomes through MCScanX [52]. We further examined the distribution of species and genes within each NF-Y subfamily across these duplication modes. Overall, the expansion mechanisms of NF-Y genes varied across plant taxa (Fig. 4; Tables S7–S9). Within the NF-YA subfamily, algal species contained a higher proportion of singleton genes. In contrast, NF-YA genes in higher plants exhibited lineage-specific expansion patterns. Bryophytes and pteridophytes primarily expanded through dispersed duplication, while gymnosperms expanded through both dispersed and tandem duplication, and basal angiosperms expanded through both WGD/segmental and dispersed duplication. Within magnoliids, monocots, and dicots, NF-YA genes increased in number mainly by WGD/segmental duplication, and tandem duplication (Fig. 4a and b; Tables S7–S9). Dispersed duplication was identified as the primary driver of NF-YB subfamily expansion in algae, bryophytes, pteridophytes, and gymnosperms. In basal angiosperms, WGD/segmental and dispersed duplications played a major role, whereas magnoliids and monocots expanded through a combination of dispersed, WGD/segmental, and tandem duplication. In dicots, dispersed and WGD/segmental duplications were the predominant mechanisms (Fig. 4a and c; Tables S7–S9). A parallel pattern occurred in the NF-YC subfamily, with dispersed duplication serving as the predominant expansion mechanism for algal, bryophyte, pteridophytes, and gymnosperm lineages. Basal angiosperms primarily expanded through WGD/segmental and dispersed duplication. In evolutionary advanced angiosperm lineages (including magnoliids, monocots, and dicots), the expansion of NF-YC genes predominantly resulted from a combination of dispersed duplications, WGD/segmental duplications, and tandem duplication events (Fig. 4a and d; Tables S7–S9). Across all NF-Y subfamilies, relatively few genes were classified under the proximal duplication type (Fig. 4; Tables S7–S9), suggesting that this mechanism played a minor role in NF-Y family expansion.
Duplication type of NF-Y family genes for 320 species. (a) The statistics of species with different duplicate models in NF-Y genes across different taxa. The number of species of each duplication type in NF-Y family in different evolutionary lineages was quantified. (b) The proportion of NF-YA subfamily genes relative to total duplication events was evaluated across distinct taxonomic groups. (c) The proportion of NF-YB subfamily genes relative to total duplication events was evaluated across distinct taxonomic groups. (d) The proportion of NF-YC subfamily genes relative to total duplication events was evaluated across distinct taxonomic groups.
Loss and gain events of NF-Y genes during evolution
To further clarify the evolutionary trajectories of NF-Y genes, this study investigated events of duplication/loss across 17 representative species encompassing major evolutionary clades. These included three Chlorophyta, one Marchantiophyta, two Bryophyta, two Lycopodiophyta, one Gymnospermae, one basal Angiospermae, one eudicot, and six monocots (Fig. 5a).
Loss and gain events of NF-Y genes in representative species using Notung software. (a) Analysis of gain/loss events within the NF-Y gene across representative species from diverse taxonomic groups. (b) Analysis of gain/loss within the NF-Y gene across representative eudicots. Branch-specific gain/loss events are denoted by numeric annotations (‘–’ = loss, ‘+’ = gain).
Phylogenetic reconstruction revealed multiple independent and significant NF-Y gene loss/gain events throughout plant evolution. Within the ancestral lineage shared by these 17 plant species, a total of 42 NF-Y genes experienced duplication events, while no instances of gene loss were observed (Fig. 5a). However, subsequent evolutionary events varied across lineages. We found that an ancestor shared by three Chlorophyta species lost 32 genes but gained only two genes. Similarly, in the common ancestor of the two Bryophyta species, three genes were lost, while three were duplicated. In contrast, the lineage leading to bryophytes and other land plants underwent a total of 17 genes gain but only 1 gene lost (Fig. 5a). Despite widespread WGD and WGT events in land plants, NF-Y gene losses generally outnumbered gains in most representative species, except for Diphasiastrum complanatum, Phoenix dactylifera, Musa acuminata, and P. patens (Fig. 5a).
Moreover, we investigated the evolutionary trajectories of NF-Y members by assessing gene gain/loss events in a set of 21 representative eudicot genomes. The results show that the frequency of gene losses and gains varied among eudicot species (Fig. 5b). In summary, NF-Y gene gain and loss patterns did not show a clear correlation with life history traits or evolutionary distances among species. These findings suggest that the dramatic variation in NF-Y gene family size is driven by lineage-specific evolutionary processes.
Conserved motif identification and distribution
To deepen our understanding of phylogenetic relationships among NF-Y gene, we performed an analysis of conserved motifs. Eight representative plant species from different evolutionary lineages, ranging from algal plants to land plants, were selected. These included two chlorophyte algae (Spirogloea muscicola and C. reinhardtii), one moss and one lycophyte (P. patens and Selaginella moellendorffii), one gymnosperm (Picea abies), one basal angiosperm (Amborella trichopoda), and two angiosperms, comprising the model eudicot A. thaliana and the model monocot O. sativa. In total, 161 NF-Y family genes were identified across these eight species. Among the surveyed species, A. thaliana harbored the highest number of NF-Y genes (36), followed by O. sativa (34) and P. patens (22) (Fig. 6). All eight representative plant species contained entire three NF-Y subfamilies, except for C. reinhardtii, of which no NF-YA subfamily members were detected in this species.
Analyses of evolutionary patterns, including phylogeny, motif conservation, and gene duplication events, were performed for NF-Y family genes across eight representative plant species. Phylogenetic reconstruction of NF-Y genes was performed using FastTree with a maximum-likelihood algorithm based on their protein sequences. Conserved motifs were characterized via the MEME, and gene duplication types were inferred using MCScanX.
A total of 20 specific motifs (motifs 1–20) were estimated using MEME software (Fig. 6; Figs S5 and S6; Table S10). The types and positions of conserved motifs were largely consistent across different NF-Y subfamilies, aligning with their phylogenetic relationships. Among the three subfamilies, NF-YA proteins were the most conserved, containing nine motifs. In contrast, NF-YC proteins were the most diverse, containing up to 13 motifs. Almost all NF-YA subfamily members harbored motifs 2, 4, and 8, with motifs 4 and 8 being exclusively found in this group as distinguishing features. These motifs were annotated as components of the CBF-B/NF-YA subunit (a CCAAT-binding TF), indicating its potential role in the CBF domain. Motifs 1 and 3 occurred solely in both NF-YB and NF-YC subfamilies. Motif 1, annotated as a histone-like TF of the CBF/NFY family and archaeal histone, was consistently identified across all NF-YB and NF-YC proteins, suggesting conserved functional characteristics and potential evolutionary convergence between these two subfamilies (Fig. 6; Figs S5 and S6; Table S10).
We also investigated the evolutionary history of conserved motifs in NF-Y family proteins (Fig. 6; Fig. S6; Table S10). Eight conserved motifs (motifs 1–6, 8, and 13) were detected in at least one member of the NF-YA, NF-YB, or NF-YC subfamilies across all eight representative species, although certain motifs were absent in specific evolutionary lineages. Such as, in NF-YB subfamily, motif 3 was fully conserved in A. thaliana, O. sativa, P. patens, and S. moellendorffii, but was partially lost in P. abies, A. trichopoda, S. muscicola, and C. reinhardtii. Motif 13 was consistently identified in the NF-YA subfamily across all eight species, although it was absent in certain protein sequences, such as AthNF-YA2 and AthNF-YA10 in A. thaliana. Additionally, the remaining 12 motifs were presented in some proteins of certain species, but was completely lost in other species. Notably, two genes (OsaNF-YA8 and AtrNF-YC5) had the highest number of missing motifs, each retaining only one motif, suggesting a potential loss of function during evolution (Fig. 6; Fig. S6; Table S10).
Comparative motif analysis revealed progressive changes in NF-Y subunit composition across plant lineages (Fig. 6; Fig. S6; Table S10). Motifs 7, 9, 11, 15, and 17 exhibited an identical distribution pattern, being entirely absent from all examined charophyte species. Motifs 15, 16, and 17 were entirely missing in the P. patens, while S. moellendorffii and P. abies exhibited a relatively high level of motif depletion, losing eight and five motifs, respectively. In contrast, angiosperms displayed more conserved motif profiles, with only three to four motifs completely lost across these lineages. Remarkably, O. sativa uniquely lacked motif 10 and motif 11, a pattern distinct from other angiosperms, suggesting divergent evolutionary trajectories in monocot NF-Y gene regulation (Fig. 6; Fig. S6; Table S10). Overall, these results indicate that sequence divergence has occurred in genes of this family during evolutionary time, contributing to functional diversification across plant lineages.
Gene expression profiling of the NF-Y family under multiple conditions.
To investigate the expression profiles of NF-Y genes across diverse conditions, we analyzed comprehensive expression data obtained from the Arabidopsis eFP database. A heatmap was generated to illustrate NF-Y gene expression across various treatments (Fig. 7; Fig. S7; Tables S11–S14). A total of 154 samples from 18 groups were analyzed to examine NF-Y gene expression under various abiotic stress conditions. Expression levels were assessed in both shoots and roots at multiple time points (0, 0.25, 0.5, 1, 3, 4, 6, 12, and 24 hours) (Fig. 7a; Table S11). Cluster analysis revealed three distinct expression patterns: genes in Cluster I exhibited consistently higher expression levels across most stress conditions, whereas those in Cluster III showed generally lower expression. However, one NF-YB subfamily gene, AT4G14540, deviated from the Cluster III pattern, maintained consistently higher expression in shoots compared to roots in many stress treatments. To further explore NF-Y gene responses to biotic stress, we analyzed expression data from 70 samples spanning 27 experimental conditions (Fig. 7b; Table S12). Cluster analysis separated the samples into two major groups based on gene expression patterns. Genes in Cluster I generally exhibited elevated expression in response to biotic stress (Fig. 7b; Table S12).
Expression profiles analysis of NF-Y genes in the A. thaliana. (a) Transcript data of NF-Y genes under diverse abiotic stresses was assessed through absolute quantification. (b) Transcript data of NF-Y genes under diverse biotic stresses was assessed through absolute quantification. (c) Transcript data of NF-Y genes were examined across multiple developmental stages and tissue types. All expression values in the heat map are log2-transformed. Samples subjected to abiotic or biotic stress were marked with an asterisk if their gene expression showed a fold change (FC) of ≤0.5 (downregulation) or ≥ 2 (upregulation) compared to the corresponding control groups.
The transcript data expression patterns of NF-Y genes were analyzed during various growth phases and in multiple organs, such as leaves, roots, flowers, seeds, and siliques (Fig. 7c, Table S13). Cluster analysis revealed four major groups: genes in Cluster I exhibited lower expression across most tissues, while those in Cluster II had relatively higher expression. Interestingly, AT2G13570, an NF-YB subfamily gene in Cluster I, showed elevated expression specifically in stamens at flower stage 12 and in mature pollen. Another NF-YB subfamily gene in Cluster I, AT5G47670, displayed high expression levels in siliques during seed development stages 4–8, suggesting a potential role in reproductive development (Fig. 7c, Table S13). We analyzed expression data from 81 samples subjected to different hormone treatments, including ACC, zeatin, IAA, ABA, MJ, GA-3, and BL (Fig. S7, Table S13). Heatmap analysis revealed distinct expression patterns, with NF-Y genes clustering into four groups. Clusters II and III contained ten genes with relatively high expression, while Cluster I comprised eight genes with lower expression levels (Fig. S7, Table S14). Analysis of A. thaliana expression data revealed several prominently expressed core genes, such as AT1G08970, AT3G53340, AT5G47640, and AT4G14540, which may play key roles in stress responses and the regulation of growth and developmental processes. These expression profiles in A. thaliana provide a valuable reference for understanding NF-Y gene function in other plant species and can guide future functional studies.
Identification of upstream and downstream genes and regulatory network construction
The regulatory mechanisms governing the NF-Y gene family, including its upstream regulators, downstream targets, and the extent of functional redundancy and specificity, remain largely unclear. To clarify the regulatory landscape of the A. thaliana NF-Y gene family, we retrieved upstream and downstream genes using the integrated Gene Regulatory Network (iGRN) database (Tables S15, S16) and constructed a regulatory network (Fig. 8a). This network included 3500 gene pairs, comprising 2473 downstream genes regulated by NF-Y genes and 261 upstream regulators of NF-Y genes (Fig. 8b; Tables S15, S16). Our analysis revealed substantial variation in the number of downstream targets associated with individual NF-Y regulators. Among the upstream regulators, AT4G14540 from the NF-YB subfamily was associated with the largest number of upstream regulators (78), while AT1G54160 from the NF-YA subfamily and AT5G50470 from the NF-YC subfamily had the fewest (1). Notably, no upstream regulators were identified for AT5G27910 and AT1G07980, both from the NF-YC subfamily (Tables S15 and S16). For the downstream genes, NF-YB member AT4G14540 displayed the most extensive regulatory influence (796 target genes), contrasting with NF-YA component AT3G05690 which affected only a single target. Interestingly, eight NF-Y genes had no identified downstream targets, including AT5G47640, AT5G47670, and AT2G27470 from the NF-YB subfamily, as well as AT3G48590, AT5G63470, AT5G50490, AT1G07980, and AT5G43250 from the NF-YC subfamily. In addition, 68 genes were found to function both as upstream regulators and downstream targets of NF-Y genes, suggesting a potential role in feedback control pathways (Fig. 8C; Tables S15 and S16).
The interaction landscape of NF-Y genes in A. thaliana, encompassing their upstream regulatory elements and downstream transcriptional targets. (a) The interaction network was visualized and analyzed using Gephi software. (b) The count of upstream regulators and downstream targets associated with each NF-Y gene within the interaction network. (c) Specific and shared NF-Y genes between upstream regulators and downstream targets in the interaction network. (d) Pfam terms uniquely and enriched among upstream regulators, downstream targets, and commonly shared gene sets. (e–g) GO enrichment analysis of the upstream regulators, downstream targets, and the common genes, respectively. Pfam and GO annotation terms exhibiting significant enrichment, defined by P < 0.05 and false discovery rate (FDR) < 0.05 thresholds.
For functional characterization of these genes, we performed Pfam domain, Gene Ontology (GO), and Kyoto Encyclopedia of Genes and Genomes (KEGG) pathway enrichment analyses (Fig. 8d–g; Fig. S8; Tables S17–S19). Pfam domain analysis revealed that upstream regulators were largely enriched in TF families including APETALA2 (AP2), Myb_DNA-binding, and helix–loop–helix. Significant overrepresentation was observed among downstream genes encoding Hydrophob_seed, F-box, and GDSL-like Lipase/Acylhydrolase family proteins, highlighting their crucial involvement in key developmental transitions, such as embryo development and seed germination (Fig. 8d; Table S17).
GO analysis revealed that upstream regulators were mainly implicated in processes, such as transcriptional regulation mediated by DNA templates, TF activity involving DNA binding, and ethylene-responsive signaling. In contrast, downstream targets exhibited significant enrichment in pathways related to lipid degradation, hydrogen peroxide catabolic process, and pectin metabolism, highlighting their functional roles in various metabolic processes. Genes functioning both upstream and downstream were significantly enriched in the DNA binding and nucleus category (Fig. 8e–g; Table S18), which is consistent with the TFs and their functional descriptions. KEGG pathway enrichment analysis further revealed that downstream NF-Y target genes were significantly enriched in pentose and glucuronate interconversions, and tropane, phenylpropanoid, piperidine, and pyridine alkaloid biosynthesis (Fig. S8; Table S19), indicating a potential regulatory role for NF-Y genes in diverse plant metabolic processes, whereas upstream genes exhibited no significant enrichment in any specific pathway. These findings offer significant understanding of NF-Y gene regulatory mechanisms in A. thaliana, revealing complex upstream and downstream regulatory relationships. The presence of feedback-regulated genes and their enrichment in key functional categories demonstrate the critical role of NF-Y genes in plant transcriptional regulation, developmental processes, and stress responses.
Dual-luciferase assay confirmed the AtNF-Y2 interaction of AtERF115
Members within the ethylene response factor (ERF) TF family, part of the AP2/ERF superfamily, are well known for mediating plant growth, development, and defense through modulating ethylene biosynthesis and signaling [53]. A dual-luciferase reporter assay was performed to assess whether At5G47640 (NF-YB2) is regulated by At5G07310 (ERF115). Co-expression of At5G07310-LUC with At5G47640-62SK in Nicotiana benthamiana leaves resulted in significantly stronger LUC luminescence signals compared to the negative control (co-expression of At5G07310-LUC with the empty 62SK vector) (Fig. 9a). No significant differences were observed between the control groups (LUC + 62SK and At5G47640-SK + LUC). This result was further supported by relative LUC/REN activity measurements (Fig. 9b). Together, these findings demonstrate that At5G07310 positively regulates At5G47640 in vivo, suggesting direct regulatory interaction between NF-Y and ERF gene families.
Interaction verification between At5g07310 and At5g47640. (a) Typical imaging results for N. benthamiana leaves following 48-hour infiltration. (b) Relative LUC activity with respect to normalized REN luciferase activity. Values represent the means ± SE from six biological replicates. Statistically significant differences, as evaluated by Duncan’s multiple range test (P < 0.05), are represented by different letters.
Discussion
Research on NF-Y genes in plants has expanded significantly since their discovery [22,54]. These genes have been discovered across a wide range of plant taxa, encompassing both monocotyledonous and dicotyledonous species [12,13,35]. Prior investigations into the phylogenetic relationships of the NF-Y gene have significantly advanced our understanding of its evolutionary development [16]. Due to the sparse inclusion of early-diverging lineages such as basal angiosperms, gymnosperms, and non-vascular plants, significant gaps remain in clarifying the evolutionary trajectory, diversification, and phylogenetic context of the NF-Y gene family across land plants and algae. With advancements in sequencing technology and decreasing costs, vast amounts of high-quality genome data have become available, which offers an excellent opportunity for large-scale plant TF families studies [55].
Previous research has indicated that while animals and fungi each contain a single NF-Y subunit, plants possess multiple subunits [11]. In this study, we analyzed 15 392 NF-Y sequences from 320 plant species, including 20 algae and 300 land plants. Most angiosperms possess a higher number of NF-Y genes compared to other plant lineages, likely due to historical genome duplication events that have contributed to gene family expansion. For example, S. pennellii, a wild tomato species, exhibited the highest proportion of NF-Y family genes, suggesting the NF-Y family may have crucial and special roles in this species. In contrast, Picochlorum sp. SENEW3 contained only a single NF-Y gene. It is well established that all three NF-Y subunits are essential for CCAAT box recognition; NF-YA establishes targeted binding, whereas NF-YB and NF-YC confer complex stability [4,56]. Thus, NF-Y-mediated stable DNA binding necessitates a complete subunit assembly [10]. At NF-YA2 has been identified to directly recognize the NFYBE cis-element (not the CCAAT box), while specific NF-YC members have been shown to associate with HISTONE DEACETYLASE 15 (HDA15) [57,58]. We speculate that this gene loss may lead to functional divergence within this family, potentially resulting in alternative regulatory mechanisms through binding to alternative cis-regulatory elements. Further research will likely uncover novel mechanisms in these lineages. Significantly, charophytes were identified as the earliest NF-Y-containing algae in our study, supporting the hypothesis of this clade as the gene family’s likely birthplace. Based on phylogenetic reconstruction, 15 392 NF-Y genes from 320 species were classified into three distinct subfamilies, highlighting their strong intragroup evolutionary relatedness. From a structural perspective, NF-YA harbors two conserved α-helices, whereas NF-YB and NF-YC both exhibit histone-fold structures. However, their roles in DNA recognition diverge, with NF-YB’s α1 helix playing a pivotal role in binding DNA, and NF-YC contributing minimally [11,16]. Such fundamental structural differentiation likely underlies their distinct evolutionary trajectories, ultimately resulting in the clear phylogenetic separation of these three subfamilies.
The occurrence of genome duplications has been a key driver in plant evolutionary history, contributing significantly to both the diversification and retention of gene families. These events were critical for the growth and adaptability of plants under varying stress conditions [59,60]. Current investigations into plant gene duplication have delineated diverse duplication mechanisms [61]. Research demonstrated that NF-Y genes in P. trichocarpa and S. tuberosum originated from tandem and WGD/segmental events [38,46]. Evidence indicates taxon-dependent drivers underlying the focal family's expansion, with mechanisms differing from basal aquatic flora to derived terrestrial plants. In algae, bryophytes, and pteridophytes, NF-Y gene expansion occurred predominantly via dispersed duplication. Conversely, among basal angiosperms, magnolids, monocots, and eudicots, expansion was primarily attributable to WGD, dispersed duplication, and tandem duplication. WGD or polyploidy was a common feature of plant genomes, resulting in variations in genome size and content [62]. Expansion of TF lineages across seed plants was principally fueled by ancient WGD events, as revealed here [63]. Significantly, gene family expansion in numerous species predominantly relied on dispersed duplication, a mechanism equally pivotal for NF-Y family enlargement [51,64]. This underscores a unique evolutionary trajectory for this plant gene family's expansion.
For deeper evolutionary insights into NF-Y subfamily genes in representative plants, we carried out phylogenetic and conserved motif analyses. Phylogenetic analysis showed that each NF-Y subfamily member retained the conserved domains and motif compositions characteristic of its corresponding subunit, confirming the high conservation of NF-Y in eukaryotes [65]. Previous research suggested that some NF-Y family genes, such as AtNF-YB11/12/13 and AtNF-YC10/11/13, might not belong to the A. thaliana NF-Y family due to lacking the proper structural features [66]. Our phylogenetic tree analysis supports this observation. Certain NF-Y members, especially from A. trichopoda, P. patens, and P. abies, exhibited a more distant evolutionary relationship with the NF-YB and NF-YC clusters, similar to the A. thaliana NF-YB11/12/13 and NF-YC10/11/13 genes. Motif analysis revealed that motif 8 in the NF-YA subfamily is associated with DNA targeting, while motifs 2, 3, and 4 in all subfamilies appear to be involved in interactions with other proteins, suggesting their role in protein–protein interactions within the NF-Y family.
Despite widespread recognition of NF-Y genes as central regulators of plant development and stress responses, the molecular mechanisms underlying their functions remain largely unresolved, and comprehensive genome-scale analyses of their binding landscapes in plants are still scarce. For deeper insights into NF-Y gene functions in plants, we analyzed public transcript profiling data (eFP Browser) in A. thaliana under various conditions. Our findings revealed significant variability in NF-Y gene expression profiles, indicating their diverse functional involvement during developmental processes and stress adaptation. Accumulating evidence indicates that elevated expression of specific NF-Y subunits, including NF-YB2/3 and NF-YC1/3/4/9, plays a regulatory role in the control of flowering time [20,67,68]. In this study, transcript profiling data analysis revealed that numerous NF-Y genes exhibited high expression levels in floral tissues across multiple developmental stages. Notably, a greater proportion of genes exhibited elevated expression levels in response to stress, which may be indicative of functional divergence driven by evolutionary processes. Certain genes exhibited condition-specific expression. For instance, AT5G47670 (AtNF-YB6) exhibited high expression in seed-stage siliques, suggesting involvement in embryo development, whereas AT5G47640 (NF-YB2) displayed elevated expression in shoots under osmotic and salt stress, in agreement with prior reports [15,69,70]. The transcriptome-based evidence lays a solid groundwork for advancing functional characterization of NF-Y genes across diverse plant systems. A regulatory network of NF-Y gene interactions was established via the iGRN database, supplemented with comprehensive enrichment analyses [71]. This network, comprising 3500 gene pairs (2473 downstream and 261 upstream genes), revealed complex regulatory relationships. Upstream NF-Y genes were primarily associated with TF families including AP2, Myb_DNA-binding, zf-Dof, and HLH, implying functions related to multiple stress conditions. These findings align with earlier studies demonstrating A. thaliana NF-YC-mediated flowering via SOC1 induction under drought through ABA-responsive element (ABRE)-binding factor (ABF) interaction [72], and PdNF-YB21’s role in drought tolerance via interaction with PdFUSCA3 (B3 domain) in Populus [73]. Interestingly, genes functioning both upstream and downstream of NF-Ys were co-enriched in AP2 domains, which are associated with ethylene signaling [55]. This suggests functional interaction between the NF-Y and ERF families. Although evidence for such interaction exists in rice [74], studies in A. thaliana remain limited. Our dual-luciferase reporter assay confirmed an in vivo interaction between AtNF-YB2 and AtERF115, validating predictions from the iGRN database and supporting previous findings [71]. AtERF115 is known for its role in wound-induced responses [75]. Thus, the interaction suggests that AtNF-YB2 may contribute to tissue repair and organ regeneration. This function could play a significant role in horticultural plants by enhancing their regenerative capacity, which is crucial for vegetative propagation and stress recovery. In summary, our comprehensive analysis in Arabidopsis provides valuable insights into the evolutionary history, regulatory mechanisms, and functional diversity of NF-Y genes, offering a strong foundation for future studies on their roles in horticultural crops.
Conclusion
This study systematically identified and analyzed NF-Y TFs across 320 plant species, including over 200 horticultural crops and several basal lineages. Comparative genomic and phylogenetic analyses revealed that NF-Y genes originated in streptophyte algae and gradually expanded in bryophytes and pteridophytes through dispersed duplication. In angiosperms, particularly eudicots and monocots, large-scale expansion mainly resulted from whole-genome and tandem duplications. Notably, significant NF-YB and NF-YC expansions occurred in S. lycopersicum, V. vinifera, and C. melo, likely reflecting adaptive evolution related to reproductive development, fruit ripening, and abiotic stress tolerance. Similar diversification in woody crops such as M. domestica and P. persica may support perennial growth and organ differentiation. Overall, this work establishes the broad evolutionary framework of NF-Y TFs across plant lineages, providing essential genomic resources for exploring their lineage-specific functional divergence. The results offer valuable guidance for future functional genomics and molecular breeding in horticultural species, especially in deciphering how NF-Y expansions contribute to developmental plasticity and environmental adaptability.
Materials and methods
Retrieval of sequences
We selected 320 plant species spanning eight major lineages, from algal plants to land plants (bryophytes, pteridophytes, gymnosperms, basal angiosperms, magnoliids, monocots, and eudicots). For each lineage, at least three to four species with relatively well assembled and annotated genomes are chosen as representatives. Amino acid sequences of protein-coding genes and their corresponding annotation files were retrieved from publicly available databases. A detailed species list provided in Table S1.
Identification of NF-Y family members in multiple species
For screening potential NF-Y genes throughout the genome, we implemented a dual-approach strategy using BLAST and Hidden Markov Model (HMM) searches. Firstly, 36 NF-Y protein sequences derived from A. thaliana [12] served as queries for TBLASTP across all species genomes, utilizing TBtools-II.v2.119 [76]. Secondly, the HMM profile corresponding to the NF-YA (PF02045) and NF-YB/C (PF00808) was retrieved from Pfam (http://pfam-legacy.xfam.org) for querying predicted protein sets across all species, employing the HMMER package v3.2.1[77]. Proteins meeting an e-value cut-off of 1e^−4^ were retained as potential candidates. The final candidate set was determined by taking the intersection of hits from both methods, ensuring higher confidence in gene identification. Each candidate protein was examined for conserved NF-Y domains with online tools InterPro (https://www.ebi.ac.uk/interpro/entry/pfam/) [78] and NCBI Batch CD-search (https://www.ncbi.nlm.nih.gov/Structure/bwrpsb/bwrpsb.cgi) [79]. Classification of each candidate sequence into NF-YB and NF-YC subfamilies was performed based on their most significant BLAST hits. Candidates were assigned to a subfamily when at least two of their three most significant BLAST matches belonged to the same subfamily. Finally, we manually verified each classified sequence using DNAMAN software, following the plant-specific domain architecture criteria established by Petroni et al. [16].
Analysis of duplication types in NF-Y genes
MCScanX was used to identify and analyze gene duplication types [52]. BLASTP (e-value 1 × 10^−5^) was used to compare protein sequences. Detection of collinear blocks was performed with default parameters. Using the duplicate_gene_classifier program, the gene duplication pattern was classified as singleton, dispersed, tandem, proximal, or segmental/WGD, based on copy number and genomic distribution.
Phylogenetic reconstruction and motif analysis
Alignment of identified NF-Y protein sequences utilized MUSCLE v3.8.31 at default parameters [80]. FastTree v2.1.11 was used to construct the phylogenetic tree with default parameters [81]. iTOL v6 was employed for visualizing the constructed phylogenetic trees [82]. Gene gain and loss events at divergence nodes were inferred using Notung software [83]. Species trees were generated using NCBI Taxonomy Browser. To evaluate the structural integrity of the candidate NF-Y genes, conserved motifs were detected using the MEME suite (http://meme-suite.org/tools/meme), with: maximum 20 motifs, width 11–50 amino acids [84]. Redundant motifs were merged using Tomtom (P value <1e^−5^), and the final set was curated based on functional annotations.
Analysis of gene expression under different conditions
The transcriptomic data for various stresses and developmental stages were sourced from the A. thaliana eFP Browser microarray datasets. This dataset comprises 18 groups of 154 samples under distinct abiotic stresses, 27 groups of 70 samples under distinct biotic stresses, 47 samples representing different developmental stages, and 10 groups of 81 samples under distinct hormone treatments [85]. These datasets served for NF-Y gene family expression analysis, with all relevant experimental details incorporated in the text boxes of the Arabidopsis eFP browser. Under the ‘absolute’ expression analysis framework, each gene’s expression across sample/condition was normalized by its own highest detected signal intensity, ensuring comparability. Clustered expression data were visualized as a heatmap using TBtools-II.v2.119 [76]. All expression values were log_2_ transformed. In the heatmaps, samples subjected to abiotic or biotic stress were marked with an asterisk if their gene expression showed a fold change (FC) of ≤0.5 (downregulation) or ≥2 (upregulation) compared to the corresponding control groups.
Target gene identification, interaction network construction, and functional annotation
Target genes of the NF-Y gene family in A. thaliana were identified through the iGRN database, applying a stringent confidence score threshold of ≥0.60 [71]. In this study, target genes were divided into downstream and upstream genes. Gephi software (v0.9.2) constructed the interaction network between NF-Y family genes and their target genes, employing the ForceAtlas2 continuous graph layout algorithm (https://gephi.org) [86]. Functional enrichment analyses of SMART, GO, and KEGG were carried out in TBtools-ll.v2.119 [76], based on annotations generated by eggnog-mapper v2.0 [87]. Statistically significant enrichment terms were identified by applying thresholds of P < 0.05 and false discovery rate (FDR) < 0.05 [88].
Reporter gene analysis using dual-luciferase
Given the significant enrichment of AP2 domains among NF-Y upstream regulators, we hypothesize a potential interaction between NF-Y and ERF gene families. To test this hypothesis, we selected AT5G47640 (annotated as AtNF-YB2), one of the highly expressed core NF-Y genes identified above, and its putative upstream regulator AT5G07310 (annotated as AtERF115) based on the iGRN database. Confirmation of the interaction between AtERF115 and AtNF-YB2 was achieved via a dual-luciferase (LUC) transient expression assay. The complete coding sequence (CDS) of AtNF-YB2 was inserted into the pGreenII 0800-LUC vector. This vector harbors a Renilla luciferase (REN) gene under the control of the CaMV 35S promoter. ERF115 coding sequence (CDS) was cloned into the pGreenII 62-SK vector, creating the effector plasmid 62-SK-ERF115. The empty pGreenII 62-SK vector served as the negative control. For reporter gene assays, the promoter sequences of both genes were subcloned into the pGreenII 0800-LUC vector. All plasmid constructs were introduced into Agrobacterium tumefaciens GV3101 (pSoup), after which combinations of effector and reporter vectors were co-delivered into N. benthamiana leaves via agroinfiltration. After 48 hours, LUC activity was visualized (NightSHADE LB 985, Berthold), and dual-luciferase activity was quantified (Dual-Luciferase® Reporter Assay System, Promega, E1910) Six biological replicates were used for each experiment.
Statistical analysis
Data were analyzed using SPSS 21.0 software (IBM Corporation, Armonk, NY, USA). Results are presented in the form of mean ± standard deviation. For multiple comparisons, the Duncan’s method was applied following ANOVA. To evaluate the relationship between NF-Y gene numbers and total protein-coding gene counts in plant genomes, a Spearman correlation analysis was performed. A threshold of P < 0.05 was considered indicative of statistical significance throughout the analysis.
Supplementary Material
Web_Material_uhaf304
The reference list from the paper itself. Each links out to its DOI / PubMed record.
- 1Kaufmann K, Airoldi CA. Master regulatory transcription factors in plant development: a blooming perspective. In: Yamaguchi N, ed. Plant Transcription Factors: Methods and Protocols. Springer New York: New York, NY, 2018,3–2210.1007/978-1-4939-8657-6_130043361 · doi ↗ · pubmed ↗
- 2Franco-Zorrilla JM, López-Vidriero I, Carrasco JL. et al. DNA binding specificities of plant transcription factors and their potential to define target genes. Proc Natl Acad Sci USA. 2014;111:2367–7224477691 10.1073/pnas.1316278111 PMC 3926073 · doi ↗ · pubmed ↗
- 3de Mendoza A, Sebé-Pedrós A, Šestak MS. et al. Transcription factor evolution in eukaryotes and the assembly of the regulatory toolkit in multicellular lineages. P Natl Acad Sci USA. 2013;110:E 4858–6610.1073/pnas.1311818110 PMC 386430024277850 · doi ↗ · pubmed ↗
- 4Sinha S, Kim IS, Sohn KY. et al. Three classes of mutations in the A subunit of the CCAAT-binding factor CBF delineate functional domains involved in the three step assembly of the CBF-DNA complex. Mol Cell Biol. 1996;16:328–378524312 10.1128/mcb.16.1.328PMC 231007 · doi ↗ · pubmed ↗
- 5Bucher P, Trifonov EN. CCAAT box revisited: bidirectionality, location and context. J Biomol Struct Dyn. 1988;5:1231–63271510 10.1080/07391102.1988.10506466 · doi ↗ · pubmed ↗
- 6Myers ZA, Holt BF. NUCLEAR FACTOR-Y: still complex after all these years? Curr Opin Plant Biol. 2018;45:96–10229902675 10.1016/j.pbi.2018.05.015 · doi ↗ · pubmed ↗
- 7Maity SN, Crombrugghe B. Role of the CCAAT binding protein CBF/NF-Y in transcription. Trends Biochem Sci. 1998;23:174–89612081 10.1016/s 0968-0004(98)01201-8 · doi ↗ · pubmed ↗
- 8Romier C, Cocchiarella F, Mantovani R. et al. The NF-YB/NF-YC structure gives insight into DNA binding and transcription regulation by CCAAT factor NF-Y. J Biol Chem. 2003;278:1336–4512401788 10.1074/jbc.M 209635200 · doi ↗ · pubmed ↗