Infrasound Array Dataset of the 2021 Eruptive Paroxysms of Etna Volcano
Luciano Zuccarello, Duccio Gheri, Silvio De Angelis, Araceli Garcia-Yeguas

TL;DR
This paper presents the first open-access dataset of infrasound recordings from Etna Volcano's 2021 eruptions, supporting volcano monitoring and early warning systems.
Contribution
The study introduces the first publicly available infrasound array dataset from Etna Volcano during a period of intense eruptive activity.
Findings
The dataset captured 39 eruptions, detecting all events and tracking their progression.
The infrasound array successfully distinguished activity from multiple vents.
The dataset supports future research and training in volcano monitoring.
Abstract
Infrasound is a valuable tool for volcano monitoring that can offer critical insights into volcanic processes, unrest and eruption. Over the last two decades, studies have shown the benefits of using local infrasound arrays - clusters of sensors near active vents - for real-time detection, tracking, and quantifying eruption intensity. This work introduces the first open-access dataset of infrasound array waveforms recorded at Mt. Etna, Italy, from May to October 2021 during intense eruptive activity. The 6-element array was installed at Monte Conca, near a permanent seismic station operated by the Istituto di Geofisica e Vulcanologia - Osservatorio Etneo, at about 6 km from the South-East Crater. The continuous monitoring captured 39 eruptions, successfully detecting all events, tracking their progression, and distinguishing activity from multiple vents. This manuscript details the…
Genes, proteins, chemicals, diseases, species, mutations and cell lines named across the full text — each resolved to its canonical identifier and authoritative record.
Click any figure to enlarge with its caption.
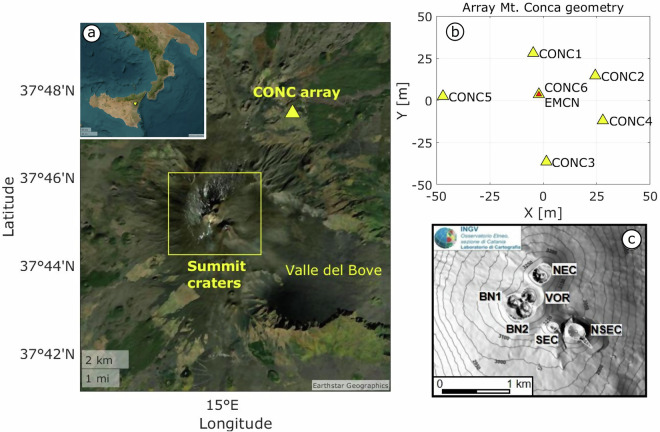 Figure 1
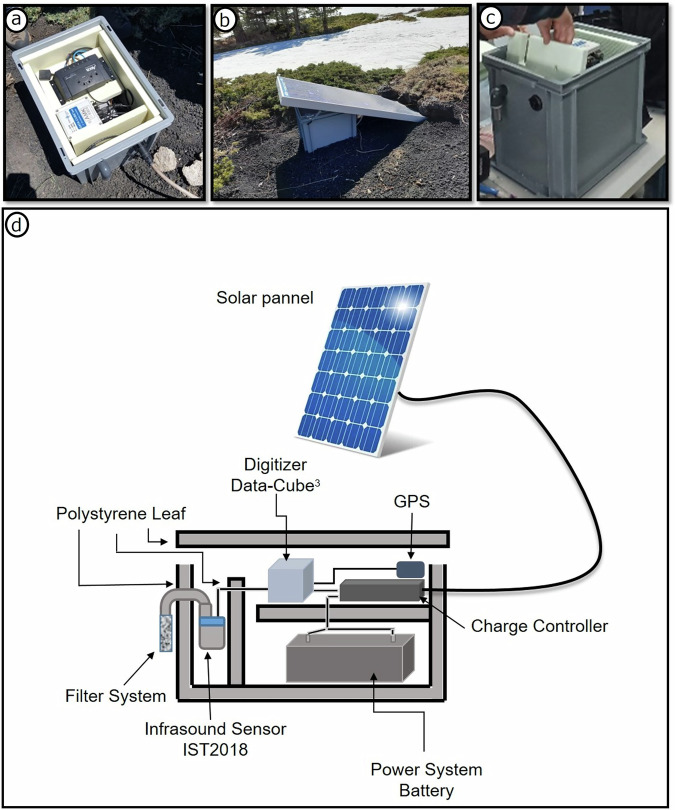 Figure 2
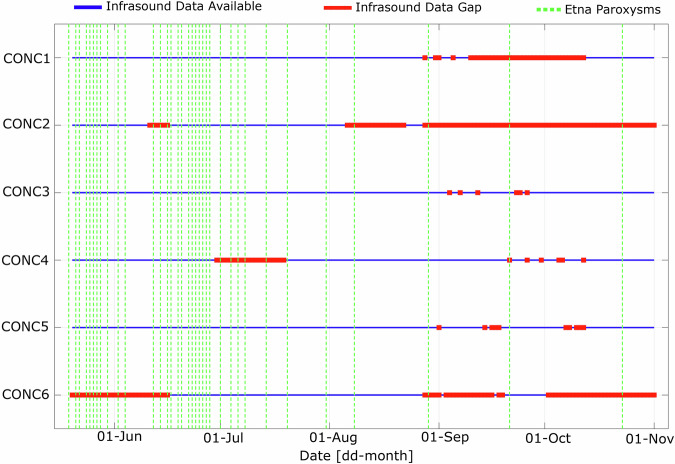 Figure 3
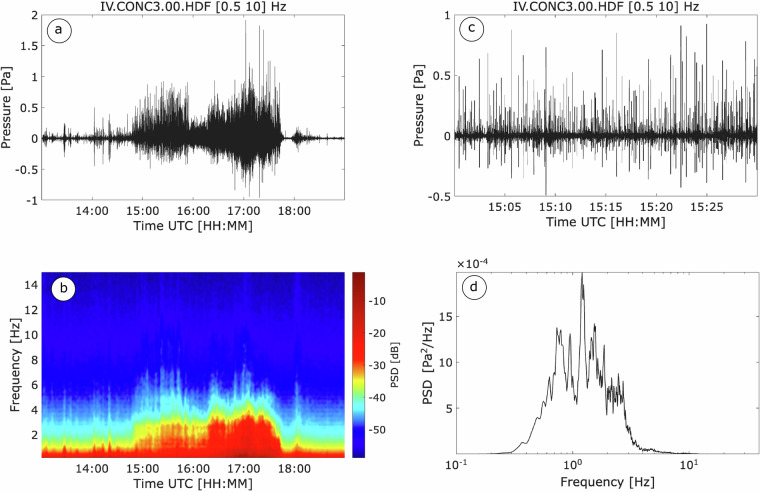 Figure 4
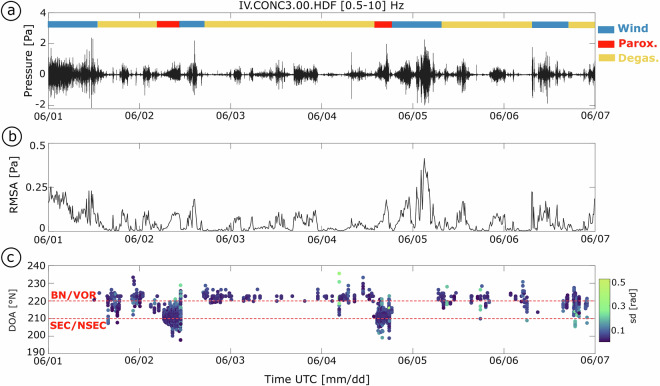 Figure 5
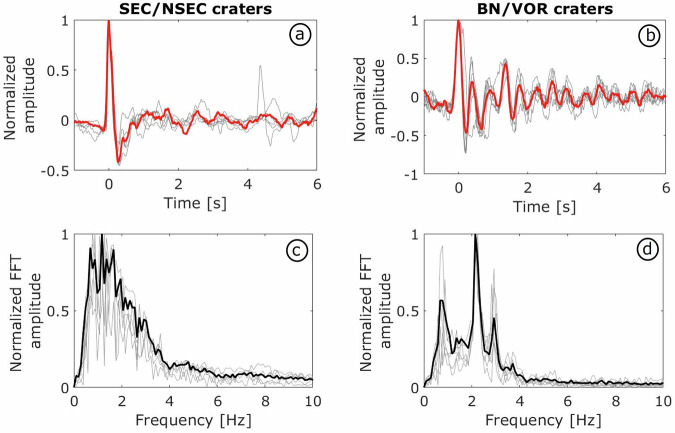 Figure 6
- —Progetto INGV Pianeta Dinamico - Sub-project VT_DYNAMO 2023- code CUP D53J19000170001 - funded by Italian Ministry MIUR (“Fondo Finalizzato al rilancio degli investimenti delle amministrazioni central
- —Progetto INGV Pianeta Dinamico - Sub-project VT_DYNAMO 2023- code CUP D53J19000170001 - funded by Italian Ministry MIUR (“Fondo Finalizzato al rilancio degli investimenti delle amministrazioni central
- —Progetto INGV Pianeta Dinamico - Sub-project VT_DYNAMO 2023- code CUP D53J19000170001 - funded by Italian Ministry MIUR (“Fondo Finalizzato al rilancio degli investimenti delle amministrazioni central
- —Spanish Project PID2022-143083NBI00, LEARNING, funded by MCIN/AEI/10.13039/501100011033 FEDER (EU) Una manera de hacer Europa.
Peer Reviews
No public reviews on file for this paper yet. If you reviewed it on a platform where reviews are public (OpenReview, ICLR, NeurIPS, ICML), you can paste yours below so the community can read it here.
Videos
No videos yet. Explain this paper in a talk, walkthrough, or lecture? Add one.
Taxonomy
TopicsSeismic Waves and Analysis · Seismology and Earthquake Studies · earthquake and tectonic studies
Background & Summary
Mt. Etna is one of the world’s most active volcanoes, characterized by frequent and intense eruptions over the past two decades, including extensive lava flows and significant ash emissions. The Istituto Nazionale di Geofisica e Vulcanologia - Osservatorio Etneo (INGV-OE) continuously monitors Etna with a real-time instrument network including seismic, acoustic, deformation, gas, and other remote sensing data. Mt. Etna’s consistent activity offers an ideal environment for assessing the performances of infrasound arrays for eruption detection and characterization, as well as for refining models that relate acoustic emissions to volcanic ash dispersal into the atmosphere (e.g., ref. ^1^). At Etna, volcanic infrasound - i.e., low-frequency acoustic waves typically in the 1-20 Hz range - is mostly generated by surface degassing and discrete explosions from the multiple summit vents. These signals can be recorded over a wide range of distances, from local (<15 km) to regional-scale (15–250 km)^2–4^. At local distances, infrasound sensors are configured as either arrays of microphones or distributed networks, with arrays offering greater noise suppression and source discrimination capabilities. Over the past two decades, the increased amount of infrasound data collected at active volcanoes has significantly enhanced our understanding of eruption dynamics, including their onset, progression, style, intensity, and associated hazards. Local^5^, but also global (>250 km)^4,6^ infrasound recordings have proven especially useful in developing real-time eruption detection methods. However, despite these advances, further progress is hindered by the limited availability of high-quality, and publicly accessible, datasets. Here, we present the first open-access infrasound array dataset collected during eruptive activity at Etna within the framework of a research collaboration between Istituto Nazionale di Geofisica e Vulcanologia - Sezione Pisa (INGV-PI), Istituto Nazionale di Geofisica e Vulcanologia - Osservatorio Etneo (INGV-OE) and the University of Liverpool (UK). A six-element infrasound array was installed at Monte Conca (CONC), near the permanent INGV-OE seismic station EMCN (Fig. 1), and operated continuously for 12 months, during a period of elevated eruptive activity. This manuscript introduces the infrasound dataset, including details on the instruments, deployment strategy, and data recovery statistics. We also present a summary of the most significant volcanic activity observed during the deployment period and provide examples of associated infrasound signals to facilitate future use of the dataset by other researchers. Finally, we show how infrasound array processing allows detection and discrimination of eruptive activity across the multiple summit vents at Etna. This dataset will provide valuable support to the development of fast and efficient real-time workflows for infrasound array processing and analysis, including uncertainty estimates for acoustic source locations, thereby promoting further integration of infrasonic array technology into volcano monitoring programs, and early warning protocols at Etna and other similar volcanoes worldwide.Fig. 1a) Map of Mt. Etna showing the location of the CONC infrasound array. The inset in the upper left corner indicates the position of Mt. Etna, Italy. (b) Configuration of the infrasound array; each yellow triangles mark the position of an individual infrasound sensor, while the red triangle represents the central node of the array, corresponding to the ECMP seismic station of the INGV network. (c) Close-up view of Mt. Etna’s summit craters.
The 2021 eruptive activity at Mt. Etna
Etna typically exhibits persistent degassing from its summit craters and frequent eruptive activity from both summit and flank vents (e.g., refs. ^7,8^, and references therein). In recent years, eruptive activity at Etna has occurred from all its summit craters, sometimes simultaneously active. Five craters are located within the summit area (Fig. 1c): the Southeast Crater (SEC), the New Southeast Crater (NSEC), Bocca Nuova (BN), Voragine (VOR), and the Northeast Crater (NEC). A new phase of eruptive activity began in November 2020, marked by discrete Strombolian explosions accompanied by intermittent ash emissions and continuous degassing across the summit craters^8^. The activity escalated on 13 December 2020, when a sequence of more than 60 paroxysmal events - violent and sustained lava fountaining phenomena with ash column formation (e.g., ref. ^9^) - began continuing throughout 2021^10^. Each paroxysms typically began with discrete Strombolian activity - single burst-like volcanic eruptions with rhythmic and mild explosions (e.g., ref. ^11^) - evolving into sustained lava fountaining accompanied by ash emissions. Some eruptive plumes reached elevations of up to 10 km above the vent, with ash transported tens of kilometers downwind, impacting nearby towns and the Catania airport to the East. Paroxysms typically ended with a gradual waning of lava fountaining and transition to passive degassing, occasionally accompanied by lava effusion^12^. Our deployment period coincided with this eruptive activity; the infrasound array recorded 39 paroxysmal events from SEC/NSEC (see Table 1) as well as minor degassing and explosive activity from BN.Table 1. Summary of Etna paroxysmal activity between May and October 2021 according to INGV Bollettini 2021 and ref. ^10^.Number of ParoxysmDate of the Paroxysmal eventStart activity (hh:mm) UTCEnd of activity (hh:mm) UTC2019 May01:1505:152121 May01:0502:552222 May20:4022:402324-25 May20:25 (24/05)03:00 (25/05)2425 May18:2019:352526 May01:5503:502626 May10:3511:302727 Mayno datano data2828 May06:4707:252928 May15:4016:153028 May20:0720:503130 May04:4005:453202 June08:3010:453304 June16:0517:303412 June13:5023:153514 June21:3522:453616 June11:5012:503717-18 June20:20 (17/06)00:10 (18/06)3819 June18:3020:203920-21 June22:15 (20/06)00:15 (21/06)4022 June02:5504:154123 June02:1503:204223 June18:0019:004324 June09:5510:454425 June01:0001:504525 June18:2519:154626 June15:5017:004727 June08:2509:484828 June15:0015:304901-02 July22:50 (01/07)00:50 (02/07)5004 July15:2517:005106-07 July22:30 (06-07)00:20 (07/07)5208 July20:4522:505314 July10:4012:305420 July05:5008:485531 July19:1523:305608-09 August23:10 (08/08)04:00 (09/08)5729 August15:4520:405821 September07:5509:305923 October08:4510:20Note that the numbering of paroxysms begins at 20, as those occurring prior to the installation date of our array have been excluded from the analysis.
Methods
Over the last three decades, infrasound has been increasingly adopted to investigate eruption dynamics at active volcanoes, particularly at open-vent systems such as Mt. Etna (e.g., refs. ^1,6,13–19^). A permanent infrasound network of four stations was first installed at Etna in 2005, alongside the existing seismic network. Over the past 10 years, the number of stations has increased to 10, some co-located with permanent INGV seismic stations. However, the use of infrasound arrays and beamforming techniques has been more limited at Mt. Etna, with the exception of work by^5^. Typically, infrasound arrays have the ability to enhance signal detectability by increasing the signal-to-noise ratio (e.g., refs. ^1,14,20–24^).
The CONC (Monte Conca) infrasound array was the first of its kind deployed by INGV to monitor Mt. Etna’s activity. This deployment aimed primarily at conducting long-term testing of the technology before considering its integration into INGV-OE’s monitoring operations. A previous short-term array deployment (~2 months) was also conducted by the same team of researchers from the University of Liverpool (UK) and INGV^25^.
The five-element CONC array was installed on May 19, 2021, by a team of technicians and researchers from INGV-PI, INGV-OE, and the University of Liverpool (UK). On July 16, the final installation of a sixth sensor (CONC6) completed the planned six-element configuration, as shown in Fig. 1.
The array featured a central element co-located with the EMCN seismic station operated by INGV-OE, surrounded by five sensors with an aperture of approximately 70 meters (Fig. 1b). Table 2 details the coordinates of all elements within the CONC array. The array includes six IST2018 broadband infrasound sensors, with sensitivity of 20 mV/Pa, flat frequency response between 0.06 and 40 Hz, and a full-scale pressure range of +/−240 Pa; these sensors are developed by ISTerre (Universite Savoie Mont Blanc, France) and specifically designed for volcano monitoring. The sensors feature a compact, lightweight design (26 × 45 × 80 mm; 100 g) and low power consumption (42 mW), enabling easy deployment with minimal infrastructure. The IST2018 employs a cost-effective MEMS-based differential pressure transducer, offering reliable performance for field applications^26^. All data were recorded at 100 Hz using DIGOS DATA-CUBE^3^ digital recorders set to gain 1 (±4.096 V). At this gain the recorders offer an effective resolution of 22.4 bits, a dynamic range of 125 dB at 100 Hz, and GPS timing accuracy of <0.01 ms, ensuring high-precision during signal acquisition.Table 2. Coordinates of the infrasonic sensors deployed at Monte Conca array site.Array Monte ConcaLatitude (^°^)Longitude (^°^)Altitude (m)CONC137.7913115.033551869CONC237.7911915.033881864CONC337.7907315.033621883CONC437.7909515.033921875CONC537.7910815.033071876CONC637.7910915.033581865
The primary challenge of the deployment was ensuring continuous operation during the winter season, when Etna is covered by snow. A custom housing system was developed comprising a waterproof, thermally insulated, plastic box containing the sensor, digitizer, and a 12V/52Ah battery. An 80 W solar panel, mounted on the box and secured with steel springs to the ground, maintained sufficient battery voltage throughout the deployment. Each sensor was fitted with a mechanical wind noise filter protected by a stainless steel mesh guard; each box was lined with polyurethane foam (see Fig. 2). The design ensured thermal insulation, power stability, wind suppression and low visual impact, while supporting autonomous operation throughout the period of installation.Fig. 2(a)–(c) Photos of the custom housing used for instrument deployment of the CONC array. (d) Sketch of the instrumental design.
Data Records
The complete dataset, including raw waveforms and results of array processing, is available from FigShare repository ref. ^27^. Figure 3 illustrates data recovery statistics for the array during the period of deployment. The array operated continuously between May 19, 2021 and April 2, 2022, despite snow accumulation from mid-January to March. Snow did not significantly impact the power supply, allowing the system to mostly remain functional. Data recovery was generally high across the array, with the exception of sensor CONC2, which experienced data logger malfunctioning. Minor data gaps correspond to routine maintenance periods, including scheduled data downloads.Fig. 3. Data recovery statistics for the CONC infrasound array between May and November 2021, showing data availability for each of the six sensors. Blue lines indicate periods of available data; red segments mark data gaps. The extended gap for CONC2 reflects datalogger malfunctioning. Green-dashed lines indicate the time of paroxysmal activity at Mt. Etna.
Technical Validation
Figure 4a illustrates a representative filtered (0.5–10 Hz) waveform recorded at the CONC3 element of the array; these data illustrate six hours of infrasound on 4 June 2021 during paroxysmal event No. 33 (see Table 1).Fig. 4(a) Filtered infrasound waveform of the June 4 paroxysm at Mount Etna (Event No. 33, see Table 1), and (b) the corresponding spectrogram, showing energy concentration during the paroxysmal phase associated with Strombolian explosions and lava fountaining from the SEC/NSEC crater. (c) Sequence of Strombolian explosions during the paroxysm. (d) Spectra of all recorded explosions.
The acoustic signal is characterized by continuous infrasonic tremor with varying properties, which can be classified into two main types: (i) tremor, likely associated to background continuous degassing activity, marked by generally low-amplitude, continuous waveforms not directly associated with eruptive phases (Fig. 4a,b, between 13:00 and 15:00 UTC); and (ii) pre-eruptive and syn-eruptive tremor, associated with paroxysmal activity (between 15:00 and 18:00 UTC). The latter typically consists of clusters of discrete explosion signals that progressively overlap until merging into a nearly continuous, high-amplitude waveform (see detail in Fig. 4c) during the most intense phase of lava fountaining.
It is possible to discriminate between the two phases of paroxysmal activity -Strombolian explosions and lava fountaining - based on their distinct spectral fingerprint. Discrete Strombolian explosions exhibit a clear spectral peak at approximately 1.5 Hz (Fig. 4d), while the lava fountain infrasound observed at 16:30 UTC displays a broader frequency content (see Fig. 4b).
Figure 5 shows the value of array processing in isolating coherent volcanic infrasound and distinguishing activity at different summit craters during the first week of June 2021, which includes paroxysmal event No. 32 (see Table 1). Based solely on the filtered infrasound waveform and RMSA recorded continuously by the CONC array (Fig. 5a,b), the identification of signals associated with volcanic activity is challenging. The RMSA, computed over 10-minute windows with 90% overlap, exhibits peaks not only during eruptive phases but also during periods of elevated noise, particularly wind, making its interpretation ambiguous. Array processing allows detection and characterization of coherent infrasound signals across all array sensors, suppressing incoherent background noise such as from wind^28^. At Mt. Etna, where noise levels fluctuate significantly, arrays equipped with wind noise reduction systems (WNRs) can be critical for reliable monitoring (see Fig. 2). Our analysis adopts beamforming methods routinely used in infrasound studies (e.g., refs. ^29–31^), using time-domain, multi-channel cross-correlation over sliding time windows. In this study, we used 10-second processing windows with 90% overlap (i.e., a 1-second shift), and filtered the data between 1 and 10 Hz. Within each window, we computed cross-correlations between sensor pairs and quantified signal coherence based on peak correlation values. When a coherent signal was detected, we extracted key wave parameters: pressure amplitude, direction of arrivals (DOA), and apparent velocity. The pressure amplitude is defined as the peak value within the window, while the DOA and apparent velocity are derived from time delays between sensors^32^. The DOA, expressed as the azimuthal angle clockwise from true North, represents the horizontal direction of wave propagation.Fig. 5. Example of infrasonic data recorded by the CONC array between June 1 and 6, 2021, encompassing paroxysms No. 32 and 33 (see Table 1). (a) Bandpass-filtered waveforms (0.5-10 Hz frequency band) showing both low-amplitude, non-eruptive tremor and high-amplitude, paroxysmal signals. (b) Root Mean Square Amplitude (RMSA), computed over 10-minute windows with 90% overlap. (c) DOA results with two horizontal dashed lines indicating the mean direction of arrivals (DOA) for SEC/NSEC (lower line) and BN/VOR (upper line). Only detections with high coherence (>80%) are shown, color-coded by standard deviation of the DOA estimate.
Figure 5c shows DOA estimates for detections with high coherence (>80%), color-coded by their standard deviation. The standard deviation of the DOA estimates was calculated using the circular standard deviation (circ_std in MATLAB), which accounts for the periodic nature of angular data. These results reveal consistent clusters of coherent detections from spatially distinct source regions. Two dominant DOA clusters emerge, corresponding to infrasound emissions from the SEC-NSEC during paroxysmal phases and from BN/VOR during periods of degassing. During the paroxysmal event, DOA estimates consistently point toward the SEC/NSEC, confirming its role as the dominant source. Outside these events, detections shift toward stable azimuths associated with BN/VOR, which were active during that period. These stable directional patterns demonstrate the array’s ability to resolve overlapping volcanic signals over time. Notably, during high-noise periods, no detections are observed, as the signals are incoherent and therefore not attributable to volcanic activity.
By exploiting the detections, we are able to discriminate and extract coherent signals associated with explosive activity from different volcanic sources during the analyzed period. Figure 6 presents examples of infrasound waveforms and their spectral content from both the SEC/NSEC and the BN/VOR active craters. The SEC/NSEC waveforms (Fig. 6a) are characterized by an impulsive onset followed by a rapid amplitude decay, typical of explosive bursts of pressurized gas^33^. In contrast, the BN/VOR waveforms (Fig. 6b) exhibit sharp pulse followed by more oscillatory and longer-lasting codas. The SEC/NSEC signals display braod spectral energy concentrated between 1 and 2 Hz, whereas the BN/VOR events show distinct spectral peaks near 1, 2, and 3 Hz, indicative of acoustic resonance phenomena influenced by vent and crater morphology^34^.Fig. 6. Waveform and spectral characteristics of infrasonic signals from South-East crater and Bocca Nuova/ Voragine craters. (a–c). Representative normalized infrasonic waveforms from seven explosive events at the SE and BN/VOR craters are shown. Individual waveforms are depicted in light grey, while the ensemble average is indicated in red. (b–d) Mean power spectral density (PSD) of the SE/NSEC and BN/VOR crater events (black lines), averaged over all waveforms (light grey lines).
Our experiment demonstrates the feasibility and robustness of infrasound array deployments at Mt. Etna for monitoring volcanic activity. The successful installation and operation of a six-element array at approximately 1800 m above sea level (a.s.l.) enabled the continuous acquisition of high-quality infrasound data over a year-long period, including paroxysmal activity phases. The data collected provide a unique record of both eruptive and passive degassing activity, offering new opportunities to investigate infrasound signal characteristics and their relation to different eruptive processes. Furthermore, the experiment served as a valuable testing ground for infrasound array processing workflows, confirming their potential to support real-time monitoring and source localization. This work represents a critical step toward enhancing acoustic surveillance capabilities at Etna and at volcanoes worldwide, and improving eruption early warning systems.
The reference list from the paper itself. Each links out to its DOI / PubMed record.
- 1Gheri, D. et al. Monitoring of Indonesian volcanoes with the IS 06 infrasound array. J. Volcanol. Geotherm. Res. 107753, 10.1016/j.jvolgeores.2023.107753 (2023)
- 2Parfitt, E., Wilson, L. & Kerber, L.Fundamentals of Physical Volcanology. (John Wiley & Sons, 2025).
- 3Taddeucci, J., Edmonds, M., Houghton, B., James, M. R. & Vergniolle, S. Hawaiian and Strombolian eruptions. In The Encyclopedia of Volcanoes (eds. Sigurdsson, H. et al.) 485-503, 10.1016/B 978-0-12-385938-9.00027-4 (Elsevier, 2015).
- 4Fee, D. et al. Infrasonic harmonic tremor and degassing bursts from Halema uma u crater, Kīlauea volcano, Hawaii. J. Geophys. Res. Solid Earth 115B 11, 10.1029/2010 JB 007642 (2010).
- 5Ripepe, M., Marchetti, E. & Ulivieri, G. Infrasonic monitoring at Stromboli volcano during the 2003 effusive eruption: Insights on the explosive and degassing process of an open conduit system. J. Geophys. Res. Solid Earth 112, B 9, 10.1029/2006 JB 004613 (2007).
- 6Cannata, A., Montalto, P., Privitera, E. & Russo, G. Characterization and location of infrasonic sources in active volcanoes: Mount Etna, September-November 2007. J. Geophys. Res. Solid Earth 114, B 8, 10.1029/2008 JB 006007 (2009).
- 7Marchetti, E., Ripepe, M., Ulivieri, G., Caffo, S. & Privitera, E. Infrasonic evidences for branched conduit dynamics at Mt. Etna volcano, Italy. Geophys. Res. Lett. 36, 19, 10.1029/2009 GL 040070 (2009).
- 8Christie, D. & Campus, P. The IMS infrasound network: Design and establishment of infrasound stations. In Infrasound Monitoring for Atmospheric Studies 29–75 (Springer, 2010).