Impaired graft survival in kidney transplants from expanded criteria donors with HLA-DR mismatch
Uwe Scheuermann, Philipp Rhode, Claudia Lehmann, Jan Kowald, Sophie Seiffer, Fabian Haak, Daniel Seehofer, Sebastian Murad Rabe, Hans-Michael Tautenhahn

TL;DR
This study shows that HLA-DR mismatches in kidney transplants from lower-quality donors significantly reduce graft survival and increase rejection risk.
Contribution
The study identifies HLA-DR mismatch as an independent predictor of graft rejection and reduced survival in expanded criteria donor kidney transplants.
Findings
ECD-DR+ kidney transplants had significantly lower rejection-free graft survival (P = 0.005).
HLA-DR mismatch was an independent predictor of graft rejection and reduced survival in ECD transplants.
Graft survival was shorter in ECD-DR+ transplants compared to ECD-DR- transplants (15.1 vs. 10.7 years).
Abstract
Human leukocyte antigen (HLA)-DR mismatches are known to increase the risk of graft rejection following kidney transplantation (KT). Especially in KT using grafts of lower quality from expanded criteria donors (ECD), the immune response plays a critical role. Therefore, the aim of this study was to investigate the impact of HLA-DR mismatches on both short- and long-term outcomes in primary ECD KT. 537 KT recipients were stratified into four groups based on their HLA-DR mismatch status [absent (−) or present (+)] and donor type [standard criteria donor (SCD) or ECD]: (1) SCD-DR-(N = 126), (2) SCD-DR+ (N = 167), (3) ECD-DR- (N = 60) and (4) ECD-DR+ (N = 184). Clinicopathological characteristics, transplant outcomes and survival were evaluated across the groups. Rejection-free graft survival was significantly decreased in recipients of ECD-DR + KT (P = 0.005). In comparison with ECD-DR-…
Genes, proteins, chemicals, diseases, species, mutations and cell lines named across the full text — each resolved to its canonical identifier and authoritative record.
Click any figure to enlarge with its caption.
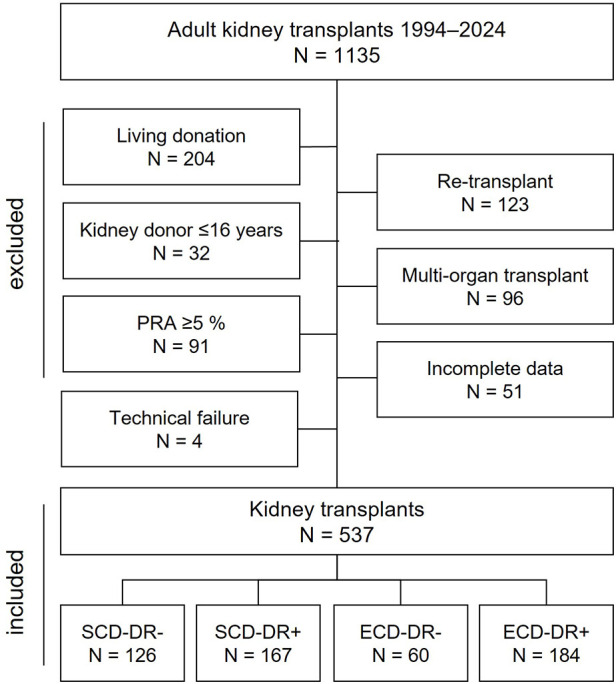 Figure 1
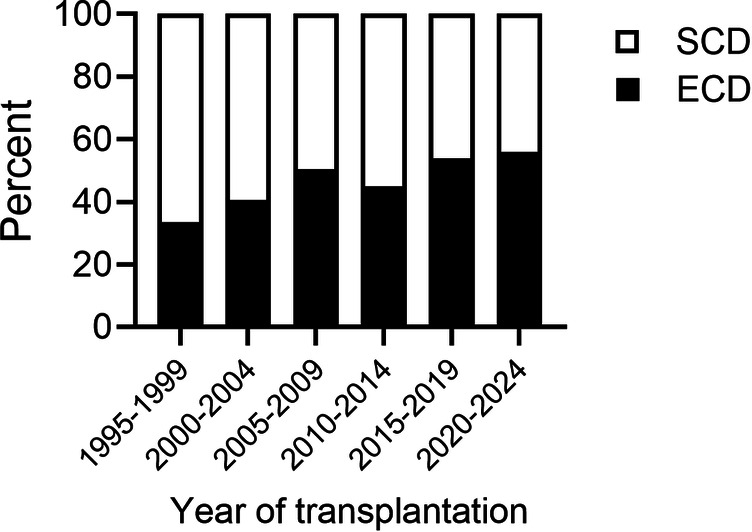 Figure 2
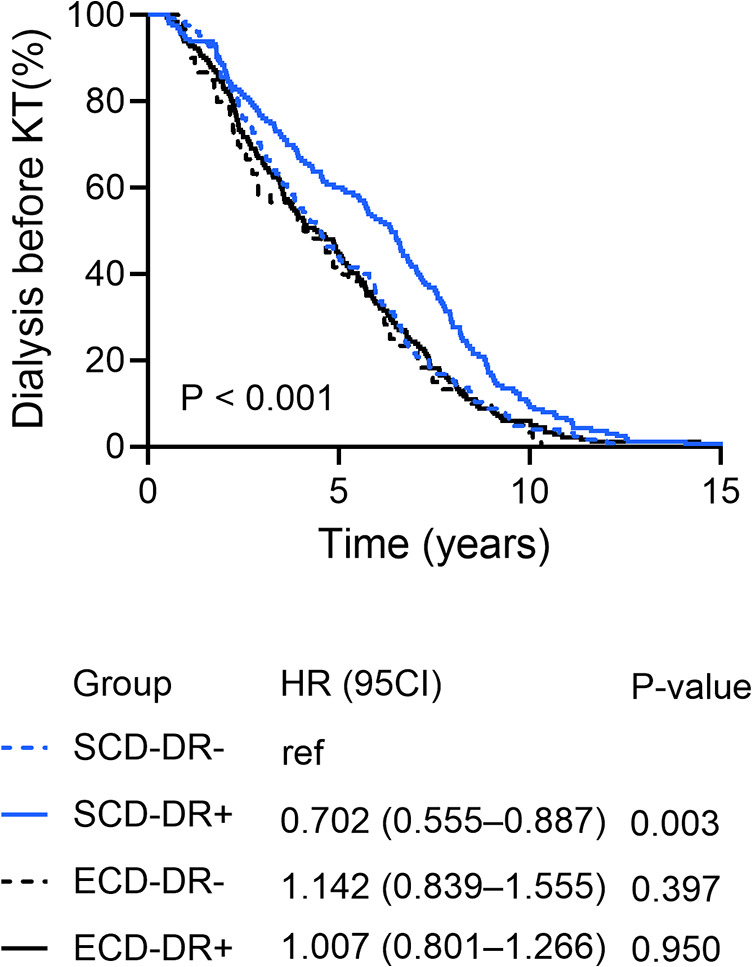 Figure 3
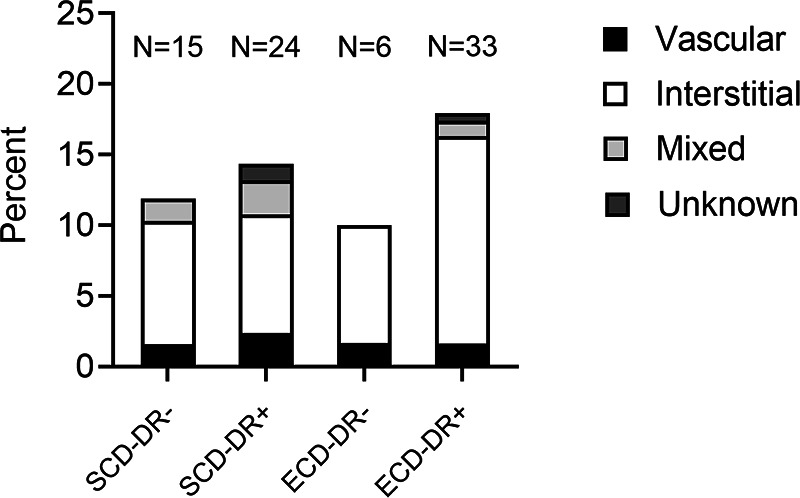 Figure 4
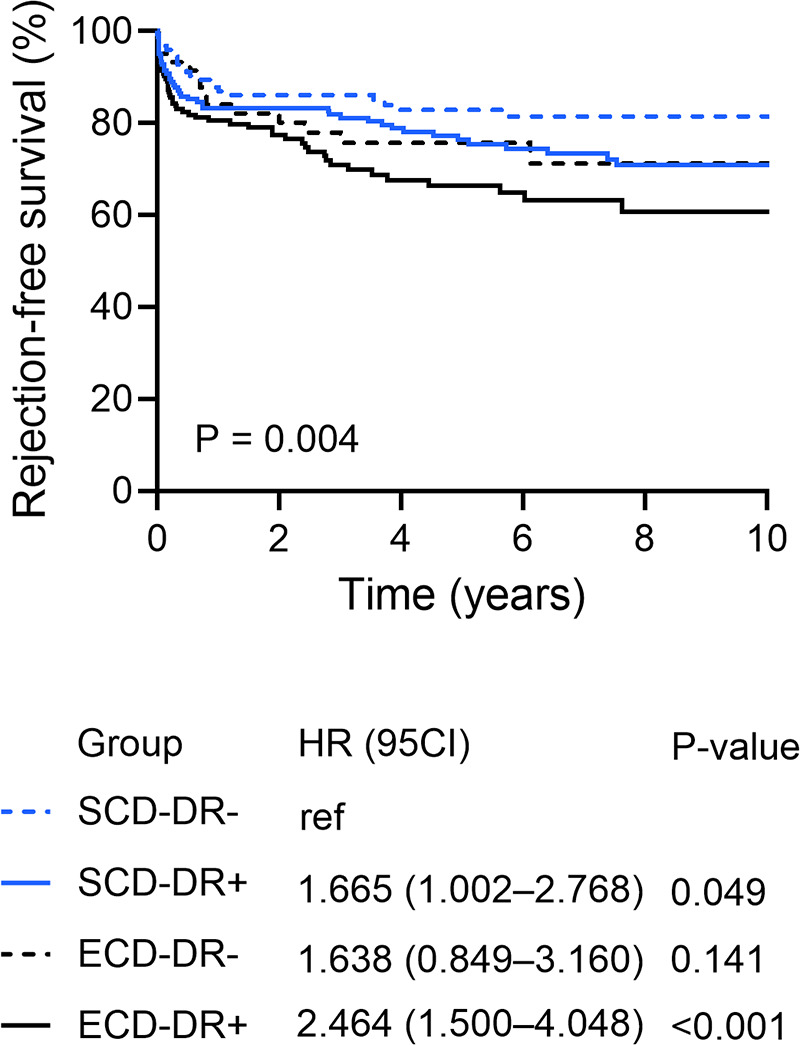 Figure 5
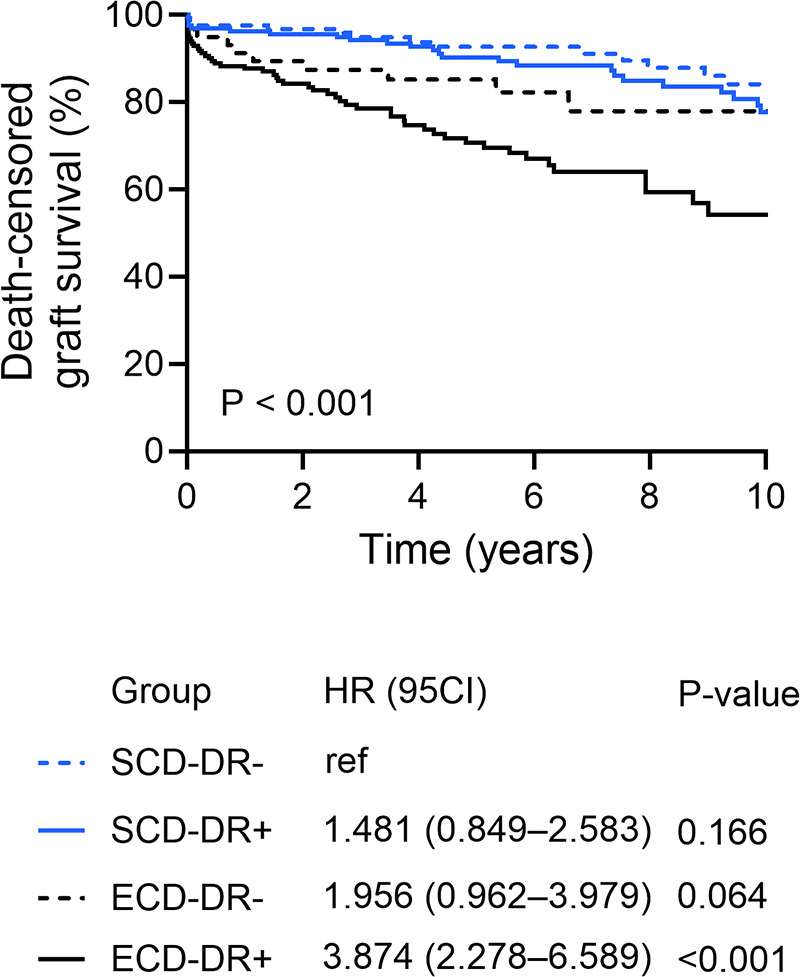 Figure 6
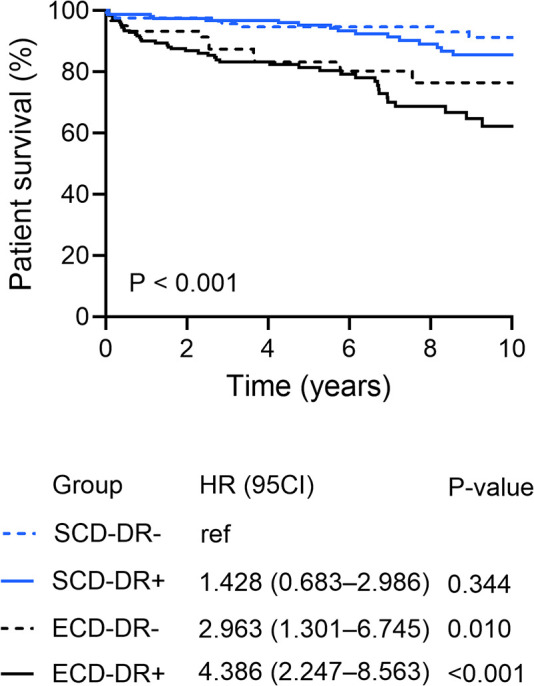 Figure 7
| Variables | SCD | ECD | |||
|---|---|---|---|---|---|
| HLA-DR- ( | HLA-DR+ ( | HLA-DR- ( | HLA-DR+ ( | ||
| Donor | |||||
| Age, years | 40 ± 12.5 | 41 ± 12.2 | 64 ± 6.8 | 67 ± 7.6 | <0.001 |
| Gender, male (%) | 81 (64.3) | 98 (58.7) | 25 (41.7) | 95 (51.6) | 0.016 |
| BMI, kg/m2 | 25.3 ± 4.9 | 24.6 ± 3.7 | 26.0 ± 3.5 | 26.2 ± 4.0 | 0.001 |
| Cause of death (%) | |||||
| CVA | 46 (36.5) | 65 (38.9) | 39 (65.0) | 117 (63.6) | <0.001 |
| Hypoxia | 12 (9.5) | 21 (12.6) | 5 (15.0) | 12 (6.5) | |
| Trauma | 39 (31.0) | 51 (30.5) | 9 (20.0) | 22 (12.0) | |
| Infection | 3 (2.4) | 2 (1.2) | 0 | 1 (0.5) | |
| Others | 26 (20.6) | 26 (15.6) | 7 (11.7) | 32 (17.4) | |
| Diabetes mellitus (%) | 5 (4.0) | 10 (6.0) | 7 (11.7) | 26 (14.1) | 0.007 |
| Hypertension (%) | 13 (10.3) | 22 (13.2) | 33 (55.0) | 122 (66.3) | <0.001 |
| Recipient | |||||
| Age, years | 49 ± 11.1 | 46 ± 12.8 | 56 ± 14.8 | 61 ± 11.1 | <0.001 |
| Gender, male (%) | 77 (61.1) | 101 (60.5) | 37 (61.7) | 125 (67.9) | 0.457 |
| BMI, kg/m2 | 25.2 ± 3.9 | 24.8 ± 4.0 | 25.2 ± 4.5 | 26.1 ± 4.2 | 0.040 |
| Dialysis duration, months | 59.2 ± 33.0 | 72.1 ± 38.7 | 54.6 ± 32.8 | 58.4 ± 36.7 | <0.001 |
| Cause of ESRD (%) | |||||
| Glomerulonephritis | 50 (39.7) | 75 (44.9) | 16 (26.7) | 62 (33.7) | 0.046 |
| Cystic kidney disease | 23 (18.3) | 23 (13.8) | 15 (25.0) | 38 (20.7) | |
| Interstitial nephritis | 16 (12.7) | 19 (11.4) | 4 (6.7) | 14 (7.6) | |
| Diabetes mellitus | 7 (5.6) | 6 (3.6) | 1 (1.7) | 15 (8.2) | |
| Others | 30 (23.8) | 44 (26.3) | 24 (40.0) | 55 (29.9) | |
| Diabetes mellitus (%) | 15 (11.9) | 13 (7.8) | 5 (8.3) | 41 (22.3) | <0.001 |
| Hypertension (%) | 116 (92.1) | 147 (88.0) | 55 (91.7) | 171 (92.9) | 0.209 |
| Coronary disease (%) | 18 (14.3) | 20 (12.0) | 12 (20.0) | 41 (22.3) | 0.053 |
| PVD (%) | 5 (4.0) | 16 (9.6) | 3 (5.0) | 17 (9.2) | 0.207 |
| Allocation | |||||
| Gender mismatch | 62 (49.2) | 79 (47.3) | 34 (56.7) | 96 (52.2) | 0.597 |
| CMV D + R- (%) | 28 (22.2) | 45 (26.9) | 15 (25.0) | 37 (20.1) | 0.495 |
| No. HLA-mismatches (%) | |||||
| 0 | 59 (46.8) | 0 | 18 (30.0) | 0 | <0.001 |
| 1–2 | 41 (32.5) | 36 (21.6) | 22 (36.7) | 19 (10.3) | |
| 3–4 | 26 (20.6) | 112 (67.1) | 20 (33.3) | 101 (54.9) | |
| 5–6 | 0 | 19 (11.4) | 0 | 64 (34.8) | |
| HLA-A mismatch | 53 (42.1) | 127 (76.0) | 39 (65.0) | 140 (76.1) | <0.001 |
| HLA-B mismatch | 59 (46.8) | 152 (91.0) | 38 (63.3) | 173 (94.0) | <0.001 |
| HLA-DR mismatch | 0 | 167 (100) | 0 | 184 (100) | <0.001 |
| Transplant | |||||
| Era (%) | |||||
| 1993–2004 | 52 (41.3) | 73 (43.7) | 24 (40.0) | 43 (23.4) | <0.001 |
| 2005–2014 | 47 (37.2) | 64 (38.3) | 30 (50.0) | 71 (38.6) | |
| 2015–2024 | 27 (21.4) | 30 (18.0) | 6 (10.0) | 70 (38.0) | |
| PRA positive, (%, range) | 3 (2.4, 2–3) | 5 (3.0, 2–3) | 1 (1.7, 3) | 9 (4.9, 1–4) | 0.512 |
| CIT, hours | 15.4 ± 6.0 | 13.3 ± 5.5 | 12.0 ± 5.5 | 11.3 ± 5.0 | <0.001 |
| WIT, minutes | 44 ± 12.5 | 43 ± 16.2 | 45 ± 17.5 | 44 ± 18.2 | 0.951 |
| Duration of surgery, minutes | 185 ± 47.7 | 175 ± 45.2 | 188 ± 43.7 | 193 ± 58.3 | 0.015 |
| Induction therapy, ATG/IL2-RA (%) | 4 (3.2)/ 32 (25.4) | 7 (4.2)/ 48 (28.7) | 1 (1.7)/ 22 (36.7) | 5 (2.7)/ 99 (53.8) | 0.253 |
| Initial immunosuppression (%) | |||||
| CNI, Tac/ CsA | 76 (60.3)/ 49 (38.9) | 97 (58.1)/ 68 (40.7) | 37 (61.7)/ 22 (36.7) | 140 (76.1)/ 41 (22.3) | 0.001 |
| AM drug, AZA/ MMF | 11 (8.7)/ 109 (86.5) | 13 (7.8)/ 145 (86.8) | 3 (5.0)/ 53 (88.3) | 5 (2.7)/ 170 (92.4) | 0.353 |
| Steroids, prednisolone | 122 (96.8) | 160 (95.8) | 56 (93.3) | 178 (96.7) | 0.712 |
| Variables | SCD | ECD | |||
|---|---|---|---|---|---|
| HLA-DR- ( | HLA-DR+ ( | HLA-DR- ( | HLA-DR+ ( | ||
| Kidney function | |||||
| Hyperacute rejection (%) | 0 | 1 (0.6) | 0 | 1 (0.5) | 0.784 |
| INF (%) | 6 (4.8) | 11 (6.6) | 2 (3.3) | 15 (8.2) | 0.434 |
| DGF (%) | 29 (23.0) | 38 (22.8) | 13 (21.7) | 66 (35.9) | 0.010 |
| GFR (mL/ min) | |||||
| POD 7 | 54.7 ± 39.8 | 50.0 ± 39.4 | 44.1 ± 32.9 | 38.8 ± 30.5 | 0.005 |
| POD 14 | 78.2 ± 39.0 | 65.5 ± 39.9 | 62.0 ± 33.1 | 50.1 ± 27.8 | <0.001 |
| POM 1 | 92.5 ± 37.9 | 88.1 ± 36.2 | 70.6 ± 25.4 | 63.1 ± 29.8 | <0.001 |
| POM 3 | 96.5 ± 33.2 | 89.0 ± 35.2 | 76.4 ± 26.8 | 68.5 ± 30.6 | <0.001 |
| POM 6 | 99.8 ± 34.2 | 94.7 ± 35.0 | 73.5 ± 23.5 | 71.9 ± 32.8 | <0.001 |
| Surgical outcome | |||||
| Time on ICU, days | 5.8 ± 6.0 | 4.8 ± 3.5 | 5.2 ± 3.1 | 5.8 ± 8.0 | 0.447 |
| Postoperative complications (%) | |||||
| Bleeding/hematoma | 15 (11.9) | 27 (16.2) | 10 (16.7) | 39 (21.2) | 0.194 |
| Vascular occlusion | 3 (2.4) | 5 (3.0) | 1 (1.7) | 9 (4.9) | 0.512 |
| Secondary wound healing | 26 (20.6) | 25 (15.0) | 6 (10.0) | 42 (22.8) | 0.074 |
| Lymphocele | 16 (12.7) | 13 (7.8) | 10 (16.7) | 28 (15.2) | 0.133 |
| Urine leakage | 1 (0.8) | 7 (4.2) | 1 (1.7) | 4 (2.2) | 0.281 |
| Hospitalisation, days | 26 ± 13.3 | 26 ± 15.4 | 27 ± 16.1 | 30 ± 20.9 | 0.066 |
| Rejection, 1st year (%) | 15 (11.9) | 24 (14.4) | 6 (10.0) | 33 (17.9) | 0.325 |
| Variables | SCD | ECD | |||
|---|---|---|---|---|---|
| HLA-DR- ( | HLA-DR+ ( | HLA-DR- ( | HLA-DR+ ( | ||
| Person years | 1,039.2 | 1,334.6 | 355.7 | 771.3 | |
| No rejections | 26 | 49 | 12 | 63 | |
| Incidence density | 2.5/ 100 | 3.7/ 100 | 3.4/ 100 | 8.2/ 100 | 0.005 |
| Variables | SCD | ECD | |||
|---|---|---|---|---|---|
| HLA-DR- ( | HLA-DR+ ( | HLA-DR- ( | HLA-DR+ ( | ||
| Person years | 1,039.2 | 1,334.6 | 355.7 | 771.3 | |
| Cause of graft loss | |||||
| Rejection | 5 | 16 | 5 | 20 | |
| Incidence density | 0.5/ 100 | 1.2/ 100 | 1.4/ 100 | 2.6/ 100 | 0.006 |
| Chronic allograft nephropathy | 4 | 10 | 1 | 11 | |
| Incidence density | 0.4/ 100 | 0.7/ 100 | 0.3/ 100 | 1.4/ 100 | 0.004 |
| Infection | 3 | 3 | 3 | 10 | |
| Incidence density | 0.3/ 100 | 0.2/ 100 | 0.8/ 100 | 1.3/ 100 | 0.003 |
| Variables | Delayed graft function (1) | Rejection (2) | Graft failure (death-censored) (2) | Patient survival (2) | ||||||||||||
|---|---|---|---|---|---|---|---|---|---|---|---|---|---|---|---|---|
| UVA | Multivariate analysis | UVA | Multivariate analysis | UVA | Multivariate analysis | UVA | Multivariate analysis | |||||||||
| OR | 95% CI | HR | 95% CI | HR | 95% CI | HR | 95% CI | |||||||||
| Donor | ||||||||||||||||
| Age | 0.056 | 0.012 | NS | NS | NS | <0.001 | NS | NS | NS | <0.001 | NS | NS | NS | |||
| Gender, male | 0.329 | 0.786 | 0.123 | 0.007 | NS | NS | NS | |||||||||
| BMI | 0.079 | 0.583 | 0.163 | 0.864 | ||||||||||||
| Cause of death | ||||||||||||||||
| CVA vs. non-CVA | 0.662 | 0.377 | 0.052 | 0.038 | NS | NS | NS | |||||||||
| Diabetes mellitus | 0.792 | 0.185 | 0.211 | 0.107 | ||||||||||||
| Hypertension | 0.062 | 0.090 | <0.001 | NS | NS | NS | <0.001 | NS | NS | NS | ||||||
| ECD | 0.012 | NS | NS | NS | 0.005 | NS | NS | NS | <0.001 | NS | NS | NS | <0.001 | 2.286 | 1.312–3.984 | 0.004 |
| Recipient | ||||||||||||||||
| Age | 0.025 | NS | NS | NS | 0.728 | 0.310 | <0.001 | 1.067 | 1.040–1.096 | <0.001 | ||||||
| Gender, male | 0.176 | 0.246 | 0.068 | 0.159 | ||||||||||||
| BMI | ||||||||||||||||
| 18.5–24.9 (ref) | 0.002 | NS | 0.805 | 0.038 | NS | 0.846 | ||||||||||
| <18.5 | 0.256 | NS | NS | NS | 0.660 | 0.414 | NS | NS | NS | 0.410 | ||||||
| 25–29.9 | 0.830 | NS | NS | NS | 0.568 | 0.768 | NS | NS | NS | 0.777 | ||||||
| >30 | <0.001 | NS | NS | NS | 0.368 | 0.006 | NS | NS | NS | 0.997 | ||||||
| Dialysis duration | 0.008 | 1.008 | 1.001–1.014 | 0.023 | 0.739 | 0.126 | 0.027 | NS | NS | NS | ||||||
| Cause of ESRD | ||||||||||||||||
| GN vs. non-GN | 0.889 | 0.190 | 0.356 | 0.146 | ||||||||||||
| Diabetes mellitus | 0.197 | 0.004 | 1.910 | 1.228–2.971 | 0.004 | <0.001 | 1.825 | 1.118–2.976 | 0.016 | <0.001 | 1.913 | 1.119–3.271 | 0.018 | |||
| Hypertension | 0.860 | 0.018 | NS | NS | NS | <0.001 | 2.375 | 1.331–4.238 | 0.003 | 0.225 | ||||||
| Coronary disease | 0.245 | 0.368 | 0.542 | <0.001 | NS | NS | NS | |||||||||
| PVD | 0.915 | 0.411 | 0.881 | 0.011 | NS | NS | NS | |||||||||
| Allocation | ||||||||||||||||
| Gender mismatch | 0.168 | 0.063 | 0.020 | NS | NS | NS | 0.036 | NS | NS | NS | ||||||
| CMV D + R- | 0.739 | 0.179 | 0.856 | 0.586 | ||||||||||||
| HLA-ABDR mismatch | ||||||||||||||||
| 0 (ref) | 0.707 | 0.446 | 0.440 | 0.015 | NS | |||||||||||
| 1–2 | 0.724 | 0.141 | 0.656 | 0.075 | NS | NS | NS | |||||||||
| 3–4 | 0.678 | 0.130 | 0.264 | 0.019 | NS | NS | NS | |||||||||
| 5–6 | 0.274 | 0.167 | 0.151 | 0.002 | NS | NS | NS | |||||||||
| HLA-A mismatch | 0.921 | 0.667 | 0.496 | 0.060 | ||||||||||||
| HLA-B mismatch | 0.888 | 0.047 | NS | NS | NS | 0.155 | 0.056 | |||||||||
| HLA-DR mismatch | 0.061 | 0.006 | NS | NS | NS | 0.002 | NS | NS | NS | 0.025 | NS | NS | NS | |||
| SCD HLA-DR- (ref) | 0.011 | NS | 0.004 | 0.003 | <0.001 | <0.001 | <0.001 | NS | ||||||||
| SCD HLA-DR + s | 0.975 | NS | NS | NS | 0.049 | 1.733 | 1.032–2.910 | 0.038 | 0.166 | 1.302 | 0.718–2.369 | 0.386 | 0.344 | NS | NS | NS |
| ECD HLA-DR- | 0.837 | NS | NS | NS | 0.141 | 1.829 | 0.941–3.553 | 0.075 | 0.064 | 2.013 | 0.958–4.237 | 0.065 | 0.010 | NS | NS | NS |
| ECD HLA-DR+ | 0.012 | NS | NS | NS | <0.001 | 2.631 | 1.578–4.389 | <0.001 | <0.001 | 3.528 | 2.008–6.197 | <0.001 | <0.001 | NS | NS | NS |
| Transplant | ||||||||||||||||
| Era | 0.151 | 0.185 | 0.468 | 0.645 | ||||||||||||
| PRA positive | 0.861 | 0.552 | 0.908 | 0.599 | ||||||||||||
| CIT | 0.879 | 0.840 | 0.913 | 0.004 | NS | NS | NS | |||||||||
| WIT | 0.016 | 1.019 | 1.004–1.033 | 0.011 | 0.560 | 0.176 | 0.089 | |||||||||
| Duration of surgery | 0.026 | NS | NS | NS | 0.980 | 0.016 | NS | NS | NS | 0.527 | ||||||
| Induction therapy | 0.152 | 0.570 | 0.785 | 0.157 | ||||||||||||
| Initial immunosuppression | ||||||||||||||||
| Tac vs. CsA | 0.039 | NS | NS | NS | 0.021 | 1.801 | 1.258–2.579 | 0.001 | 0.120 | 0.307 | ||||||
| AM | 0.609 | 0.459 | 0.762 | 0.926 | ||||||||||||
| Prednisolone | 0.885 | 0.738 | 0.898 | 0.770 | ||||||||||||
| Kidney function | ||||||||||||||||
| DGF | N/A | N/A | N/A | N/A | 0.359 | 0.392 | 0.069 | |||||||||
| Rejection, 1st year | N/A | N/A | N/A | N/A | N/A | N/A | N/A | N/A | <0.001 | 2.948 | 1.991–4.381 | <0.001 | 0.075 | |||
Peer Reviews
No public reviews on file for this paper yet. If you reviewed it on a platform where reviews are public (OpenReview, ICLR, NeurIPS, ICML), you can paste yours below so the community can read it here.
Videos
No videos yet. Explain this paper in a talk, walkthrough, or lecture? Add one.
Taxonomy
TopicsRenal Transplantation Outcomes and Treatments · Organ Transplantation Techniques and Outcomes · Organ Donation and Transplantation
Introduction
The persistent gap between the demand for and supply of deceased donor kidneys has led to an increased use of organs from expanded criteria donors (ECD). As defined in the literature, ECDs include all deceased kidney donors aged over 60 years, irrespective of the cause of death. Donors aged 50–59 are also classified as ECDs if they present with at least two of the following: a history of hypertension, a cerebrovascular cause of death, or a serum creatinine level greater than 1.5 mg/dL (1, 2). Although kidney transplantations (KT) from ECDs have been shown to increase transplant opportunities for older and comorbid patients and significantly extending recipientś life expectancy and quality of life compared to chronic dialysis, these organs are more frequently associated with delayed graft function and graft loss compared to standard criteria donor (SCD) organs (3).
In this context, the role of immunologic compatibility becomes increasingly important. Mismatches in human leukocyte antigens (HLA) between donor and recipient are well-established contributors to immune-mediated graft injury. In particular, mismatches in the Class II HLA molecule HLA-DR have been associated with poorer graft outcomes (4–6).
Although the impact of HLA-DR mismatches has been extensively studied, the individual interaction between immunological compatibility and donor kidney function is less well understood. In living donor kidney transplantation, higher donor eGFR significantly mitigates the risk of graft loss in recipients with HLA-DR mismatches, whereas no comparable benefit is observed in HLA-DR–matched recipients (7). And a previous study within the European Senior Program (ESP)—a program facilitating KT between older donors and recipients, typically aged 65 years and above—found that HLA-DR mismatches significantly increased the five-year risk of graft loss and mortality (8).
The clinical significance of HLA-DR mismatches in ECD transplant settings has not yet been investigated. This study therefore aims to assess postoperative outcomes, rejection rates and graft and patient survival in primary ECD KT in relation to HLA-DR matching.
Patients and methods
Data collection and study population
Medical data from all adult patients (≥18 years of age) who underwent initial deceased donor KT at the University Hospital of Leipzig between February 1994 and October 2024 were retrospectively analyzed. Our data source comprised a prospectively collected electronic database. Exclusion criteria were multi-organ (combined) transplants, re-transplants, missing data, kidney grafts from donors younger than 16 years, and graft loss due to technical failure within the first week after KT. Furthermore, to mitigate the confounding effects of preformed donor-specific antibodies, we excluded KT recipients with a pre-transplant PRA level greater than 5%. Follow-up data were collected until September 2025.
The characteristics of the study population included donor and recipient age, gender, body mass index (BMI; weight in kg/ height in m^2^), comorbidities, and preoperative cytomegalovirus status; donor cause of death, cause of recipient ESRD, duration of dialysis prior to KT. The estimated glomerular filtration rate was calculated with the Chronic Kidney Disease Epidemiology Collaboration equation and adjusted to the individual patient standard body surface area, as previously described (9).
Kidney donors were categorized into Standard Criteria donors (SCD) and Expanded Criteria Donors (ECD) according to the UNOS definition. Donors under 50 years of age were considered SCDs, those over 60 years as ECDs. Donors aged 50–59 were classified as ECDs if at least two of the following applied: history of hypertension, non-traumatic cerebrovascular cause of death, or serum creatinine >1.5 mg/dL; otherwise, they were considered SCDs (1, 2).
Transplant data included information on the number of human leukocyte antigen (HLA) -A, -B, and -DR mismatches (0–6), pretransplant PRA levels, cold and warm ischemia time (CIT and WIT, respectively), duration of operation, induction therapy as well as initial maintenance immunosuppressive therapy.
HLA typing was performed using both serological and molecular methods. During the 1990s and early 2000s, serological techniques (complement-dependent cytotoxicity) predominated, identifying broad antigen-level HLA designations (e.g., HLA-DR1, HLA-DR2). Molecular techniques (sequence-specific oligonucleotide probing, sequence-based typing) were progressively implemented from the mid-2000s onward, achieving predominance by 2010 and now providing split-level and allele-level resolution (e.g., DRB101:01 vs. DRB101:02).
Organ procurement, transplantation and immunosuppression were performed as described previously (9). Induction therapy was administered according to institutional protocol, using either anti-thymocyte globulin (ATG) or IL-2 receptor antagonists (daclizumab or basiliximab). Daclizumab was withdrawn from the market in 2018. At present, basiliximab is administered to all standard kidney transplant recipients and to re-transplant candidates with a PRA level below 85%, while ATG is reserved for highly sensitized recipients (PRA >85%) (Supplementary Figure S1A). Standard immunosuppressive therapy included a calcineurin inhibitor (cyclosporine (CsA) or tacrolimus (Tac), mycophenolic acid, and corticosteroids. CsA was used until 2009 for initial immunosuppressive therapy (Supplementary Figure S1B). For recipients with stable graft function, the recommended target trough concentrations during the first three to four weeks post-transplant were 8–12 ng/mL for tacrolimus (Tac) and 150–200 µg/L for cyclosporine (CsA), with further reductions made based on the institutional protocol. Maintenance immunosuppression was individualized according to clinical course, therapeutic drug monitoring, and adverse events.
HLA mismatches were obtained by Eurotransplant, which program focuses on the HLA-A, -B, and -DR loci. Mismatches for HLA-A and -B are calculated using broad antigen classifications, whereas HLA-DR mismatches are determined based on split antigen definitions regardless of typing methodology (10). This approach may result in slight underestimation of true molecular-level HLA incompatibility in early eras relying predominantly on serological typing. Any bias from mixed typing methodologies would conservatively bias toward the null hypothesis, potentially attenuating rather than inflating observed HLA-DR mismatch associations.
KT recipients were stratified into four groups based on the absence (-, 0 mismatch) or presence (+, ≥1 mismatch) of HLA-DR mismatches, and donor type (SCD or ECD): (1) SCD-DR-, (2) SCD-DR+, (3) ECD-DR- and (4) ECD-DR+.
Outcome measures
Complications occurring during the first three months after KT were defined as postoperative complications. Initial non-function (INF) of the graft was defined as dialysis dependence or creatinine clearance ≤20 mL/min at three months after KT. Delayed graft function (DGF) was defined as the need for dialysis in the first week post-transplant (11). Kidney allograft biopsies were performed for clinical indications (for-cause strategy) throughout the study period, responding to graft dysfunction signs including elevated serum creatinine (>25% above baseline), new-onset proteinuria, or clinical suspicion of rejection. Graft failure was defined as a return to dialysis or preemptive re-transplantation. Deaths occurring within 30 days after surgery were defined as post-operative deaths.
Statistical analysis
SPSS software, version 29.0 (SPSS Inc., Chicago, Illinois, USA) and GraphPad Prism software, version 10.4.0 (GraphPad Software, San Diego, California, USA) were used for statistical analysis and graphs. The chi-squared test and the Kruskal–Wallis test were used for analysis of categorical data. For the comparison of continuous variables, the student's t-test, analysis of variance (ANOVA) and the Wilcoxon–Mann–Whitney test were used. Uni- and multivariate logistic regression analyses were used to identify independent variables associated with allograft function and morbidity. For multivariate analyses, we employed forward stepwise logistic and Cox regression approaches, including only variables meeting both criteria: (1) clinical relevance based on transplant biology and transplantation literature, (2) statistical significance threshold of P < 0.05 in univariate analysis. Graft and patient survival were analyzed using the Kaplan–Meier and the log-rank test, whereas multivariate Cox proportional hazard analysis was applied to assess independent predictors of kidney graft failure. A P value < 0.05 was considered as statistically significant. Baseline data are presented as mean values with the standard deviation (SD).
Results
Study population
Between February 1994 and October 2024, 1135 kidney transplants (KT) were performed at our department. 537 KT were included in the study, with 244 (45.4%) kidney grafts from ECDs, and 351 (65.4%) KT having ≥1 HLA-DR mismatches (Figure 1). Mean follow up was 7.3 ± 5.9 years.
Flow chart showing study population selection. Category numbers do not sum up due to overlap between exclusion criteria.
Figure 2 illustrates the proportion of ECD kidney grafts in primary KT at our transplant center over the last three decades. Comparing the periods from 1995–1999 and 2020–2024, the data reveal a significant increase in ECD KTs from 33.5% to 56.1% (P = 0.034).
Rates of expended criteria donor (ECD) in primary kidney transplantation at the university hospital of Leipzig between 1995 and 2024.
The characteristics of the kidney donors, KT recipients, allocation data and transplantation according to the four study groups are summarized in Table 1. In the ECD group, donor age was significantly higher in HLA-DR mismatched KT (ECD-DR− vs. ECD-DR+: 64 ± 6.8 years vs. 67 ± 7.6 years; P = 0.003). Patients receiving kidney graft from ECDs were significantly older compared to recipients of kidney grafts from SCDs (48 ± 12.1 years vs. 60 ± 12.3 years; P < 0.001) and suffered more often from diabetes mellitus (9.6% vs. 18.9%; P = 0.002). Most patients received chronic hemodialysis prior to KT (N = 495, 92.2%), without statistical differences between the groups (P = 0.294). Duration of dialysis prior to KT was significantly longer in patients receiving SCD-DR + KT compared to those receiving SCD HLA-DR- KT (59.2 ± 33.0 months vs. 72.1 ± 38.7 months; P = 0.003), whereas no difference could be observed between the two ECD groups (54.5 ± 32.8 months vs. 58.4 ± 36.7 months; P = 0.482) (Figure 3). Regarding transplantation, SCD-DR + KT were associated with a slightly shorter cold ischemia time (CIT SCD-DR- vs. CIT SCD-DR+: 15.4 ± 6.0 h vs. 13.3 ± 5.5 h; P = 0.004), whereby warm ischemia time (WIT) was comparable between the groups (P > 0.05 each). Mean operation time was longer in the ECD group compared to the SCD group (180 ± 46.5 min vs. 192 ± 55.1 min; P = 0.006).
Duration of dialysis prior to KT according to the HLA-DR matching and donor type (standard (SCD) or expended criteria donor (ECD).
Immunosuppressive regimens evolved over the observation period but did not differ significantly between SCD and ECD grafts regarding induction strategy (ATG vs. IL-2 RA, P = 0.253), antimetabolite choice (MMF vs. AZA, P = 0.353), or corticosteroid use (P = 0.712). Maintenance CNI type differed across groups (P = 0.001 overall), reflecting the institutional transition from cyclosporine to tacrolimus that occurred systematically across all transplant types beginning 2005.
Postoperative graft function and outcome
The groups were mostly similar regarding the postoperative graft function and rates of surgical complications (Table 2). Time on intensive care unit and hospital stay were comparable between the groups (P > 0.05 each).
In the ECD group, HLA-DR mismatched KT showed significantly more often a delayed graft function (21.7% vs. 35.9%; P = 0.032). In SCD-DR + KT, as well as in the ECD-DR + KT, GFRs were significantly decreased two weeks post-transplant (P = 0.030, and P = 0.046, respectively).
There were five postoperative deaths. The causes of postoperative death included septic shock (N = 1), fulminant pulmonary embolism with cardiac arrest (N = 1), cerebral vascular accident (N = 2) and acute heart failure (N = 1).
Graft rejection
During the observation period, 282 kidney graft biopsies were performed in 182 patients, with 40.7% undergoing two, 11.5% three, and 3.3% four biopsies. Histopathological analysis revealed graft rejection in 56.5% of the cases.
In 78 KT recipients (14.5%), rejection arose within the first-year post-transplant. Notably, the incidence of rejection was higher in recipients of ECD-DR + kidney grafts compared to those who received organs from SCDs or ECDs without HLA-DR mismatch. Most cases within the first-year post-transplant presented as interstitial (T cell–mediated) rejections (73.3%–83.3%), while vascular (antibody-mediated) rejections were relatively infrequent across all groups (9.1%–16.7%) (Figure 4).
Biopsy-proven graft rejections within the first year after kidney transplantation according to the HLA-DR matching and donor type (standard (SCD) or expended criteria donor (ECD).
During long-term follow-up, rejection-free graft survival was significantly decreased in recipients of ECD-DR + kidneys (reference SCD-DR-: HR 2.464, CI 1.500–4.048; P < 0.001) (Figure 5). The incidence density of biopsy-proven rejection was significantly elevated in the ECD-DR + group, reaching 8.2 episodes per 100 patient-years (Table 3), compared to 3.4 episodes per 100 patient-years in the ECD-DR- group (P = 0.042). Notably, the incidence of T cell–mediated rejection was significantly higher in ECD-DR + KTs, whereas rates of B cell–mediated rejection did not differ significantly between the groups in subset analysis (Supplementary Figure S2).
Rejection free survival according to the HLA-DR matching and donor type (standard (SCD) or expended criteria donor (ECD).
Graft survival
The mean cumulative death-censored graft survival was 19.0 ± 0.8 years. The 1-, 5-, and 10-year graft survival rates were significantly decreased in ECD KTs compared with SCD KTs (SCD vs. ECD: 96%, 91%, and 80% vs. 88%, 74%, and 61%; P < 0.001). Within the ECD cohort, HLA-DR mismatched grafts were associated with poorer graft survival compared to HLA-DR matched KT (1-, 5-, 10-year graft survival: 91%, 85%, and 78% in ECD-DR- vs. 87%, 70%, and 54% in ECD-DR+; P = 0.034) (Figure 6). The most frequent causes for graft loss after KT were acute or chronic graft rejection (46 out of 124, 37.1%), chronic allograft nephropathy (26 out of 124, 21.0%), and infection (19 out of 124, 15.3%). Incidence rates of main causes of graft loss are shown in Table 4.
Death-censored graft survival according to the HLA-DR matching and donor type (standard (SCD) or expended criteria donor (ECD).
Patient survival
Patient survival rates at 1, 5, and 10 years were significantly lower in recipients of ECD kidneys compared to SCD grafts (SCD vs. ECD: 98%, 95%, and 88% vs. 91%, 82%, and 66%; P < 0.001). However, HLA-DR mismatch did not appear to affect overall patient survival (1-, 5-, 10-year graft survival: 93%, 83%, and 76% in ECD-DR- vs. 90%, 81%, and 62% in ECD-DR+; P = 0.246) (Figure 7). The most common causes of death after KT were fulminant sepsis (24 out of 9, 26.7%) and cardiac events (14 out of 90, 15.6%).
Patient survival according to the HLA-DR matching and donor type (standard (SCD) or expended criteria donor (ECD).
Multivariate analyses
Multivariate regression analysis of risk factors of delayed graft function, rejection, graft and patient survival are shown in Table 5.
Delayed graft function
Independent predictors of delayed graft function (DGF) were duration of dialysis before KT [adjusted HR (aHR) 1.008; P = 0.023] and WIT (aHR 1.019; P = 0.011). In multivariate regression analysis, neither ECD nor HLA-DR were independent predictors of DGF.
Graft rejection
After adjustment for important covariates using the Cox proportional hazards model, HLA-DR mismatch remained an independent predictor of graft rejection in both SCD KT (aHR 1.733; P = 0.038) and ECD KT (aHR 2.631; P < 0.001), compared to SCD-DR matched KT. Other independent predictors of graft rejection were recipient diabetes mellitus (aHR 1.910; P = 0.004) and initial immunosuppression with ciclosporin instead of tacrolimus (aHR 1.801; P = 0.001).
Graft survival
In multivariate Cox regression analysis recipient diabetes mellitus (aHR 1.825; P = 0.016), recipient hypertension (aHR 2.375; P = 0.003), HLA-DR mismatch in ECD KT (aHR 3.528; P < 0.001), and graft rejection within the first year after KT (aHR 2.948; P < 0.001) remained independent predictors of graft failure.
Patient survival
ECD (aHR 2.286; P = 0.004), recipient age (aHR 1.067; P < 0.001), and recipient diabetes mellitus (aHR 1.913; P = 0.018), were significantly associated with patient survival in multivariate Cox regression analysis. HLA-DR mismatch showed no influence on mortality rates after primary KT.
CIT (analyzed continuously and using 12- and 18-hours cutoffs), induction therapy, antimetabolite choice, and corticosteroids demonstrated no independent influence on any outcome when adjusted for era and other covariates.
Subdividing HLA-A, -B, and -DR mismatch rates into 0, 1, or 2 mismatches did not alter the regression analysis results.
Sensitivity analyses
Transplant era and immunosuppression
To address concerns regarding potential confounding by evolving immunosuppressive protocols and HLA typing methodologies, we performed sensitivity analyses restricted to the transplant eras.
Era-stratified analyses demonstrated that HLA-DR mismatch effects on graft rejection were consistent across first two decades examined (1995–2004, 2005–2014), with ECD-DR+ consistently showing significantly increased rejection risk compared to SCD-DR− (all P < 0.05) (Supplementary Figure S3A). Stratified analysis in the recent era (2015–2024) was limited by small subgroup sample sizes (SCD-DR−, N = 27) and minimal early graft loss events, resulting in unstable hazard ratio estimates (>1,000). This limitation reflects insufficient event density in recent cohorts with limited long-term follow-up rather than absence of HLA-DR effects. In multivariate models including transplant decade as a categorical covariate, era adjustment had no independent influence on DGF, rejection, graft loss, or patient survival outcomes. Sensitivity analyses restricted to the modern era (2010–2024), during which tacrolimus-based maintenance immunosuppression and molecular HLA typing methodologies were standard, demonstrated consistent HLA-DR mismatch effects in the modern-era cohort, with significantly higher rates of graft loss in the ECD-DR + KT group compared to SCD-DR- KT (Supplementary Figure S3B).
Delayed graft function
Univariate Cox regression analyses of graft rejection and graft survival across HLA-DR groups, stratified by the presence or absence of DGF revealed that ECD-DR+ recipients exhibited significantly higher rates of rejection and graft loss compared to SCD-DR- recipients, independent of the presence of DGF (Supplementary Figure S4). The higher DGF rates in ECD-DR+ recipients (35.9% vs. 21.7%, P = 0.032) likely reflect differential organ quality rather than serving as an independent determinant of long-term graft failure. The association between HLA-DR mismatch and graft loss appears to operate primarily through T cell–mediated rejection mechanisms, which were significantly elevated in ECD-DR+ recipients (8.2 vs. 3.4 episodes per 100 patient-years, P = 0.042), rather than through DGF-related pathways.
Discussion
The proportion of kidney transplants (KT) from extended criteria donors (ECDs) has increased significantly over the past decades, and this trend is likely to result in more younger recipients receiving ECD grafts in the future.
Our study shows that in ECD KT, HLA-DR mismatches are associated with higher rejection rates and reduced graft survival. These findings challenge the assumption that immunologic matching is less critical for ECD grafts and suggest that optimizing HLA-DR compatibility—particularly for younger or lower-risk recipients—may be beneficial (6).
The percentage of 5–6 HLA mismatches was higher in the ECD-DR+ group than in the SCD-DR+ group (11.4% vs. 34.8%). This likely reflects the greater polymorphism of HLA-A and -B compared to HLA-DR, as well as the lower prioritization of mismatches within the ESP. However, statistical analyses showed no predictive value for either the total number of HLA mismatches or HLA-A and -B mismatches in transplant outcomes. Notably, in our cohort, only eight KTs with an HLA-DR mismatch were matched for HLA-A and -B (four in SCD-DR+ and four in ECD-DR+), preventing further analysis.
Rejection
This study demonstrates that HLA-DR mismatches are an independent risk factor for graft rejection in both SCD and ECD KTs. The likelihood of T cell-mediated graft rejection (TCMR) was particularly increased in kidneys from ECDs. A previous retrospective study by Halleck et al. analyzing 972 KTs from both living and deceased donors also identified HLA-DR mismatches as independent risk factors for TCMR. In elderly KT recipients, HLA-DR mismatches were associated with a significantly higher incidence of TCMR and the development of de novo donor-specific antibodies, leading to poorer graft survival. Most TCMR episodes occurred within the first six months post-transplant. The incidence of antibody-mediated rejection was similar between HLA-DR mismatch-positive and -negative transplants (5%–9% within 7 years post-transplant), consistent with our findings (12).
In the Eurotransplant region, ECD kidneys are primarily allocated to older recipients. However, the impact of immunosenescence on KT outcomes is not fully understood. While advancing age in recipients is associated with a reduced incidence of allograft rejection, likely due to diminished T cell–mediated immune responses, ECD grafts are known to carry a higher risk of both acute and chronic rejection (12–15). This suggests that HLA-DR mismatches may disrupt the balance between the reduced immune activity in elderly recipients and the heightened immunogenicity of ECD grafts (16).
Graft survival
In the present study, HLA-DR mismatch was an independent predictor of graft loss in ECD KT compared with SCD-matched KT. This aligns with de Fijter et al., who reported that HLA-DR matching improves five-year graft survival and function in ESP kidney transplants (8). However, in this study, the impact of HLA-DR mismatch was examined only in KTs from donors and recipients over 65. In contrast, our study defined organ quality based on both donor age and medical history. The increased risk of graft failure in ECD recipients is likely multifactorial. ECD kidneys were mostly transplanted into older recipients with more comorbidities, potentially exacerbating graft vulnerability and increasing the risk of repeated rejection and graft loss. It is plausible that SCD kidneys are better able to compensate for the negative effects of HLA-DR mismatches. In a retrospective analysis of over 44,000 living donor kidney transplants, Budhiraja et al. showed that higher donor eGFR significantly reduced the risk of graft loss in recipients with HLA-DR mismatches, but not in those with HLA-DR matches. This suggests that superior donor kidney function can partially offset the immunological burden of an HLA-DR mismatch. The effect was most pronounced in younger recipients (aged 18–39), in whom HLA-DR compatibility not only improved long-term graft survival but also reduced the risk of sensitization—a key consideration, as younger patients are more likely to require multiple transplants and are at higher risk of developing de novo HLA antibodies (7). In our study, the small number of younger recipients precluded statistical analysis, and data on de novo sensitization were limited.
Limitations
This study has several limitations. First, its retrospective, single-center, and non-randomized design may introduce bias.
Second, the extended investigation period constrained data evaluation, highlighting the need for controlled, prospective studies. Detailed assessment of graft rejection grades was restricted by potential inconsistencies in histopathological evaluation over time (revisions in the Banff classification), and era-dependent confounding factors—such as changes in medical care, and immunosuppression—cannot be fully excluded. Heterogeneous biopsy reporting practices and potential missing data across eras may introduce residual confounding, particularly when interpreting long-term graft survival differences and the mechanisms of rejection. Biopsy diagnoses were therefore limited to categorical assessment (T cell–mediated vs. antibody-mediated rejection), precluding more granular immunological interpretation. The for-cause biopsy approach may introduce differential surveillance bias, potentially favoring detection of rejection in recipients with more clinical graft dysfunction (possibly overrepresented in ECD-DR+ group).
Third, our analysis relies on low-resolution antigen-level HLA typing, which represents a significant limitation in the context of contemporary immunogenetics. Recent evidence demonstrates that eplet-level and molecular HLA mismatch provide superior predictive value for de novo donor-specific antibodies, T cell–mediated rejection incidence, and long-term graft survival compared to traditional antigen-level assessment (17–19). The consistent association between HLA-DR antigen-level mismatch and adverse outcomes observed in our cohort, despite this methodological limitation, suggests that the true immunological impact at the molecular/eplet level may be even more pronounced. This finding provides additional justification for implementation of extended genomic HLA typing in ECD allocation algorithms, particularly when considering high-immunogenicity recipients. Future prospective studies should employ extended genomic HLA typing to define HLA-DR mismatches at the allelic and eplet levels, which would provide mechanistic insights into T cell vs. antibody-mediated rejection pathways and enable more precise risk stratification for personalized allocation strategies.
Fourth, this study enrolled a selected population with low baseline alloimmunological risk (PRA ≤5% at transplant), which restricts generalizability to highly sensitized patients (PRA >5%). Sensitized recipients represent a distinct immunological phenotype with higher baseline rejection risk and potential pre-existing HLA-specific memory responses that may differentially modulate the effect of HLA-DR mismatch. The cohort composition limits applicability to sensitized kidney transplant candidates, in whom the magnitude of HLA-DR mismatch effects may differ.
Fifth, the absence of comprehensive de novo donor-specific antibody (dnDSA) monitoring throughout the follow-up period limits mechanistic interpretation of HLA-DR mismatch effects. Our histological data suggest T cell–mediated rejection predominates (73.3–83.3% of first-year rejection episodes), but we cannot quantify the contribution of antibody-mediated mechanisms or subclinical DSA development. Prospective studies incorporating serial dnDSA monitoring would elucidate whether HLA-DR mismatch primarily operates through T cell–mediated rejection or antibody-mediated pathways, and whether sensitized recipients demonstrate qualitatively different mechanisms of HLA-DR mismatch-related graft loss. Prospective studies incorporating serial dnDSA monitoring would elucidate whether HLA-DR mismatch primarily operates through T cell –mediated rejection or antibody-mediated pathways.
Conclusion
In conclusion, due to the elevated rejection rates and impaired graft survival observed, ECD kidney grafts with HLA-DR mismatches warrant careful consideration during organ allocation. However, prospective multicenter validation is essential before implementing policy changes. If these findings are confirmed in controlled prospective studies, prioritizing HLA-DR matching—including high-resolution and eplet-level matching—could reduce rejection risk and improve graft longevity in this population. At the same time, the benefits of HLA compatibility must be weighed against the potential risks of prolonged waiting times, which may offset these advantages.
The reference list from the paper itself. Each links out to its DOI / PubMed record.
- 1Metzger RA Delmonico FL Feng S Port FK Wynn JJ Merion RM. Expanded criteria donors for kidney transplantation. Am J Transplant. (2003) 3(Suppl 4):114–25. 10.1034/j.1600-6143.3.s 4.11.x 12694055 · doi ↗ · pubmed ↗
- 2Rao PS Ojo A. The alphabet soup of kidney transplantation: SCD, DCD, ECD–fundamentals for the practicing nephrologist. Clin J Am Soc Nephrol. (2009) 4(11):1827–31. 10.2215/CJN.0227040919808229 · doi ↗ · pubmed ↗
- 3Argani H. Expanded criteria donors. Exp Clin Transplant. (2022) 20(Suppl 4):13–9. 10.6002/ect.Donor Symp.2022.L 1336018014 · doi ↗ · pubmed ↗
- 4Wiebe C Nickerson PW. Human leukocyte antigen molecular mismatch to risk stratify kidney transplant recipients. Curr Opin Organ Transplant. (2020) 25(1):8–14. 10.1097/MOT.000000000000071431789952 · doi ↗ · pubmed ↗
- 5Doxiadis II de Fijter JW Mallat MJ Haasnoot GW Ringers J Persijn GG Simpler and equitable allocation of kidneys from postmortem donors primarily based on full HLA-DR compatibility. Transplantation. (2007) 83:1207–13. 10.1097/01.tp.0000261108.27421.bc 17496537 · doi ↗ · pubmed ↗
- 6Doxiadis II. Compatibility and kidney transplantation: the way to go. Front Immunol. (2012) 3:111. 10.3389/fimmu.2012.0011122593759 PMC 3350869 · doi ↗ · pubmed ↗
- 7Budhiraja P Schold JD Lopez R Arrigain S Kaplan B. Evaluating the impact of donor e GFR and HLA-DR mismatch on graft survival in living donor kidney transplants. Front Nephrol. (2025) 4:1518791. 10.3389/fneph.2024.151879139839369 PMC 11747204 · doi ↗ · pubmed ↗
- 8de Fijter J Dreyer G Mallat M Budde K Pratschke J Klempnauer J A paired-kidney allocation study found superior survival with HLA-DR compatible kidney transplants in the eurotransplant senior program. Kidney Int. (2023) 104(3):552–61. 10.1016/j.kint.2023.05.02537343659 · doi ↗ · pubmed ↗