Beyond the physical: exploring the complexities of Women’s health after severe perineal trauma—a cross-sectional study on predictors of health-related quality of life in Sweden
Katharina Tjernström, Inger Lindberg, Maria Wiklund, Margareta Persson

TL;DR
This study explores how severe perineal trauma during childbirth affects women's long-term health and quality of life in Sweden.
Contribution
The study identifies predictors of physical and mental health outcomes in women with severe perineal trauma at least 18 months postpartum.
Findings
Women with severe perineal trauma had lower physical and mental health scores compared to the general population in Sweden.
Physical health was predicted by symptom bother, work ability, education, and physical activity, while mental health was influenced by age and work ability.
Abstract
Severe perineal trauma (SPT), defined as third- or fourth-degree lacerations during childbirth, is a known risk factor for adverse postpartum health-related quality of life (HRQoL). Although HRQoL may improve within six months postpartum, up to 30% of affected women in Sweden report long-term health problems beyond one year. While qualitative studies highlight the broad negative impact, quantitative findings remain inconclusive, particularly regarding the role of pelvic floor symptoms and the degree of SPT, underscoring the need for further research. The aim is to assess and compare HRQoL in a sample of women with SPT, and to identify predictors of physical and mental health at least 18 months postpartum. A nationwide cross-sectional study was conducted in Sweden using an online questionnaire to assess HRQoL via the validated RAND-36 instrument. Linear regression analysis was employed…
Genes, proteins, chemicals, diseases, species, mutations and cell lines named across the full text — each resolved to its canonical identifier and authoritative record.
Click any figure to enlarge with its caption.
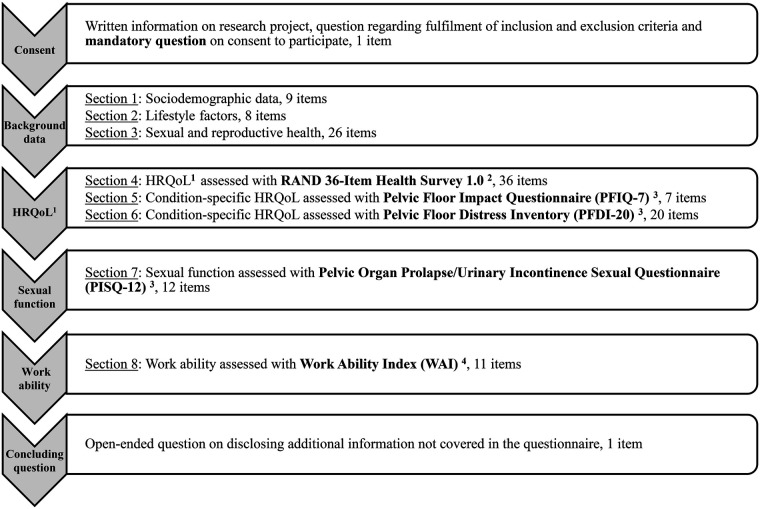 Figure 1
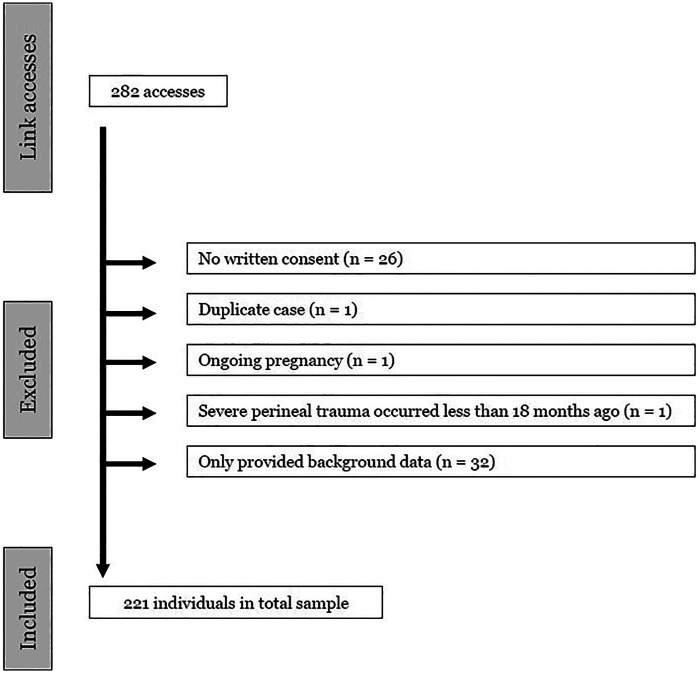 Figure 2
| Continuous variable | Outcome/predictor | Description | Validated | Number of items | Scoring | Scales/groups |
|---|---|---|---|---|---|---|
| Age | Sociodemographic predictor | Age in years | N/A | 1 item | Derived from the participant's year of birth | Single scale variable |
| RAND-36 | Outcome | RAND 36-Item Health Survey 1.0 assessing health-related quality of life on eight health concepts. | English | 36 items | 0 (worst health status)−100 (best health status) on all scales | 8 subscales: |
| Symptom bother from SPT | Obstetric predictor | Visual analogue scale assessing symptom bother from SPT. | Not validated for use on symptom bother | 1 item | 0 (no bother)−10 (extreme bother) on integer scale | Single scale variable |
| Total WAI-score | Occupational predictor | Work Ability Index (WAI) assessing level of work ability. | English | 7 items | 7 (poor work ability) – 49 points (excellent work ability) | Single score variable |
| Variables | Raw data | Imputed data | ||||
|---|---|---|---|---|---|---|
| Set 1 | Set 2 | Set 3 | Set 4 | Set 5 | ||
| Sociodemographic variables | ||||||
| Age in years | ||||||
| Mean (SD; min-max) | 40.0 (7.8; 24–71) | 40.0 (7.7; 24–71) | 40.0 (7.7; 24–71) | 40.0 (7.8; 24–71) | 40.0 (7.7; 24–71) | 40.1 (7.9; 24–71) |
| Median (Q1-Q3; min-max) | 38.0 (35–43; 24–71) | 38.0 (35–43; 24–71) | 38.0 (35–43; 24–71) | 38.0 (35–43; 24–71) | 38.0 (35–43; 24–71) | 38.0 (35–43; 24–71) |
| Missing data, | 1 (0.5) | 0 | 0 | 0 | 0 | 0 |
| Country of birth - Sweden, | 206 (93.2) | 209 (94.6) | 209 (94.6) | 207 (93.7) | 210 (95.0) | 209 (94.6) |
| Other country, | 11 (5.0) | 12 (5.4) | 12 (5.4) | 14 (6.3) | 11 (5.0) | 12 (5.4) |
| Missing data, | 4 (1.8) | 0 | 0 | 0 | 0 | 0 |
| Highest completed educational level | ||||||
| University, | 181 (81.9) | 183 (82.8) | 184 (83.3) | 182 (82.4) | 182 (82.4) | 183 (82.8) |
| Primary or secondary school, | 37 (16.7) | 38 (17.2) | 37 (16.7) | 39 (17.6) | 39 (17.6) | 38 (17.2) |
| Missing data, | 3 (1.4) | 0 | 0 | 0 | 0 | 0 |
| Co-habiting with partner, | 194 (87.8) | |||||
| Missing data, | 0 | |||||
| Tobacco user (cigarettes/cigarillos/pipes/e-
cigarettes/joints/snuff), | 30 (13.6) | |||||
| Missing data, | 0 | |||||
| Level of physical activity compared to before SPT | ||||||
| Same level of physical activity, | 61 (27.6) | |||||
| Higher level of physical activity, | 38 (17.2) | |||||
| Lower level of physical activity, | 122 (55.2) | |||||
| Missing data, | 0 | |||||
| Obstetric variables | ||||||
| Parity | ||||||
| Primipara, | 53 (24.0) | |||||
| Multipara, | 168 (76.0) | |||||
| Missing data, | 0 | |||||
| Degree of SPT | ||||||
| Third-degree, | 145 (65.6) | |||||
| Fourth-degree, | 76 (34.4) | |||||
| Missing data, | 0 | |||||
| Number of years living with SPT | ||||||
| Mean (SD; min-max) | 10.0 (8.2; 1–49) | |||||
| Median (Q1–Q3; min-max) | 8.0 (4–13; 1–49) | |||||
| 18 months to 5 years, | 76 (34.4) | |||||
| 6–10 years, | 61 (27.6) | |||||
| More than 10 years, | 84 (38.0) | |||||
| Missing data, | 0 | |||||
| Current diseases diagnosed by a physician | ||||||
| Genitourinary disease, | 8 (3.6) | |||||
| Digestive disease, | 27 (12.2) | |||||
| Mental disorder, | 54 (24.4) | |||||
| Missing data, | 0 | |||||
| Symptom bother from SPT | ||||||
| Mean (SD; min-max) | 5.2 (2.8; 0–10) | 5.2 (2.8; 0–10) | 5.2 (2.8; 0–10) | 5.2 (2.8; 0–10) | 5.3 (2.8; 0–10) | 5.2 (2.8; 0–10) |
| Median (Q1-Q3; min-max) | 5.0 (3.0–7.0; 0–10) | 5.0 (3.0–7.0; 0–10) | 5.0 (3.0–7.0; 0–10) | 5.0 (3.0–7.0; 0–10) | 5.0 (3.0–7.0; 0–10) | 5.0 (3.0–7.0; 0–10) |
| Mild symptom bother | 67 (30.3) | 68 (30.8) | 70 (31.7) | 67 (30.3) | 68 (30.8) | 68 (30.8) |
| Moderate symptom bother | 72 (32.6) | 74 (33.5) | 74 (33.5) | 75 (33.9) | 73 (33.0) | 75 (33.9) |
| Severe symptom bother | 77 (34.8) | 79 (35.7) | 77 (34.8) | 79 (35.7) | 80 (36.2) | 78 (35.3) |
| Missing data, | 5 (2.3) | 0 | 0 | 0 | 0 | 0 |
| Reconstructive surgery, | 67 (30.3) | 68 (30.8) | 68 (30.8) | 67 (30.3) | 68 (30.8) | 68 (30.8) |
| No reconstructive surgery, | 153 (69.2) | 153 (69.2) | 153 (69.2) | 154 (69.7) | 153 (69.2) | 153 (69.2) |
| Missing data, | 1 (0.5) | 0 | 0 | 0 | 0 | 0 |
| Occupational variables | ||||||
| Employment status | ||||||
| Employed, | 190 (86.0) | |||||
| Self-employed, | 9 (4.1) | |||||
| Student, | 11 (5.0) | |||||
| Other (unemployed: | 11 (5.0) | |||||
| Missing data, | 0 | |||||
| Employment rate | ||||||
| Full-time (100%), | 152 (68.8) | 155 (70.1) | 154 (69.7) | 155 (70.1) | 157 (71.0) | 162 (73.3) |
| Part-time (75% or more), | 40 (18.1) | 50 (22.6) | 43 (19.5) | 52 (23.5) | 49 (22.2) | 43 (19.5) |
| Part-time (less than 75%), | 13 (5.9) | 16 (7.2) | 24 (10.9) | 14 (6.3) | 15 (6.8) | 16 (7.2) |
| Missing data, | 16 (7.2) | 0 | 0 | 0 | 0 | 0 |
| History of sick leave in adult life | ||||||
| No sick leave, | 118 (53.4) | 118 (53.4) | 119 (53.8) | 118 (53.4) | 119 (53.8) | 118 (53.4) |
| Sick leave due to SPT, | 29 (13.1) | 30 (13.6) | 29 (13.1) | 29 (13.1) | 29 (13.1) | 29 (13.1) |
| Sick leave due to SPT and other diagnosis, | 18 (8.1) | 18 (8.1) | 18 (8.1) | 19 (8.6) | 18 (8.1) | 19 (8.6) |
| Sick leave due to other diagnosis, | 55 (24.9) | 55 (24.9) | 55 (24.9) | 55 (24.9) | 55 (24.9) | 55 (24.9) |
| Missing data, | 1 (0.5) | 0 | 0 | 0 | 0 | 0 |
| WAI total score | ||||||
| Mean (SD; min-max) | 38.9 (7.4; 13–49) | 38.8 (7.3; 13–49) | 38.8 (7.2; 13–49) | 38.8 (7.5; 13–49) | 38.6 (7.3; 13–49) | 38.9 (7.7; 13–49) |
| Median (Q1-Q3; min-max) | 41.0 (35.5–44.0; 13–49) | 40.0 (35.0–44.0; 13–49) | 40.0 (34.5–44.0; 13–49) | 41.0 (35.0–44.3; 13–49) | 40.0 (34.7–44.0; 13–49) | 41.0 (35.5–44.7; 13–49) |
| Poor work ability (7–27 points), | 18 (8.1) | 22 (10.0) | 30 (13.6) | 30 (13.6) | 25 (11.3) | 20 (9.0) |
| Moderate work ability (28–36 points), | 43 (19.5) | 50 (22.6) | 48 (21.7) | 46 (20.8) | 52 (23.5) | 48 (21.7) |
| Good work ability (37–43 points), | 81 (36.7) | 87 (39.4) | 85 (38.5) | 84 (38.0) | 82 (37.1) | 82 (37.1) |
| Excellent work ability (44–49 points), | 55 (24.9) | 62 (28.1) | 58 (26.2) | 61 (27.6) | 62 (28.1) | 71 (32.1) |
| Missing data, | 24 (10.9) | 0 | 0 | 0 | 0 | 0 |
| Statistical measures | Physical functioning | Role limitations due to physical health | Role limitations due to emotional problems | Energy/fatigue | Emotional well-being | Social functioning | Pain | General health | Health change | Physical composite score | Mental composite score |
|---|---|---|---|---|---|---|---|---|---|---|---|
| Raw scores | |||||||||||
| Mean raw score ( | 82.8 (19.8) | 67.8 (40.6) | 65.4 (40.7) | 46.9 (20.3) | 67.5 (16.7) | 73.0 (24.0) | 74.4 (24.9) | 57.8 (20.9) | 54.5 (21.6) | 70.7 (22.1) | 63.2 (21.4) |
| 80.1–85.4 | 62.4–73.3 | 59.9–70.8 | 44.2–49.6 | 65.3–69.7 | 69.9–76.3 | 71.2–77.9 | 55.0–60.6 | 51.6–57.4 | 67.7–73.6 | 60.4–66.0 | |
| Median ( | 90.0 (75.0–95.0) | 100.0 (25.0–100.0) | 100.0 (33.3–100.0) | 45.0 (30.0–65.0) | 68.0 (56.0–80.0) | 75.0 (50.0–100.0) | 80.0 (57.5–100.0) | 60.0 (42.5–75.0) | 50.0 (50.0–75.0) | 77.5 (56.3–88.8) | 66.9 (47.5–82.3) |
| Skewness | −1.543 | −0.759 | −0.606 | −0.047 | −0.596 | −0.666 | −0.678 | −0.099 | 0.035 | −0.783 | −0.481 |
| Kurtosis | 1.953 | −1.125 | −1.300 | −0.637 | 0.306 | −0.250 | −0.603 | −0.688 | 0.240 | −0.421 | −0.859 |
| Range | 1–100 | 1–100 | 1–100 | 1–100 | 1–100 | 1–100 | 1–100 | 1–100 | 1–100 | 1–100 | 1–100 |
| Floor (%) | 0.5 | 19.9 | 20.4 | 0.5 | 0.5 | 0.9 | 0.9 | 0.5 | 2.7 | 0.5 | 0.5 |
| Ceiling (%) | 23.1 | 53.8 | 52.0 | 0.9 | 0.9 | 27.6 | 30.3 | 2.3 | 6.8 | 1.4 | 0.5 |
| Missing data | 0 | 0 | 0 | 0 | 0 | 0 | 0 | 0 | 3 (1.4) | 0 | 0 |
| Normal distribution | No | No | No | Yes | No | No | No | Yes | Yes | No | No |
| −1.99 (220) | −5.90 (220) | ||||||||||
|
|
| ||||||||||
| T-scores | |||||||||||
| Mean t−score ( | 50.5 (7.6) | 48.7 (9.9) | 48.0 (10.2) | 45.1 (8.5) | 46.7 (8.4) | 46.9 (9.5) | 50.5 (9.1) | 46.1 (8.9) | N/A | 49.0 (7.5) | 46.9 (7.9) |
| Predictors | Reference group |
| S.E. |
|
| Lower 95% | Upper 95% |
|---|---|---|---|---|---|---|---|
| PCS | |||||||
| Symptom bother | N/A | −2.978 | 0.395 | −7.532 | <0.001 | −3.754 | −2.203 |
| Total WAI-score | N/A | 1.167 | 0.163 | 7.180 | <0.001 | 0.845 | 1.489 |
| Primary- or secondary-level of education | University-level education | −6.177 | 2.740 | −2.254 | 0.025 | −11.571 | −0.783 |
| Lower level of physical activity than before SPT | Same level | −9.162 | 2.325 | −3.940 | <0.001 | −13.721 | −4.603 |
| Constant | N/A | 42.747 | 9.708 | 4.403 | <0.001 | 23.519 | 61.976 |
| MCS | |||||||
| Age | N/A | 0.361 | 0.158 | 2.289 | 0.023 | 0.050 | 0.671 |
| Symptom bother | N/A | −1.171 | 0.431 | −2.718 | 0.007 | −2.015 | −0.326 |
| Total WAI-score | N/A | 1.641 | 0.172 | 9.542 | <0.001 | 1.302 | 1.980 |
| History of sick leave in adult life | No history of sick leave | −5.405 | 2.636 | −2.051 | 0.042 | −10.610 | −0.200 |
| Constant | N/A | −2.800 | 10.133 | −0.276 | 0.782 | −22.744 | 17.144 |
| Predictors | Reference group |
| S.E. |
|
| Lower 95% | Upper 95% |
|---|---|---|---|---|---|---|---|
| PCS | |||||||
| Symptom bother | N/A | −2.883 | 0.385 | −7.493 | <0.001 | −3.638 | −2.129 |
| Total WAI-score | N/A | 1.258 | 0.163 | 7.718 | <0.001 | 0.935 | 1.582 |
| Primary- or secondary-level of education | University-level education | −5.947 | 2.762 | −2.153 | 0.033 | −11.399 | −0.496 |
| Lower level of physical activity than before SPT | Same level | −7.888 | 2.336 | −3.377 | <0.001 | −12.470 | −3.306 |
| Constant | N/A | 33.770 | 9.606 | 3.515 | <0.001 | 14.835 | 52.705 |
| MCS | |||||||
| Age | N/A | 0.420 | 0.153 | 2.744 | 0.006 | 0.119 | 0.720 |
| Symptom bother | N/A | −1.112 | 0.430 | −2.583 | 0.010 | −1.956 | −0.267 |
| Total WAI-score | N/A | 1.676 | 0.181 | 9.268 | <0.001 | 1.316 | 2.037 |
| History of sick leave in adult life | No history of sick leave | −4.967 | 2.699 | −1.841 | 0.069 | −10.332 | 0.397 |
| Constant | N/A | −7.634 | 10.474 | −0.729 | 0.467 | −28.337 | 13.068 |
Peer Reviews
No public reviews on file for this paper yet. If you reviewed it on a platform where reviews are public (OpenReview, ICLR, NeurIPS, ICML), you can paste yours below so the community can read it here.
Videos
No videos yet. Explain this paper in a talk, walkthrough, or lecture? Add one.
Taxonomy
TopicsPelvic floor disorders treatments · Pregnancy-related medical research · Urological Disorders and Treatments
Introduction
1
Severe perineal trauma (SPT), defined as third- or fourth-degree perineal laceration during childbirth (1), can lead to long-term physical, psychological, and social consequences (2–8). SPT is a recognized risk factor for adverse postpartum quality of life (9). Its incidence ranges from 0.1%–5.2% in Europe (10, 11) and about 2%–3% in Nordic countries (12, 13). In Sweden, the 2023 incidence was 2.7% (13), with systematic postpartum follow-up via the National Perineal Laceration Register (14). Despite this, around 30% of Swedish women with SPT report complications after one year (14).
Health-related quality of life (HRQoL) (15) defines a specific dimension of overall quality of life that pertains to health. HRQoL includes both subjective perceptions and objective assessments of physical, psychological, and social well-being, forming a multifaceted construct. Furthermore, HRQoL evaluates the impact of health conditions, diseases, and treatments on an individual's life, considering personal experiences and actual functioning across various health domains, while also encompassing the values attributed to different health states (15). Although HRQoL appears to improve among women with SPT during the first six months (16), the long-term (beyond one year postpartum) implications of SPT on HRQoL remain insufficiently studied. SPT might entail substantial emotional distress, such as anxiety, loneliness, and shame, which negatively influences Women’s daily lives (2). Inconsistent support from healthcare professionals further exacerbates anxiety and stress after SPT (2, 17). Additionally, SPT significantly influences Women’s reproductive decisions, family planning (18), and professional lives (19). Besides mental health problems (2), SPT can lead to a variety of long-term physical morbidities, including pain (2), incontinence (3), defecation problems (4), vaginal prolapse (5), and sexual dysfunction (6). Despite this, research on HRQoL after SPT has predominantly focused on anal incontinence, with most studies indicating a significant negative impact on HRQoL (20–25). In this context, women with anal incontinence experience loss and grief while struggling with their complex social roles. They also find themselves caught between personal and professional silence or disclosure, employing strategies such as avoidance, denial, and compromise to regain normality (7, 21).
This study addresses the knowledge gap of whether other pelvic floor symptoms and the grade of SPT impact HRQoL (26–29) or not (16, 25, 30). Changes in HRQoL have been used to evaluate recommendations for subsequent birth mode after SPT (31–34) and various treatments, including surgical approaches (35–37) and physical therapy (38, 39). Qualitative research suggests a negative impact on Women’s daily lives, including limitations in social life, daily activities, motherhood, and sexual functioning, while quantitative studies are inconclusive due to methodological limitations (8). Thus, the aim is to assess and compare HRQoL in a sample of women with SPT, and to identify predictors of physical and mental health at least 18 months postpartum.
Materials and methods
2
Study design
2.1
The present study was designed as a national cross-sectional online survey study, which is part of a larger research initiative (17, 19, 40) aimed at exploring the long-term impacts of SPT on HRQoL, employment, and healthcare interactions.
Study context
2.2
In general, individuals aged 20–49 in Sweden report similar HRQoL (41), while notable declines in physical health are observed in older age groups, particularly among those aged 80 and above. Significant age-related differences are also evident in mental health; however, older age groups, excluding the oldest (those aged 80 and above), report higher energy and emotional well-being. Additionally, individuals with a university education exhibit significantly higher HRQoL compared to those with only mandatory education. Employees have the highest HRQoL, whereas individuals on sick leave have the lowest. Finally, men in Sweden exhibit significantly higher HRQoL than women (41).
Life expectancy for women in Sweden is high in global comparison (84.3 years), and the maternal mortality rate is four deaths per 100,000 live births (42). Parental leave of up to 480 days per child, as well as healthcare, is tax-funded (43, 44). Gender differences in health reflect global trends, with men experiencing higher mortality rates, while women demonstrate greater morbidity and utilize healthcare services more frequently (45). Women are predominantly on sick leave for psychiatric and musculoskeletal conditions and exhibit higher sickness rates than men (46). The employment rate for women stands at 72.8%, with a substantial proportion employed in the healthcare and education sectors (47).
In Sweden, sexual and reproductive health services are predominantly delivered within the primary care sector. In contrast, childbirth care is almost exclusively hospital-based, with home births and freestanding birth centers representing exceptionally uncommon alternatives. Midwives autonomously manage care during normal pregnancies and uncomplicated births, whereas obstetricians are consulted in complicated cases (48, 49). As late as 2025, national guidelines for pelvic floor dysfunction were implemented in Sweden (50).
Participants and recruitment
2.3
The study involved adult women (18 years or older) proficient in understanding and speaking Swedish who had experienced third- or fourth-degree perineal lacerations at least 18 months before the data collection, irrespective of vaginal birth mode. Participants were selected without regard to the existence or seriousness of self-reported SPT-related health problems, as well as whether they had undergone reconstructive surgery or not. Conversely, women were not eligible if they were still on full-time parental leave after SPT or pregnant and were excluded if they experienced a stillbirth or perinatal death of the baby within 28 days postpartum at the time of the SPT.
A digital poster was disseminated through various online channels focusing on perineal health and pelvic floor functioning, including social media platforms such as Facebook, Instagram, and TikTok, as well as blogs and interest groups. Additionally, our department's social media account on Facebook contributed to this effort. The poster outlined the research project and linked to the project's homepage, which provided detailed written information on the project, contact information for the research team, and a link to the Research Electronic Data Capture (REDCap)-based (51, 52) questionnaire for participation.
Data collection
2.4
An online questionnaire was developed in Swedish. Study data were collected and managed using REDCap electronic data capture tools hosted at Umeå University (51, 52). REDCap is a secure, web-based software platform designed to support data capture for research studies, providing 1) an intuitive interface for validated data capture; 2) audit trails for tracking data manipulation and export procedures; 3) automated export procedures for seamless data downloads to common statistical packages; and 4) procedures for data integration and interoperability with external sources (51, 52). The questionnaire employed for data collection in this study, comprising eight sections and a total of 130 items, was designed to require approximately 30 min for completion (Figure 1). The initial sections gathered demographic data, lifestyle choices, and reproductive health information. The latter sections employed five validated instruments assessing HRQoL, symptoms, and bother from the pelvic floor, sexual functioning, and work ability. More specifically, HRQoL was assessed using a combination of instruments that evaluate HRQoL, such as the RAND 36-Item Health Survey 1.0 (53–55) (included in this paper), as well as condition-specific HRQoL instruments (not reported here). The questionnaire underwent pilot testing with two women facing SPT-related health problems and eight healthcare professionals at Umeå University, resulting in minor adjustments to the language and programming of the questionnaire. Public involvement in the research project played a crucial role in both study design regarding the content of the questionnaire and assistance during social media outreach for data collection. Participants were required to confirm their eligibility and provide written informed consent before accessing the questionnaire. Access was revoked for those who did not meet these criteria. Data collection occurred from November 20, 2023, to March 15, 2024, with two reminders on the same online channels issued after 2–3 weeks and an additional 4 weeks, respectively.
Overview of the questionnaire employed in the present study with consent being the only mandatory question. 1HRLQoL = health-related quality of life; 2Hays R, Sherbourne C, Mazel R. The Rand 36-item Health Survey 1.0. Health Econ. (1993) 2(3):217-27. doi: 10.1002/hec. 4730020305; 3Teleman P, Stenzelius K, Iorizzo L, Jakobsson U. Validation of the Swedish short forms of the pelvic floor impact questionnaire (PFIQ-7), pelvic floor distress inventory (PFDI-20) and pelvic organ prolapse/urinary incontinence sexual questionnaire (PISQ-12). Acta Obstet Gynecol Scand. 2011;90(5):483-7.; 4Lundin A, Leijon O, Vaez M, Hallgren M, Torgen M. Predictive validity of the Work Ability Index and its individual items in the general population. Scand J Public Health. 2017:45(4):350-6.
Outcome variable – HRQoL
2.4.1
The RAND 36-Item Health Survey 1.0 (RAND-36) (53–55) is one of the most widely utilized and validated patient-reported outcome measures assessing HRQoL globally. It consists of 36 items, selected from a broader set used in the RAND Medical Outcomes Study. It evaluates eight health concepts, as shown in Table 1, using multi-item scales, including physical functioning, role limitations due to physical and emotional health problems, social functioning, emotional well-being, energy/fatigue, pain, and general health perceptions. Additionally, it features a single item that assesses perceived changes in health over the past year. The scoring of RAND-36 involves a two-step process wherein a scoring key is initially applied to each item. Subsequently, these items are averaged to yield eight scale scores, each ranging from 0 to 100. Consequently, a higher score denotes a more favorable health status (53–55). Composite summary scores for physical and mental health (56) can be computed by aggregating their respective subscales into Physical Composite Summary (PCS) and Mental Composite Summary (MCS) scores, please see Table 1 and Supplementary Figure S1.
Based on previous Swedish findings (41), who presented Swedish reference data showing a mean average score of 66.9 (SD 23.5) for women in the domain “general health”, we hypothesized a decline of at least 7.0 (i.e., decline from 66.9 to 59.9 in mean score in general health representing a small to medium effect size) among women with long-term SPT-related health problems. To achieve an 80% power at a 5% significance level, a minimum of 178 participants were required. Accounting for a 10% dropout rate due to potentially missing data, we aimed to include approximately 197 participants in the final sample.
Potential predictor variables
2.4.2
Clinically and theoretically relevant independent variables were identified based on literature reviews and clinical expertise within the research group. The set of variables encompassed sociodemographic, obstetric, and occupational information relevant to HRQoL, as shown in Table 1. Nine categorical variables were included; education level, tobacco use, parity, degree of SPT (Supplementary Figure S2), reconstructive surgery, employment status, employment type, history of sick leave (>7 consecutive days requiring sick leave certificate from physician) in adult life, and level of physical activity compared to before SPT. Age, symptom bother from SPT, and total Work Ability Index (WAI) score were continuous variables, and their properties are also presented in Table 1.
Data analysis
2.5
A data analysis plan was outlined prior to initiation of data analysis and discussed with a statistician. Descriptive statistics are expressed as numbers (n) and their associated percentages. A missing data analysis revealed randomness in the missing data and a non-monotone pattern with 1.1% of values missing in total (Supplementary Data S1). Hence, missing data was addressed by applying a fully conditional specification multiple imputation (Markov chain Monte Carlo method) with five imputations (57).
The RAND-36 was scored by following the official scoring instructions provided by RAND Health Care® (58), as shown in Supplementary Figure S1. Unanswered items were excluded from this calculation, so the scale scores reflect the average of only those items that the respondent completed (54). The PCS score for physical health (56) was calculated by summing the subscale scores for physical functioning, role limitations due to physical health problems, pain, and general health perceptions, and then dividing by four. Similarly, the MCS score for mental health was derived by adding the scores for energy/fatigue, social functioning, role limitations due to emotional health problems, and emotional well-being, and dividing by four (56). A one-sample t-test was performed to evaluate whether the mean score of PCS and MCS differed from the reference population's mean PCS of 73.625 (SD = 29.45) and mean MCS of 71.7 (SD = 27.15). Data on Women’s mean RAND-36 scores in Sweden published by Ohlsson-Nevo et al. (41) were used as the reference population. Further, the raw mean RAND-36 scores in our sample were standardized by calculating T-scores, with a mean of 50 and a standard deviation of 10, to visualize the difference between the mean RAND-36 scores in our sample and those in the general population in Sweden (41). Floor and ceiling effects of the RAND-36 were also examined.
A multiple linear regression analysis was performed on the imputed dataset to identify predictors of PCS and MCS after SPT (59). The two models were constructed in a single block, with theoretically and clinically a priori identified sociodemographic, obstetric, and occupational predictors (Table 1). The models display adjusted unstandardized coefficients (B) with 95% confidence intervals. After fitting the models, assumptions in linear regression, i.e., linearity, homoscedasticity, independent and normally distributed errors and multicollinearity, were confirmed. We could not detect any multicollinearity between predictors. Further, as outliers and influential cases in the dataset were identified, a sensitivity analysis was conducted to test the robustness of the findings, where cases with high residuals and high leverage were excluded and models were adjusted for the same predictors. A dropout analysis (Supplementary Table S1) was ultimately performed, comparing participants who provided only background data with those included in the linear regression models, applying independent-samples t-test on continuous data and the Chi-Squared test or Fisher's Exact Test on categorical data (59).
Data were analyzed using IBM SPSS Statistics version 29, with statistical significance determined at p < 0.05. The paper complies with the STROBE (Strengthening the Reporting of Observational Studies in Epidemiology) guidelines for cross-sectional studies (60) (Supplementary Table S2). The authors utilized Copilot® and Grammarly® for language editing of the manuscript, subsequently reviewing and refining the content language wise, and thus, assume full responsibility for the publication's accuracy.
Ethical considerations
2.6
The research project received ethical approval from the Swedish Ethical Review Authority on August 28, 2023 (Dnr: 2023-04018-01) and adheres to the Declaration of Helsinki (61). Participation was voluntary, allowing individuals to withdraw at any time without needing to provide a reason. Participants gave written informed consent digitally before accessing the questionnaire, which included options to skip intimate questions. The questionnaire was anonymous, with no email or IP addresses collected, and no incentives were provided. Furthermore, the funding organizations were not involved in any aspect of the study's design, data management, analysis, or the preparation and submission of the manuscript.
Results
3
Study sample and demographics of study population
3.1
The link to the questionnaire was accessed by a total of 282 individuals, with 255 individuals proceeding beyond the consent form. The inclusion procedure for this study is shown in Figure 2. The final sample consisted of 221 participants.
Inclusion and exclusion process.
Table 2 provides an overview of the demographics of the total study population (n = 221), all identifying themselves as women. Most included women were born in Sweden (93.2%), had university-level education (81.9%), and cohabited with their partner (87.8%). Most women were employed (86.0%) or self-employed (4.1%), worked full-time (68.8%) and overall, the study population reported good work ability. Regarding obstetric properties, most women were multiparous (76.0%), and approximately one-third of the women sustained a fourth-degree perineal laceration (34.4%). On average, women had been living with SPT for 10.0 (SD 8.2; median 8.0, Q1−Q3: 4.0–13.0) years, and one third had pursued reconstructive surgery (30.3%). Based on self-reported symptom bother, the women were distributed evenly across three groups: mild (30.3%–31.7%), moderate (32.6%–33.9%), and severe symptom bother (34.8%–36.2%). The dropout analysis (Supplementary Table S1) revealed no significant differences in characteristics between women who dropped out and those who completed the questionnaire, except for the highest completed educational level. University-level education was overrepresented among included participants, and primary/secondary education was overrepresented among excluded participants.
Health-related quality of life
3.2
Table 3 depicts the RAND-36 score distribution across the 8 subscales, the health change (single item), and the two composite summary scores for physical and mental health (PCS and MCS). Participants scored the lowest on the subscale energy/fatigue [mean 46.9, SD (Standard deviation) 20.3, CI (Confidence interval) 95% 44.2–49.6] and the highest on physical functioning (mean 82.8, SD 19.8, CI 95% 80.1–85.4). The single-item health change was rather stagnant at 54.5 (SD 21.6; CI 95% 51.6–57.4), suggesting improvement in overall health status during the past year. The mean PCS score was 70.7 (SD 22.1, CI 95% 67.7–73.6), while the mean MCS score was 63.2 (SD 21.4; CI 95% 60.4–66.0). The mean PCS for women in our sample (M = 70.7, SD = 22.1) was significantly lower than in the reference population (41) of women in Sweden (M = 73.63, SD = 29.45), t [df (degrees of freedom) 220] = −1.99, p = 0.047, Cohen's d = 0.13. Similarly, the mean MCS in our sample of women (M = 63.2, SD = 21.4) was significantly lower than in the reference population (41) of women in Sweden (M = 71.7, SD = 27.15), t (df 220) = −5.90, p < 0.001, Cohen's d = 0.40. Additionally, our sample reported worse-than-average RAND-36 scores compared to the reference population (visualized in T-scores) across all RAND-36 subscales and composite summary scores except for physical functioning and pain. The data was predominantly skewed, and the dimensions of role limitations due to physical health and due to emotional problems displayed floor effects. Further, physical functioning, role limitations due to physical health, role limitations due to emotional problems, social functioning, and pain showed ceiling effects.
Predictors of RAND-36 physical and mental health
3.3
Physical health (PCS)
3.3.1
All five imputed multiple regression models with PCS as outcome were statistically significant (p < 0.001), explaining 63.0%–65.8% of the variance in PCS (see Table 4). The pooled multiple regression model depicted symptom bother from SPT, total WAI-score, education level, and level of physical activity as significant predictors of PCS. For every one unit in-crease in symptom bother from SPT, PCS decreased on average by 2.978 units. Further, for every one unit increase in total WAI-score (i.e., improved work ability), PCS increased on average by 1.167 units. Women with primary or secondary level education had, on average, 6.117 units lower PCS than women with university level education. Finally, women with lower level of physical activity than before SPT had, on average, 9.162 units lower PCS than women who remained physically active at the same level as before the SPT. These interpretations are accurate only if all other factors are held constant. The linear model of PCS remained stable after a sensitivity analysis excluding two influential cases, see Table 5.
Mental health (MCS)
3.3.2
All five imputed multiple regression models with MCS as outcome were statistically significant (p < 0.001), explaining 54.4%–58.8% of the variance in MCS, see Table 4. The pooled multiple regression model depicted age, symptom bother from SPT, total WAI score, and history of sick leave as significant predictors of MCS. However, in a sensitivity analysis excluding one influential case (Table 5), history of sick leave did not remain a significant predictor of MCS. For every one-year increase in age, MCS increased on average by 0.361 units. For every one unit increase in symptom bother, MCS decreased, on average, by 1.171 units. Further, for every one unit increase in total WAI-score (work ability), MCS increased on average by 1.641 units. These interpretations are accurate only if all other factors are held constant.
Discussion
4
This is the first study to provide a comprehensive analysis of the HRQoL and associated predictors among a population of women living with SPT in Sweden. Notably, our study population exhibited worse-than-average RAND-36 scores across most dimensions (apart from physical functioning and pain) as well as significantly lower physical and mental health compared to normative data for women in Sweden (41). This indicates that the consequences of SPT may negatively impact physical and mental health aspects for a substantial number of women with SPT. The average PCS score among the study participants was 70.7 (out of 100), in contrast to the mean MCS score of 63.2 (out of 100). Women with SPT exhibited the lowest scores regarding energy/fatigue, while achieving the highest scores on the physical functioning subscale. The assessment of health change over the past year remained relatively static, suggesting a slight trend towards improvement in overall health status. Factors significantly predicting physical health included the extent of symptom bother from SPT, increasing perceived work ability, educational attainment, and level of physical activity. Mental health was significantly predicted by increasing age, the extent of symptom bother from SPT, and increasing perceived work ability. If sick leave has an association with mental health remains unclear.
Notably, our sample scored lower (i.e., reported lower HRQoL) on all RAND-36 subscales than women with SPT participating in a UK study comparing RAND-36 scores based on severity of SPT (25). However, this study and other research on HRQoL among women with SPT using RAND-36 struggle with small sample sizes (16, 25, 36) and large drop-out rates (16, 25), making comparisons challenging and emphasizing the significant contribution of our study to the research field. Although our findings pertaining to physical health exhibited considerable robustness, sick leave no longer emerged as a statistically significant predictor of mental health after the sensitivity analyses. Consequently, this study is unable to draw definitive conclusions regarding the association between sick leave and mental health outcomes. Considering that individuals on sick leave in Sweden in general report low HRQoL (41), further research is warranted to elucidate the potential role of sick leave in influencing mental health after SPT.
Women with SPT in our study reported significantly lower mental health than the general population in Sweden (41). Further, they scored lowest on energy and fatigue, a finding that resonates with other research on HRQoL after SPT (16, 25, 36), suggesting that women experiencing SPT often endure fatigue and decreased overall vitality. Considering that our sample reported comparable physical functioning to the general population in Sweden (41), this suggests that women with SPT may receive adequate physical recovery measures from the Swedish healthcare system, such as reconstructive surgery, urotherapeutical treatment, or pelvic floor rehabilitation. However, the presence of reconstructive surgery did not demonstrate any significant association with mental or physical health outcomes in our sample. This raises the question of whether the surgical techniques currently employed are effective in mitigating symptoms following SPT. Consequently, further research is warranted to evaluate and optimize approaches to secondary repair. Nevertheless, low mental health scores in contrast to high scores in physical functioning point towards a nuanced health status characterized by functional capacity that does not necessarily align with overall well-being – a health status requiring more resources targeting mental health outcomes.
Interestingly, neither reconstructive surgery nor the degree of SPT was associated with mental or physical health in our sample, whereas self-assessed symptom bother from SPT and work ability both demonstrated significant predictive value for these domains. In this context, personal experiences of how SPT symptoms impact daily life or working life might play a more prominent role than the sole existence of symptoms and may have a significant bearing on overall well-being after SPT. Research has linked SPT to psychological consequences like depression, anxiety (7), shame, guilt, isolation (2, 5), and negative impact on relationships, such as to their partner (2, 5), children (5), and the broader social networks in daily life (2, 5) and at work (19). Our findings demonstrated that increased symptom bother from SPT was associated with poorer physical and mental health, despite high physical functioning scores−highlighting the significant role of personal experiences and mental health in overall well-being and HRQoL. Another shared predictive factor of physical and mental health was self-assessed work ability, indicating that those with higher work ability are likely to report better HRQoL. This further underscores the multifaceted aspects of living with SPT and accentuates the need to focus on the psychological impact of symptoms and coping as a critical component of care and rehabilitation for these women. Recovery could be facilitated by co-creation in care and rehabilitation with women with SPT in research, by incorporating a psychologist in the recovery process, and by enabling rehabilitation and return to work in collaboration with employers (8, 62).
Further, our sample assessed their health change over the past year as relatively static, suggesting minimal improvement in overall health status. Women in our sample had an average duration of living with SPT of approximately ten years. Research on postpartum HRQoL among women in general (9) indicates a decline in postpartum HRQoL over the first three years. Our sample reported lower RAND-36 subscale scores in all domains except emotional well-being than postpartum women in general during that timeframe (9). Combined with scoring significantly lower on overall physical and mental health than the general population in Sweden (41), our results might indicate a potential development of a chronic condition that may lead to cumulative effects on health and well-being. Especially as postpartum HRQoL appears to decline over time, and SPT is identified as a significant risk factor for decreased postpartum QoL (9). In this context, prevention of SPT represents a critical priority, both in clinic and research (63).
Moreover, a lower physical activity level after SPT was a significant predictor of reporting lower physical health in our sample. A large body of evidence exists on the positive effects of physical activity on mortality rates and QoL, especially for individuals with mental health conditions (64). However, the level of physical activity decreases for both women and men postpartum (65). In general, research has linked postpartum physical activity to reduced symptoms of depression (66), anxiety (67), and fatigue (68), as well as improved maternal sleep quality (69), well-being (66), and mental health (70). Nevertheless, evidence on physical activity among women with SPT is almost nonexistent, as women often report an impaired ability to exercise (71); this is also supported by our findings, in which 55.2% reported a lower level of physical activity than before SPT. Further, there is very limited evidence on how physical therapy and pelvic floor muscle training (72) might affect pelvic floor functioning and the ability to exercise after SPT. This suggests an urgent need to further investigate and facilitate the resumption of physical activity as a potential therapeutic avenue for women with SPT. In this context, rehabilitation programs should not only focus on pelvic floor training but also on the ability to pursue daily physical activity as part of treatment. Potentially, group-based physical activity (73) among women with SPT may increase postpartum physical activity levels and entail secondary positive outcomes, such as reduced social isolation. Hence, the benefit could be multidimensional as physical activity has also been shown to improve fatigue (68), which our sample of women scored lowest on.
Although the normative population (41) exhibit a higher mean age than the present study, participants in our sample reported lower HRQoL. This finding is noteworthy, as it underscores that many individuals in the study, despite having numerous years of potential active life ahead, might already be confronted with substantial health-related limitations. However, in our study, age was a significant predictor of mental health, where HRQoL scores increased with advancing age, contrasting with other research showing worse mental health in older adults (41). The increase in mental health scores may reflect greater resilience or the ability to cope developed over time as priorities and demands in daily life and working life shifts. This finding underscores the potential necessity to design age-appropriate, individualized interventions that cater to the specific needs and nuances of mental health in different generations of women living with SPT. However, further research is essential to elucidate the underlying dynamics behind these age-related differences in mental health and whether age as a predictor of mental health is isolated to our specific sample.
Strengths and limitations
4.1
A strength of the study is that we achieved a comparatively robust sample size despite the potentially sensitive nature of the topic. Moreover, our sample encompassed a spectrum of women reporting no symptom bother after SPT to those experiencing severe symptom bother, strengthening external validity. The use of a widely accepted and thoroughly validated instrument for measuring HRQoL (53–55) further strengthened the construct validity and reliability of this study. The standardization of scores presented as T-scores (74) facilitated comparison to the normative population, further enhancing the external validity of our findings.
However, there are sources of bias that need to be discussed. Our sample was predominantly composed of Swedish-born women with university-level education who cohabited with partners and were engaged in full-time employment, suggesting a considerable degree of socioeconomic stability in their lives, which may have introduced potential selection bias to the findings. Empirical evidence suggests that the presence of a supportive partner and robust social networks significantly contribute to individual well-being among middle-aged women (75). Therefore, research should expand beyond our cohort to include a more diverse range of participants, encompassing various ethnicities, educational backgrounds, and socioeconomic classes, which could facilitate a more in-depth understanding of HRQoL in women with SPT, especially in potentially vulnerable subgroups. Another potential selection bias was that approximately 30% of the women reported fourth-degree perineal laceration, contrasting with official Swedish reports (14, 76) that report an annual incidence of fourth-degree perineal laceration of 5%–10%, but the degree of perineal laceration was not associated with physical or mental health. The included data relies solely on patient-reported outcome measures (PROMs) collected via digital platforms. While PROMs provide valuable insights into subjective experiences, they are prone to information bias, including social desirability and recall bias (77), which may affect reliability. Moreover, the use of social media and patient organizations as recruitment channels may have disproportionately attracted individuals with particularly salient experiences, introducing information overload (78) and impacting the validity of results. To reduce the risk of information bias and strengthen the study's validity and reliability, validated instruments were incorporated into the questionnaire whenever feasible, except for background items. However, future research could benefit from incorporating objective health measures, derived from registers or medical records, alongside PROMs to improve the validity and reliability of results. The wide confidence intervals for some categorical predictors suggest caution in interpreting their associations with the outcome, highlighting the need for more precise measurement tools to improve reliability. Notably, significant ceiling effects were observed in the RAND-36 role limitation subscales, which limited the detection of variability among high-scoring participants−a limitation also reported in previous studies (41, 79). However, the use of composite summary scores in the regression model mitigated this issue, as they did not exhibit floor or ceiling effects. Floor and ceiling effects underscore the potential value of alternative scoring methods for RAND-36, such as item response theory (74), and the use of condition-specific QoL instruments to better capture HRQoL following SPT.
Conclusions
5
This study offers the first comprehensive assessment of HRQoL in women with SPT. Women with SPT reported significantly lower HRQoL compared to the general female population in Sweden, particularly in mental health domains. The results highlight the intricate interplay between physical symptoms and psychological well-being, underscoring the need for comprehensive care approaches. Personal experiences and perceived impact on daily life may be more influential than clinical aspects alone. The identification of vulnerable subgroups underscores the need for tailored multidisciplinary care strategies that address both physical and psychological recovery. Future research should further explore socioeconomic and occupational factors to inform equitable and effective health outcomes. Barriers and facilitators, especially the role of sick leave, influencing HRQoL in this population, need further investigation to enhance HRQoL and support the reintegration of women with SPT into their social and professional spheres.
The reference list from the paper itself. Each links out to its DOI / PubMed record.
- 1Socialstyrelsen [The National Board of Social Affairs and Health]. Internationell statistisk klassifikation av sjukdomarch och relaterade hälsoproblem, systematisk förteckning, Svensk version 2025, Del 2 (3) H–P [International Statistical Classification of Diseases and Related Health Problems, Swedish version 2025, Part 2 (3) H–P]. (2025). Available online at: https://www.socialstyrelsen.se/statistik-och-data/klassifikationer-och-koder/icd-10/ (Accessed December 30, 2025)
- 2Darmody E Bradshaw C Atkinson S. Women’s experience of obstetric anal sphincter injury following childbirth: an integrated review. Midwifery. (2020) 91:102820. 10.1016/j.midw.2020.10282032861872 · doi ↗ · pubmed ↗
- 3La Cross A Groff M Smaldone A. Obstetric anal sphincter injury and anal incontinence following vaginal birth: a systematic review and meta-analysis. J Midwifery Womens Health. (2015) 60(1):37–47. 10.1111/jmwh.1228325712278 · doi ↗ · pubmed ↗
- 4Samarasekera DN Bekhit MT Wright Y Lowndes RH Stanley KP Preston JP Long-term anal continence and quality of life following postpartum anal sphincter injury. Colorectal Dis. (2008) 10(8):793–9. 10.1111/j.1463-1318.2007.01445.x 18266886 · doi ↗ · pubmed ↗
- 5d’Almeida I. Women’s experiences following obstetric anal sphincter injury. J Pelvic Obstet Gynaecol Physiother. (2020) 127:39–50. Available online at: https://thepogp.co.uk/journal/10/pogp_journal_issue_127_autumn_2020/15/
- 6Andreucci CB Bussadori JC Pacagnella RC Chou D Filippi V Say L Sexual life and dysfunction after maternal morbidity: a systematic review. BMC Pregnancy Childbirth. (2015) 15:307. 10.1186/s 12884-015-0742-626596506 PMC 4657322 · doi ↗ · pubmed ↗
- 7Keighley MR Perston Y Bradshaw E Hayes J Keighley DM Webb S. The social, psychological, emotional morbidity and adjustment techniques for women with anal incontinence following obstetric anal sphincter injury: use of a word picture to identify a hidden syndrome. BMC Pregnancy Childbirth. (2016) 16(1):275. 10.1186/s 12884-016-1065-y 27654450 PMC 5031357 · doi ↗ · pubmed ↗
- 8Crookall R Fowler G Wood C Slade P. A systematic mixed studies review of women’s experiences of perineal trauma sustained during childbirth. J Adv Nurs. (2018) 74(9):2038–52. 10.1111/jan.1372429791012 · doi ↗ · pubmed ↗