Precision Medicine in Plant Food Allergy: a Systematic Review of Biomarkers Under a Clinical Approach
M. L. Somoza, E. Nuñez-Borque, I. M. Sánchez-Guerrero, O. Uriel, E. Marchan, M. Belver, A. Ruiz-Sánchez, R. Jiménez-Saiz, M. J. Goikoetxea

TL;DR
This review examines biomarkers for plant food allergies, highlighting their role in precision medicine and the need for more diverse and validated research.
Contribution
The paper provides a systematic review of biomarkers in plant food allergy, emphasizing gaps and opportunities for precision medicine.
Findings
Most studies focused on peanut, nuts, and wheat, with limited representation of fruits and seeds.
Specific IgE to whole extracts or molecular components were the most common biomarkers.
Emerging biomarkers show promise but require further validation for clinical use.
Abstract
Plant food allergy (FA) is a major global health problem, being peanut one of the most studied allergenic foods worldwide. Biomarkers (Bms) are essential tools for precision medicine, guiding diagnosis, risk stratification, and treatment. However, evidence on their clinical applicability in plant FA remains limited and fragmented. Therefore, we aim to systematically review the Bms identified in plant FA related to several aspects of the pathology. This systematic review was performed in accordance with the PRISMA guidelines. A comprehensive search was conducted in three databases (PubMed, Web of Sciences and Cochrane Library) between July 2019 and July 2024. Articles were screened using predefined inclusion and exclusion criteria, and categorized into five thematic sections: sensitization, tolerance, threshold, severity and follow-up treatment. Risk-of-bias and certainty of evidence…
Genes, proteins, chemicals, diseases, species, mutations and cell lines named across the full text — each resolved to its canonical identifier and authoritative record.
Click any figure to enlarge with its caption.
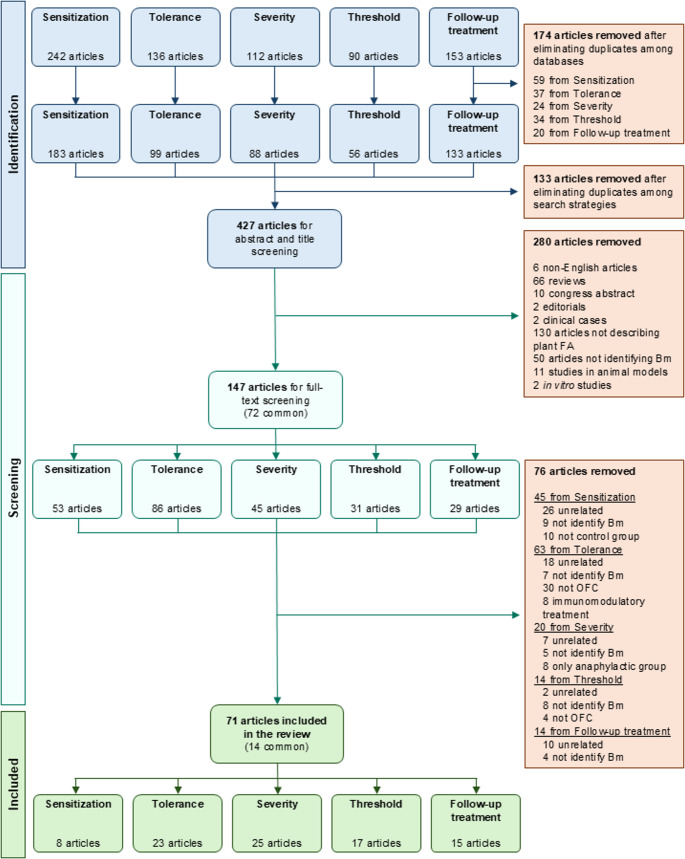 Figure 1
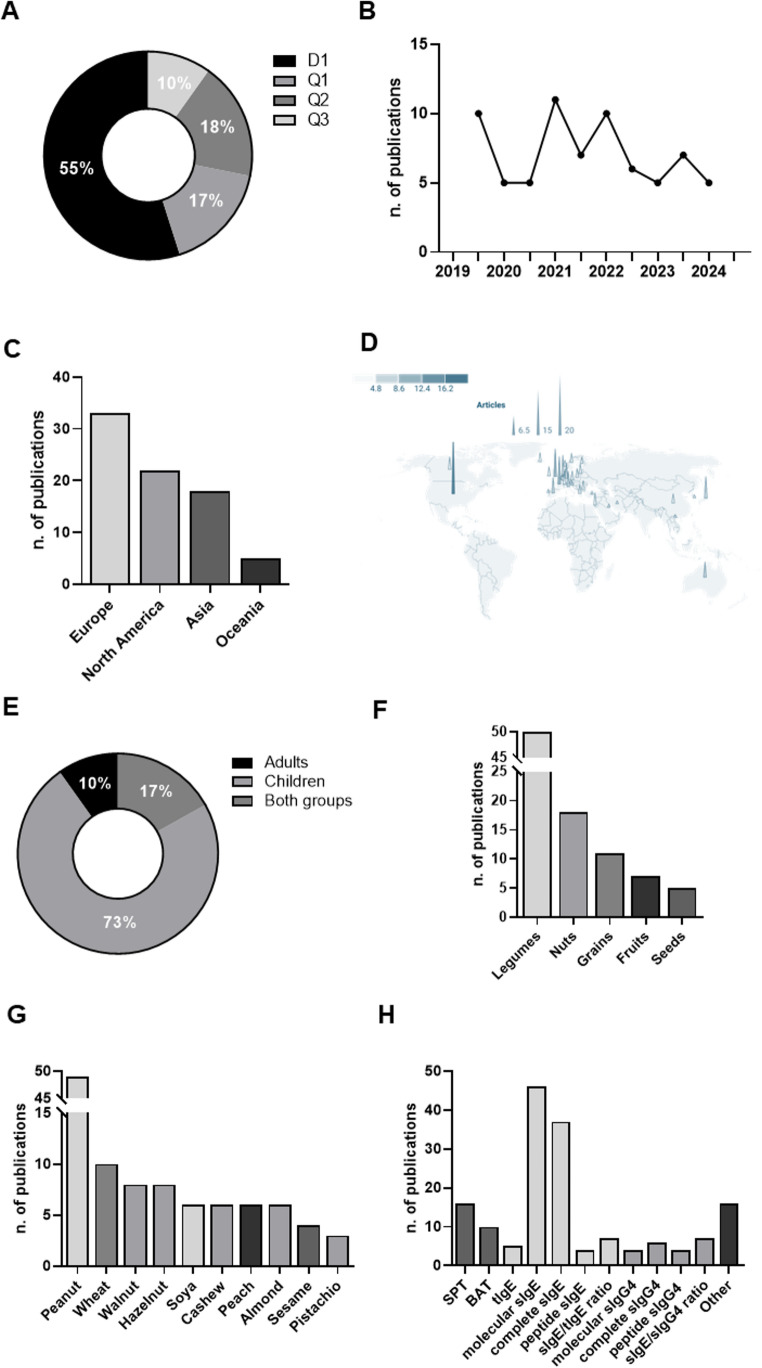 Figure 2
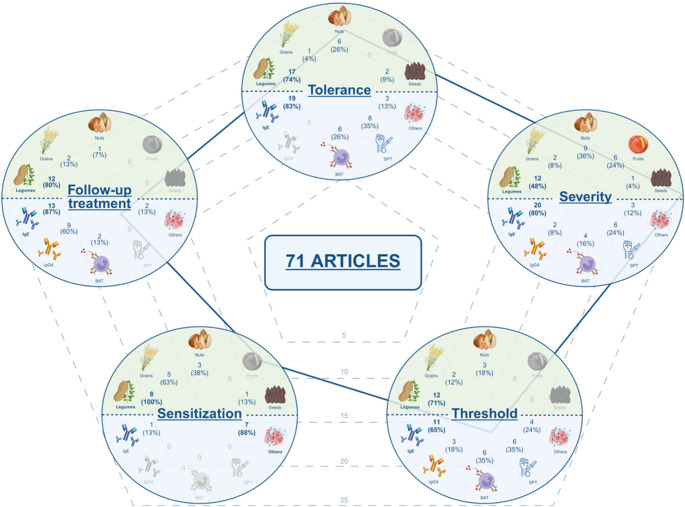 Figure 3
- —Universidad Alfonso X El Sabio
Peer Reviews
No public reviews on file for this paper yet. If you reviewed it on a platform where reviews are public (OpenReview, ICLR, NeurIPS, ICML), you can paste yours below so the community can read it here.
Videos
No videos yet. Explain this paper in a talk, walkthrough, or lecture? Add one.
Taxonomy
TopicsFood Allergy and Anaphylaxis Research · Allergic Rhinitis and Sensitization · Eosinophilic Esophagitis
Introduction
Precision medicine is an evolving strategy that incorporates individualized assessments for disease prevention and personalized treatment [1]. The application of biomarkers (Bms) to clinical practice allows patients to be stratified into different risk levels, identifying how to manage them more optimally. Currently, significant progress has been made in characterizing Bms to define asthma endotypes, prompted by the increasing availability of biologics [2]. However, evidence about precision medicine in food allergy (FA) is scarce, focusing mainly on the triggers of FA development, severity, tolerance or immunotherapy response [3].
Plant FA is a main problem world-wide, and specially peanut allergy due to its high prevalence, its increasing incidence and its association with severe reactions [4, 5]. Beyond peanuts, there are other relevant plant-food allergens showing high prevalence in some regions, such as fruits, vegetables, legumes and cereals [6, 7]. Clinical guidelines recommend using some Bms, such as specific IgE (sIgE) to Ara h 2, Cor a 14 or Ana o 3, to predict tolerance based on extensive research performed in plant-food allergic patients frequently sensitized to storage proteins [8, 9]. However, other patterns have been described across the world: from the typically mild and localized pollen allergy syndrome, to the heterogenic lipid transfer protein allergy, which can manifest from mild to severe symptoms, very often unpredictably and conditioned by cofactors [10, 11]. In this scenario, the predictors of tolerance and severity are related to the patient’s sensitization profile and, therefore, could be heterogeneous across different populations.
The component-resolved diagnosis (CRD) in FA contributes to endotype patients by identifying specific molecular sensitization patterns linked to different clinical expressions, discriminating between primary allergies and cross-reactivity syndromes [12]. Nevertheless, CRD has limitations when it comes to comprehensively addressing the responses for FA patients, as variability has been observed between populations in the serotypes of different patient cohorts [13]. Moreover, the development of CRD has mainly focused on a restricted panel of food allergens [14]. It is important to note that the identification of new Bms does not always imply their direct clinical implementation worldwide due to economic and logistic barriers. Similarly, this also applies to other diagnostic approaches, as well as basophil activation test (BAT) [15] or allergic mediators (interleukins) and cells (mainly B and CD4 T cells) [16, 17], which may require costly equipment and highly trained personnel.
Even more, new drugs and approaches are emerging for plant FA management, which requires adaptation to each patient. Therefore, Bms of indication, treatment monitoring and efficacy must be characterized. Once again, efforts are mainly focused on peanut allergy, hoping this path can serve as a guide for other FA treatments [18]. However, other plant food-based therapies are still far from those developed against peanut allergy [19, 20].
Beyond the main challenges of precision medicine in FA, and focusing specifically on the needs of clinical practice, there are other aspects—in addition to predicting severity, tolerance, or treatment monitoring—that must be considered to fully characterize the diagnosis of allergic patients to plant foods. To perform a real precision medicine in daily clinical practice, Bms should provide information on the following clinical questions: (i) how FA sensitization is developed; (ii) the prediction of the clinical relevance of sensitization; (iii) the determination of susceptibility to severe reactions or symptoms; (iv) the high/low or certain threshold at which reactions occur; and (v) the monitoring of responses to allergen immunotherapy or immunomodulatory drugs. Therefore, we aim to systematically review the Bms identified in plant FA related to these aspects of the pathology.
Methods
Search Strategy
This systematic review was performed in accordance with the PRISMA guidelines [21]. The selection of articles was limited to manuscripts published between July 2, 2019, and July 2, 2024. The search was carried out across three databases (PubMed, Web of Science, and Cochrane Library) and structured in five thematic sections using a common set of terms, combined with keywords specific to each section: “sensitization”, “tolerance”, “threshold”, “severity” and “follow-up treatment” (Supplementary Table 1).
Inclusion and Exclusion Criteria
All studies included in this review were selected based on a set of general inclusion and exclusion criteria, applicable to all sections. Eligible studies (including research articles, short communications, or letters to the editor) were required to present original human data, be written in English, identify Bms, and show statistically significant association with plant FA. Exclusion criteria were studies on eosinophilic esophagitis; allergies to non-plant food allergens; clinical investigations that did not involve Bm identification; publications in languages other than English; case reports, conference abstracts, preprints, or review articles; and studies conducted in animal models or human ex vivo material (cells or tissues).
In addition to these general considerations, the five thematic sections were assessed using the following specific eligibility criteria:
For the “sensitization” section, studies about Bm predicting plant food-sensitization acquisition were included. These involve patients with confirmed sensitization regardless of whether oral food challenge (OFC) tests were performed. Controls were required to be non-sensitized individuals. Studies comparing allergic vs tolerant sensitized patients and those focusing on sensitization to specific allergens (i.e., Ara h 2 sIgE) were excluded because they do not directly reflect Bms of sensitization development.
For the “tolerance” section, articles about prediction of clinical reactivity were considered. Only studies involving plant food-allergic patients with diagnosis confirmed through medically supervised OFC (open-label, single- or double-blind) were included, excluding longitudinal prediction of future tolerance. The control group did not apply in this section, since all the studies compared subjects with positive vs negative OFC.
For the “severity” section, studies regarding the susceptibility to present severe reactions were considered. These studies compare plant food-allergic individuals who had experienced systemic or anaphylactic reactions with those who had only local or mild symptoms. Articles focusing exclusively on acute-phase anaphylaxis or on populations composed solely of anaphylactic patients were excluded, as the focus was on identifying baseline Bms of susceptibility to severe reactions. Articles showing at least two groups of patients with different levels of severity were considered.
For the “threshold” section, studies on different threshold levels were included. Specifically, articles in which plant food-allergic patients were challenged under medical supervision with clearly reported subjective or objective threshold doses were considered. Studies that did not confirm allergy through OFC or that presented data collected after immunomodulatory treatment (i.e., immunotherapy) were excluded.
For the “follow-up treatment” section, studies about the response to treatments were included. Patients undergoing validated or non-validated treatments were considered: probiotics, biologic agents, epicutaneous immunotherapy (EPIT) or oral immunotherapy (OIT). Participants had to be characterized at baseline to allow for the evaluation of associations between parameters and treatment efficacy. The definition of efficacy was interpreted broadly and could include desensitization, even without assessment of sustained unresponsiveness.
Analysis of the Articles Included in the Review
All publications retrieved through the various search strategies were exported. Duplicates across the three databases and the five thematic sections were identified and removed. Subsequently, two authors (ENB and RJS) independently screened the titles and abstracts and discarded those that did not fulfill the inclusion criteria. Discrepancies were resolved by a third reviewer (MJG).
Once the final list of included studies was established, two additional reviewers (MJG and MLS) independently re-evaluated the titles and abstracts to reassign each article to the appropriate thematic section. The full text of each article was then independently peer-reviewed to confirm its inclusion in the systematic review. Specifically, the “sensitization” section was reviewed by MLS and MB; the “tolerance” section by OUV and IMSG; the “threshold” section by MB and MJG; the “severity” section by MJG, MLS and EM; and the “follow-up treatment” section by EM and MLS. All the reviewers of the final list were practicing allergists to keep the clinical perspective of the analysis.
For each included article, the following data were extracted: journal (position in its area of knowledge, impact factor, and subject area), year of publication, country, pathology studied (condition, physiological state or associated therapeutic intervention), characteristics of the study population (mean age, sample size and control group), description of the Bm (name, type—predictive, follow-up, treatment response, prognostic or susceptibility—, detection technique, and units of measure), and evidence of association (positive or inverse).
Biomarker Analysis
Bms were considered when the same measurable item was similarly evaluated in the identical food allergen. For the analysis of specific peptides, when ≥ 3 epitopes were measured using the same assay (i.e., epitope microarray) the panel was considered as a single Bm according to their association. Models studying more than one different Bm together were not considered. Concerning skin prick test (SPT), it was included as a Bm only if the authors described the technique and positive criteria used in the methods section. The type of Bm was considered following FDA-NIH Bm working group classification [22].
Bms were included when a significant association with FA was observed. Association was defined as positive when the presence of allergy, higher eliciting dose, or severity were associated with the Bm; and inverse when the absence of allergy (tolerance), lower eliciting doses, or severity grade were associated with the Bm. Regarding the sensitization and follow-up treatment sections, a positive association was defined as an increase in Bm levels (compared to non-sensitized group, baseline or progressively along procedures) related to a good intervention efficacy, while an inverse association was a decrease in Bm levels related to sensitization or good intervention efficacy.
Risk-of-bias and Certainty Assessment
The risk-of-bias and the certainty of the articles were measured using a hybrid strategy combining artificial intelligence (AI) tools (conducted by ENB and RJS) with human evaluations from the reviewers (MJG, MLS, OUV and IMSG). For this purpose, an automated process based on a large-scale language model (OpenAI GPT-4) was implemented [23], which extracted the relevant methodological information directly from the article text. This approach ensures an objective initial extraction of parameters, reducing human bias and improving the transparency and reproducibility of quality assessment.
The risk-of-bias assessment was performed by programming the AI to classify each article according to its design. After this, a risk-of-bias tool was applied according to the type of study identified [24, 25]: Risk-Of-Bias In Non-randomized Studies of Interventions (ROBINS-I) for non-randomized studies; Appraisal tool for Cross-Sectional Studies (AXIS) for cross-sectional studies; Quality Assessment of Diagnostic Accuracy Studies (QUADAS-2) for studies of diagnostic accuracy; and Cochrane tool for assessing risk-of-bias in randomized trials (Rob2) for randomized trials. Tables were generated for each article with detailed assessments and an overall evaluation of the risk of bias, always based on the data explicitly reported in the publications.
The Grading of Recommendations Assessment, Development and Evaluation (GRADE) system was used to assess the certainty of the evidence [26]. For each article, the following aspects were considered: risk of bias, inconsistency, imprecision, indirectness and publication bias, as well as a general classification of certainty.
All the evaluations performed by the AI were subjected to peer review by MJG, MLS, OUV and IMSG; and any discrepancies were resolved by consensus, to ensure the coherence, transparency and methodological soundness of the process.
Results
The initial search identified a total of 733 studies. After removing duplicates across the various databases and search strategies, 427 unique articles were retained. Titles and abstracts were peer-reviewed, leading to the exclusion of 280 studies. At this stage, the main reasons for exclusion were the type of publication (e.g., reviews, case reports or editorials), unrelatedness to plant FA, and absence of Bm identification. The remaining 147 articles were assigned to the five predefined thematic sections, and their full texts were peer-reviewed. During this in-depth review, 76 additional articles were excluded, mainly due to the absence of Bm identification, lack of alignment with the objective of the respective thematic section, or issues related to the control group when applied (e.g., absence of OFC or control group, inclusion of patients undergoing immunotherapy, or inclusion of only anaphylactic cases). Ultimately, 71 articles were selected for data extraction (Fig. 1).
Fig. 1. Study selection process. From an initial pool of 733 articles, duplicates were removed, resulting in 427 unique references. After peer review of titles and abstracts, 147 articles were selected, with 72 of them overlapping across multiple thematic sections. Following full-text review, a total of 71 studies were included for data extraction, with 14 of them overlapping among different thematic sections (11 commons between 2 sections, and 3 commons among 3 sections). Biomarker, Bm; Food allergy, FA; Oral food challenge, OFC
Characteristics of the Studies
Among the 71 articles included, 72% (n = 51) were published in journals ranked in the first quartile of their respective categories (Journal Citation Report). Of these, 39 were in the first decile, reflecting a high level of quality and scientific relevance (Fig. 2A). The overall mean impact factor of the included articles was 8.6. In terms of subject areas, most publications fell under the categories of Allergy (n = 64) and Immunology (n = 58), followed by Pediatrics (n = 5) and other categories (n = 5), such as Nutrition & Dietetics, Food Science & Technology, Environmental Sciences, and Medicine,* General & Internal*.
Fig. 2. Characteristics of the 71 studies included in the review. (A) Distribution of articles by journal quartile. D1: first decile (top 10% of most cited journals in its category); Q1: first quartile (top 25%); Q2: second quartile (25 to 50%); Q3: third quartile (50% to 75%). (B) Number of articles published by six-month intervales, from July 2, 2019, to July 2, 2024. (C) Number of studies by continent of origin. Some articles included populations from multiple continents (n = 5). (D) Geographical distribution of studies by country. The size and color of each spot indicate the number of studies. Some studies included patients from multiple countries (n = 12). United States (n = 20); France (n = 9); United Kingdom (n = 9); Japan (n = 7); Netherlands (n = 7); Australia (n = 5); Germany (n = 5); Italy (n = 5); Spain (n = 5); Canada (n = 4); Israel (n = 4); Switzerland (n = 4); Bulgaria (n = 3); China (n = 3); Czech Republic (n = 3); Greece (n = 3); Iceland (n = 3); Ireland (n = 3); Lithuania (n = 3); Poland (n = 3); Sweden (n = 3); Finland (n = 2); Luxembourg (n = 2); Norway (n = 2); Austria (n = 1); Belgium (n = 1); Denmark (n = 1); Iran (n = 1); Kuwait (n = 1); Portugal (n = 1); Slovenia (n = 1); South Korea (n = 1); Turkey (n = 1); Vietnam (n = 1). Image created with Datawrapped.com. (E) Distribution of articles by the age group of the study population. Children are defined as individuals under 18 years old; adults are 18 years old or older. (F) Number of studies by plant food source. Some studies included multiple plant food sources (n = 10). Legumes: peanut and soya; Nuts: walnut, hazelnut, cashew, almond, and pistachio; Grains: wheat; Fruits: peach; Seeds: sesame. (G) Number of studies by specific plant food source. Some studies evaluated multiple sources (n = 13). (H) Number of studies by Bm type. Some studies assessed more than one Bm (n = 44). Skin prick test, SPT; basophil activation test, BAT; specific IgE, sIgE; total IgE, tIgE; specific IgG4, sIgG4
Despite the recognized importance of identifying effective Bms for plant FA, no consistent increase in the number of publications was observed between July 2019 and July 2024 (Fig. 2B). Geographically, most studies were conducted in Europe, followed by North America, Asia, and Oceania. No studies were identified from South America, Africa or Antarctica (Fig. 2C). The most represented countries were the United States of America (USA, n = 10), France, United Kingdom (n = 9), Japan, Netherlands (n = 7), Australia, Germany, Italy, and Spain (n = 5) (Fig. 2D).
Most of the included studies were conducted in pediatric populations (n = 52). In contrast, only a small number of studies included both children and adults (n = 12), while a minority focused exclusively on adults (n = 7) (Fig. 2E). In terms of the plant food groups evaluated, legumes (peanut and soy) were the most studied, followed by nuts (walnut, hazelnut, cashew, almond, and pistachio), grains (wheat), fruits (peach) and seeds (sesame) (Fig. 2F). Considering specific foods, peanut was the most frequently investigated, followed, although to a lesser extent, by wheat, hazelnut and walnut (Fig. 2G).
On the other hand, sIgE against both whole extracts and molecular components was the primary parameter analyzed across the included studies, underscoring the central role of this Bm in the diagnosis of FA. SPT and BAT were also widely used. Additionally, although less frequently, other Bms were assessed, such as sIgG4, peptide sIgE levels, and various ratios: sIgE to total IgE (tIgE) and sIgG4 to sIgE. Finally, a large and heterogeneous group of emerging Bms, still in the validation phase (n = 16), was identified: including proteins (n = 5), cellular platforms (n = 3), metabolites (n = 3), studies on other clinical parameters (n = 2), microbiota (n = 2), exhaled nitric oxide (FeNO, n = 1) and genetic factors (n = 1) (Fig. 2H).
Sensitization
Despite efforts in recent years to identify risk factors for food allergies and to implement preventive measures in the general population, the number of articles included in the sensitization section has been surprisingly low, as most of the studies evaluated the development of allergy rather than sensitization, and only few of them identified clear Bms. We included a total of eight articles about Bms predicting plant food-sensitization acquisition where a total of 12 Bms were identified from 7,279 subjects (Table 1). Four studies were performed in America (50%) [27–30], three in Europe (37.5%) [31–33] and one in Asia (12.5%) [34]. All of them, except one [30], included pediatric subjects, and most of the articles were cohorts analyzed at predetermined time periods (62.5%) [27, 29, 31–33].
Table 1. Studies about biomarker (Bm) predicting plant food-sensitization acquisition (n = 8). Italics* indicate the specific study population for that Bm within the total cohort. A positive association is related to an increase in the Bm according to the pathology/condition evaluated, while an inverse association is linked to a decrease in the BmARTICLESTUDIED POPULATIONBIOMARKERFoodReferenceYear of publicationCountry^1^Sample sizeAgeRange^2^Control groupPathology/Condition^3^Name^4^TypeDiagnostic technique (manufacturer)Units^5^Association Almond Tran et al. [34]2024Vietnam11025.9 months (mean)13.1 (SD)YesFood sensitizationSCHPredictiveGPSkin Barrier Pro device (Gpower Inc.)AUInverse Peanut Tsilochristou et al. [32]2019United Kingdom681NANAYesFood sensitizationS. aureus colonizationPredictiveBacteria culture+/-PositiveTran et al. [34]2024Vietnam11025.9 months (mean)13.1 (SD)YesFood sensitizationSCHPredictiveGPSkin Barrier Pro device (Gpower Inc.)AUInverseGoleva et al. [28]2020USA84 11.5 years (mean)*
10.3–15.3 (SD)* YesFood sensitizationPC1 proteinsPredictiveProteomic analysisNDPositiveRan et al. [30]2024USA 229* 46 years (mean)32–63 (IQR)YesFood sensitizationurine metals: Lead (Pb)PredictiveMass spectrometry (ICP-MS)LODPositivePeanut,** walnut**,** soya**,** wheatLee-Sarwar et al. [29]2019USA779NANAYesFood sensitizationω3 PUFAsPredictiveMetabolon (Research Triangle Park)NDInverseTotal PUFAsPredictiveMetabolon (Research Triangle Park)NDInverseω6 PUFAsPredictiveMetabolon (Research Triangle Park)NDInversePeanut**,** wheatTedner et al. [33]2021Norway, Sweden2220NANAYesFood sensitizationsIgEPredictiveImmunoCAP (ThermoFisher)kUA/LPositivePeanut**,** wheat**,** soyaWärnberg Gerdin et al. [31]2022Norway, Sweden2805NANAYesFood sensitizationTEWLPredictiveOpen-chamber DermaLab USB (Cortex)g/m2/hPositiveLee-Sarwar et al. [27]2023USA371NANAYesFood sensitizationFecal caffeine metabolitePredictiveMetabolon (Research Triangle Park)NDPositiveFecal sphingolipid metabolitesPredictiveMetabolon (Research Triangle Park)NDPositiveFecal bilirubin metabolitePredictiveMetabolon (Research Triangle Park)NDInverseWheat**,** soya**,** almond**,** walnut**,** hazelnut**,** cashew**,** sesame**Goleva et al. [28]2020USA84 11.5 years (mean)*
10.3–15.3 (SD)* YesFood sensitizationPC1 proteinsPredictiveProteomic analysisNDPositive^1^USA United States of America. ^2^*IQR *Interquartile range, SD Standard deviation. ^4^PUFAs Polyunsaturated Fatty Acids, PC1 Principal component 1, sIgE Specific IgE, SCH Stratum corneum hydration, TEWL Trans-epidermal water loss. ^5^AU Arbitrary units, LOD Limit of detection. NA Not applicable, ND Not determined
Most of the studies included atopic dermatitis subjects (50%) [28, 31, 32, 34], three of them studied diet/fecal characteristics (37.5%) [27, 29, 30] and one of them evaluated genetic factors (12.5%) [33]. Similarly, most of the studies analyzed multiple food allergen sensitization at the same time (62.5%) [27–29, 31, 33], while three articles were related exclusively to peanut (37.5%) [30, 32, 34] and one to almond (12.5%) [30].
Tolerance
Tolerance was the second section with most articles, with 45 Bms identified from 23 studies based on 3,176 patients (Table 2). Eleven studies were conducted in Europe (47.8%) [35–45], seven in Asia (30.4%) [46–52], four in America (17.4%) [37, 53–55], two in Australia (8.7%) [56, 57] and three were transcontinental (13%) [36, 37, 54]. Specifically, the Netherlands was the most frequent country (17.4%) [35, 40, 41, 45], followed by the United Kingdom (13%) [36, 37, 39].
Table 2. Studies regarding prediction of clinical reactivity (n = 23). Italics* indicate the specific study population for that biomarker (Bm) within the total cohort. A positive association is related to an increase in the Bm according to the pathology/condition evaluated, while an inverse association is linked to a decrease in the BmARTICLESTUDIED POPULATIONBIOMARKERFoodReferenceYear of publicationCountry^1^Sample sizeAgeRange^2^Control groupPathology/Condition^3^Name^4^TypeDiagnostic technique (manufacturer)Units^5^Association Cashew Santos et al. [36]2021United Kingdom, Switzerland, Italy925.1 years (median)3–9 (IQR)NAAllergy (OFC +)Cashew SPTPredictiveCommercial extract (Stallergenes)mmPositiveCashew sIgEPredictiveImmunoCAP (ThermoFisher)kUA/LPositiveAna o 3 sIgEPredictiveImmunoCAP (ThermoFisher)kUA/LPositiveCashew BATPredictiveBAT (Flow-CAST)%PositiveCetinkaya et al. [46]2021Turkey 52*
61.18 months (median)*
42.21–104.53 (IQR)* NAAllergy (OFC +)Cashew SPTPredictiveSPT (Homemade extract)mmPositiveCashew sIgEPredictiveImmunoCAP (ThermoFisher)kUA/LPositiveCashew sIgE/tIgEPredictiveImmunoCAP (ThermoFisher)NAPositiveRöntynen et al. [38]2022Finland1105.04 years (median)1.41–16.66 (min-max)NAAllergy (OFC +)Cashew SPTPredictiveSPT (ALK extract)mmPositiveCashew sIgEPredictiveImmunoCAP (ThermoFisher)kUA/LPositiveAna o 3 sIgEPredictiveImmunoCAP (ThermoFisher)kUA/LPositiveCashew BATPredictiveBAT (Flow-CAST)%Positive Hazelnut Santos et al. [36]2021United Kingdom, Switzerland, Italy925.1 years (median)3–9 (IQR)NAAllergy (OFC +)Hazelnut SPTPredictiveCommercial extract (Stallergenes)mmPositiveHazelnut sIgEPredictiveImmunoCAP (ThermoFisher)kU/LPositiveCor a 1 sIgEPredictiveImmunoCAP (ThermoFisher)kU/LPositiveCor a 9 sIgEPredictiveImmunoCAP (ThermoFisher)kU/LPositiveCor a 14 sIgEPredictiveImmunoCAP (ThermoFisher)kU/LPositiveHazelnut BATPredictiveBAT (Flow-CAST)%PositiveDuan et al. [54]2021Canada, Austria 107* 8.5 years (mean)4.6–12.3 (IQR)NAAllergy (OFC +)Cor a 14 sIgEPredictiveImmunoCAP (Thermo Fisher)kU/LPositiveHazelnut BATPredictiveBAT (Flow-CAST)%PositiveInoue et al. [47]2020Japan917.3 years (median)5.9–10.5 (IQR)NAAllergy (OFC +)Alder sIgEPredictiveImmunoCAP (ThermoFisher)kUA/LInverseCor a 1 sIgEPredictiveImmunoCAP (ThermoFisher)kUA/LInverseCor a 9 sIgEPredictiveImmunoCAP (ThermoFisher)kUA/LPositive Peanut Ehlers et al. [35]2021Netherlands1235.6 years (mean)27–63 (min-max)NAAllergy (OFC +)VH3 family genes in peanut 2 S albumin-specific B cellsPredictiveData sequence%Positive4 HCDR3 sequence motifs in peanut 2 S albumin-binding B cellsPredictiveData sequence%Positive3 HCDR3 sequence motifs in peanut 2 S albumin-binding B cellsPredictiveData sequence%InverseSantos et al. [36]2021United Kingdom, Switzerland, Italy925.1 years (median)3–9 (IQR)NAAllergy (OFC +)Peanut SPTPredictiveCommercial extract (Stallergenes)mmPositivePeanut sIgEPredictiveImmunoCAP (ThermoFisher)kUA/LPositiveAra h 1 sIgEPredictiveImmunoCAP (ThermoFisher)kUA/LPositiveAra h 2 sIgEPredictiveImmunoCAP (ThermoFisher)kUA/LPositiveAra h 3 sIgEPredictiveImmunoCAP (ThermoFisher)kUA/LPositivePeanut BATPredictiveBAT (Flow-CAST)%PositiveAra h 1 BATPredictiveBAT (Flow-CAST)%PositiveAra h 2 BATPredictiveBAT (Flow-CAST)%PositiveAra h 6 BATPredictiveBAT (Flow-CAST)%PositiveSantos et al. [37]2020United Kingdom, USA981ND5–6 (min-max)NAAllergy (OFC +)Peanut BATPredictiveBAT (Flow-CAST)medianPositiveKaur et al. [56]2021Australia2228 years (median)5–12 (IQR)NAAllergy (OFC +)Ara h 1 sIgEPredictiveImmunoCAP (ThermoFisher)kUA/LPositiveAra h 2 sIgEPredictiveImmunoCAP (ThermoFisher)kUA/LPositiveAra h 6 sIgEPredictiveImmunoCAP (ThermoFisher)kUA/LPositivePeanut sIgEPredictiveImmunoCAP (ThermoFisher)kUA/LPositivePeanut SPTPredictiveSPT (ND extract)mmPositiveLang et al. [53]2022USA1844 years (median)2–7 (IQR)NAAllergy (OFC +)Ara h 2 sIgEPredictiveImmunoCAP (ThermoFisher)kUA/LPositiveDuan et al. [54]2021Canada, Austria 107* 8.5 years (mean)4.6–12.3 (IQR)NAAllergy (OFC +)Ara h 2 sIgEPredictiveImmunoCAP (Thermo Fisher)kU/LPositivePeanut BATPredictiveBAT (Flow-CAST)%PositiveJi et al. [39]2023United Kingdom 61* ND5 months-15 years (min-max)NAAllergy (OFC +)tIgEPredictiveImmunoCAP (ThermoFisher)kUA/LInverseAra h 2 sIgEPredictiveImmunoCAP (ThermoFisher)kUA/LPositiveAra h 2 sIgE/tIgEPredictiveImmunoCAP (ThermoFisher)%PositiveAra h 6 sIgEPredictiveImmunoCAP (ThermoFisher)kUA/LPositiveAra h 9 sIgEPredictiveImmunoCAP (ThermoFisher)kUA/LInverseRuinemans-Koerts et al. [40]2022Netherlands745.3 years (median)3.6–8.6 (IQR)NAAllergy (OFC +)Peanut sIgEPredictiveImmunoCAP (ThermoFisher)kUA/LPositiveAra h 2 sIgEPredictiveImmunoCAP (ThermoFisher)kUA/LPositiveAra h 6 sIgEPredictiveImmunoCAP (ThermoFisher)kUA/LPositivePeanut BATPredictiveindirect BAT (Flow2-CAST)AUCPositiveAra h 2 BATPredictiveindirect BAT (Flow2-CAST)AUCPositiveAra h 6 BATPredictiveindirect BAT (Flow2-CAST)AUCPositivePercival et al. [57]2020Australia3610.2 years (median)5.1–17.1 (min-max)NAAllergy (OFC +)Peanut SPTPredictiveSPT (Stallergenes extract)mmPositivePeanut sIgEPredictiveImmunoCAP (ThermoFisher)kUA/LPositiveAra h 2 sIgEPredictiveImmunoCAP (ThermoFisher)kUA/LPositiveFeNOPredictiveFeNO (NIOX VERO-Circassia AB)ppbPositiveKansen et al. [41]2021Netherlands15427 years (median)22–38 (IQR)NAAllergy (OFC +)Peanut sIgEPredictiveImmunoCAP (ThermoFisher)kUA/LPositiveAra h 1 sIgEPredictiveImmunoCAP (ThermoFisher)kUA/LPositiveAra h 2 sIgEPredictiveImmunoCAP (ThermoFisher)kUA/LPositiveAra h 3 s IgEPredictiveImmunoCAP (ThermoFisher)kUA/LPositiveAra h 6 sIgEPredictiveImmunoCAP (ThermoFisher)kUA/LPositiveCarrette et al. [42]2023France916.8 years (median)5–11.3.3 (IQR)NAAllergy (OFC +)Ara h 2 sIgEPredictiveImmunoCAP (ThermoFisher)kUA/LPositivePeanut BATPredictiveBAT (Flow-CAST)%PositivePeanut sIgEPredictiveImmunoCAP (ThermoFisher)kUA/LPositiveKidon et al. [49]2021Israel1103.3 years (mean)1–6 (min-max)NAAllergy (OFC +)Peanut SPTPredictiveSPT (ALK extract); LPP-MH (Volvani)mmPossitivePeanut sIgEPredictiveImmunoCAP (ThermoFisher)kUA/LPossitiveAra h 2 sIgEPredictiveImmunoCAP (ThermoFisher)kUA/LPossitiveChua et al. [50]2021China314.54 years (median)3.65–6.46 (95% percentile)NAAllergy (OFC +)Peanut SPTPredictiveSPT (ALK extract)mmPositiveAra h 2 sIgEPredictiveImmunoCAP (ThermoFisher)kUA/LPositiveKlueber et al. [43]2023Luxembourg267.6 years (mean)3–13 (min-max)NAAllergy (OFC +)Naive CD4 + T cellsPredictiveBAT (Flow-CAST)%InverseOjaniemi et al. [44]2022Finland1077.18 years (median)1.17–17.74 (min-max)NAAllergy (OFC +)Ara h 2 sIgEPredictiveImmunoCAP (ThermoFisher)kUA/LPositiveMustillo et al. [55]2022Canada4226 years (median)14–54 (min-max)NAAllergy (OFC +)Peanut sIgEPredictiveImmunoCAP (ThermoFisher)kUA/LPositivePeanut sIgE/tIgEPredictiveImmunoCAP (ThermoFisher)kUA/LPositiveAra h 2 sIgEPredictiveImmunoCAP (ThermoFisher)kUA/LPositiveKansen et al. [45]2021Netherlands1507.9 years (median)5.4 to 13.0 (IQR)NAAllergy (OFC +)Ara h 2 sIgEPredictiveImmunoCAP (ThermoFisher)kUA/LPositive Pistachio Cetinkaya et al. [46]2021Turkey 82*
51.9 months (median)*
28.51–87.12 (IQR)* NAAllergy (OFC +)Pistachio SPTPredictiveSPT (Homemade extract)mmPositivePistachio sIgEPredictiveImmunoCAP (ThermoFisher)kUA/LPositivePistachio sIgE/tIgEPredictiveImmunoCAP (ThermoFisher)NAPositive Sesame Santos et al. [36]2021United Kingdom, Switzerland, Italy925.1 years (median)3–9 (IQR)NAAllergy (OFC +)Sesame SPTPredictiveCommercial tahini paste (Meridian Foods)mmPositiveSesame sIgEPredictiveImmunoCAP (ThermoFisher)kUA/LPositiveSesame BATPredictiveBAT (Flow-CAST)%PositiveMachnes-Maayan et al. [48]2022Israel1043.93 years (mean)6 months-17 years (min-max)NAAllergy (OFC +)Sesame SPTPredictiveSPT (ALK) and natural sesame paste (commercial tahini)mmPositive Walnut Duan et al. [54]2021Canada, Austria 107* 8.5 years (mean)4.6–12.3 (IQR)NAAllergy (OFC +)Jug r 1 sIgEPredictiveImmunoCAP (Thermo Fisher)kU/LPositiveJug r 2 sIgEPredictiveImmunoCAP (Thermo Fisher)kU/LPositiveWalnut BATPredictiveBAT (Flow-CAST)%PositiveLee et al. [51]2021South Korea41 3.4 years (median)*
1.25–9.25 (IQR)* NAAllergy (OFC +)Jug r 1 sIgEPredictiveISAC ImmunoCAP (Thermofisher)ISUPositive Wheat Al Hawi et al. [52]2021Japan1841.83 years (median)1–6.75.75 (min-max)NAAllergy (OFC +)Wheat sIgEPredictiveImmunoCAP (ThermoFisher); IMMULITE 2000 3 g Allergy system (Siemens Healthcare Diagnostics)kUA/L; IU/mLPositiveω5 Gliadin sIgEPredictiveImmunoCAP (ThermoFisher); IMMULITE 2000 3 g Allergy system (Siemens Healthcare Diagnostics)kUA/L; IU/mLPositive Almond Santos et al. [36]2021United Kingdom, Switzerland, Italy925.1 years (median)3–9 (IQR)NAAllergy (OFC +)Almond BATPredictiveBAT (Flow-CAST)%PositiveAlmond SPTPredictiveCommercial extract (Stallergenes)mmPositive^1^*USA *United States of America. ^2^IQR Interquartile range. ^3^*OFC *Oral food challenge. ^4^*BAT *Basophil activation test, SPT Skin prick test, sIgE Specific IgE, tIgE Total IgE. ^5^*AUC *Area under curve, ISU ISAC standardized units, ppb Parts per billion. NA Not applicable, ND Not determined
Regarding patients’ age, 17 studies were conducted in young children (74%) [36, 38, 40, 42–54, 56], three in children and teens up to 18 years old (13%) [44, 48, 57], and three in adults (13%) [35, 41, 55]. According to the number of patients included, they ranged from small cohorts (12 subjects) [35], focused on discovering new Bms [35, 43], to big study populations (981 subjects) [37], when studying contrasted Bms.
Apart from sesame [36, 48] and wheat [52], the majority of the studies were conducted in peanut (73.9%) [35–37, 39–45, 49, 50, 53–57], followed by nuts (26.1%) [36, 38, 46, 47, 51, 54]. Specifically, hazelnut (13%) [36, 47, 54], cashew (13%) [36, 38, 46], walnut (8.7%) [51, 54], pistachio (4.3%) [46] and almond (4.3%) [36] were evaluated.
The most frequently identified Bms were sIgE against both total and molecular allergens (82.6%) [36, 38–42, 44–47, 49–57]. Precisely, 12 studies analyzed sIgE against complete allergen extracts (52.2%) [36, 38, 40–42, 46, 47, 49, 52, 55–57]; while 18 articles evaluated sIgE against molecular components (78.3%) [36, 38–42, 44, 45, 47, 49–57], being Ara h 2 the most frequent allergen (60.9%) [36, 39–42, 44, 45, 49, 50, 53–57]. Otherwise, eight studies evaluated SPT (34.8%) [36, 38, 46, 48–50, 56, 57] determinations with commercial (26.1%) [36, 38, 48–50, 57] or homemade extracts (4.3%) [46], and natural foods (8.7%) [36, 48]. Moreover, six studies analyzed BAT (26.1%) [36–38, 40, 42, 54], with complete extract (17.4%) [36–38, 54] and molecular allergens (8.7%) [36, 40]. Finally, a minority of articles evaluated other Bms, such as naive CD4 T cells [43], genetic factors [35], tIgE [39] and FeNO [57].
Severity
The severity section had the highest number of articles. We included 25 studies about Bms related to the severity of reaction, performed in 4,799 patients and identifying 44 different Bms (Table 3). Half of the studies were based on clinical response after OFC [37, 38, 56–66], rather than on patients’ clinical history. However, the severity concept was determined heterogeneously among these articles, since some papers considered the most severe clinical pattern anaphylaxis diagnosis [57–59, 67–70] or epinephrine use [56], or both [61]; while others considered non-local systemic symptoms [71–73] or even intensity of oral allergy syndrome (OAS) as a grading system for reactions severity [60]. Most of the studies graded severity based on published severity scales: Sampson et al. classification was the most frequently used [74], in four studies [40, 56, 63, 65]; followed by Ring & Messmer classification [75], in two articles [62, 69]; and Muraro et al. classification [76], in two studies [63, 67]. In addition, mild and severe definitions appeared overlapping among studies [10, 61, 67, 77]. OAS patients were excluded in one article [78], while in other studies they represented the mild reaction group [71–73] or was used for severity grading [60]. The control group was also heterogeneous among articles, since mild allergic patients were used as control in some studies [38, 58, 62, 63, 65, 66, 69, 71, 72, 79], while others included sensitized tolerating patients [56, 59, 61, 64, 77].
Table 3. Studies regarding susceptibility to present severe reactions (n = 25). Italics* indicate the specific study population for that biomarker (Bm) within the total cohort. A positive association is related to an increase in the Bm according to the pathology/condition evaluated, while an inverse association is linked to a decrease in the BmARTICLESTUDIED POPULATIONBIOMARKERFoodReferenceYear of publicationCountry^1^Sample sizeAgeRange^2^Control groupPathology/Condition^3^Name^4^TypeDiagnostic technique (manufacturer)Units^5^Association Almond Alves et al. [67]2022Portugal 82* 13 years (median)8–19 (min-max)YesAnaphylaxisAlmond sIgESusceptibilityImmunoCAP (ThermoFisher)kUA/LPositivePru p 3 sIgESusceptibilityImmunoCAP (ThermoFisher)kUA/LPositiveVirkud et al. [59]2019USA59010.2 years (mean)8.1 (SD)YesAnaphylaxisAlmond sIgESusceptibilityImmunoCAP (ThermoFisher)kUA/LPositiveAlmond SPTSusceptibilitySPT (ND extract)mmPositivePeanut sIgESusceptibilityImmunoCAP (ThermoFisher)kUA/LPositivePistachio sIgESusceptibilityImmunoCAP (ThermoFisher)kUA/LPositivePecan sIgESusceptibilityImmunoCAP (ThermoFisher)kUA/LPositiveWalnut sIgESusceptibilityImmunoCAP (ThermoFisher)kUA/LPositive Cashew Goldberg et al. [58]2024Israel 74* 8.4 years (median)6.2–11.6 (IQR)YesAnaphylaxisCashew SPTSusceptibilitySPT (Homemade extract)mmPositiveAna o 3 sIgESusceptibilityImmunoCAP (ThermoFisher)kUA/LPositiveRöntynen et al. [38]2022Finland725.5 years (median)1.4–16.7 (min-max)YesModerate-severe reactionCashew SPTSusceptibilitySPT (ALK extract)mmPositiveCashew BATSusceptibilityFlow-CAST (Bülhman)%Positive Hazelnut Alves et al. [67]2022Portugal 90* 12 years (median)3–16 (min-max)YesAnaphylaxisBet v 1 sIgESusceptibilityImmunoCAP (ThermoFisher)kUA/LInverseValbuena et al. [63]2021Spain228.1 years (mean)2.7 (SD)YesSevere vs. moderate/mild reactionCor a 11 sIgESusceptibilityALEX (MacroArrayDX)kUA/LPositiveCor a 14 sIgESusceptibilityImmunoCAP (ThermoFisher)kUA/LPositiveHazelnut sIgESusceptibilityImmunilte (Siemens)kUA/LPositiveSunflower seed SPTSusceptibilitySPT (Leti SLU or Roxall SA or ALK SA)mmPositive Pecan Kubota et al. [68]2022Japan 21* 8 years (mean)2.5–15.5 (range)YesAnaphylaxisMacadamia sIgESusceptibilityImmunoCAP (ThermoFisher)kUA/LPositiveGoldberg et al. [61]2021Israel 98* 8 years (median)6–11 (min-max)YesLower respiratory symptoms at OFCPecan BATSusceptibilityBAT (Homemade)%Positive Peach Urbani et al. [80]2022Italy16537.8 years (mean)12.4 (SD)YesSevere reactions in 3 years follow-upPla a 3 sIgESusceptibilityImmunoCAP (ThermoFisher)kUA/LNDKallen et al. [78]2023Iceland, United Kingdom, Netherlands, Poland, Czech Republic, Bulgaria, France, Lithuania, Switzerland, Italy, Greece, Spain, Japan47732.2 years (mean)14.7 (SD)YesSevere symptomsPru p 7 sIgESusceptibilityImmunoCAP (ThermoFisher)kUA/LPositiveCup s 7 sIgESusceptibilityImmunoCAP (ThermoFisher)kUA/LPositiveAndo et al. [71]2020Japan2713 years (median)7–20 (min-max)NoSystemic reaction vs. local reactionPru p 1 sIgESusceptibilityImmunoCAP (ThermoFisher)kUA/LInversePru p 4 sIgESusceptibilityImmunoCAP (ThermoFisher)kUA/LInversePru p 7 sIgESusceptibilityImmunoCAP (ThermoFisher)kUA/LPositiveAlder sIgESusceptibilityImmunoCAP (ThermoFisher)kUA/LInverseDeng et al. [72]2019China3826 years (median)11–58 (min-max)YesSystemic reaction vs. OASPru p 3 sIgESusceptibilityImmunoCAP (ThermoFisher)kUA/LPositiveAsaumi et al. [73]2019Japan9010 years (median)8–12 (IQR)YesSystemic vs. local reactionAlder sIgESusceptibilityImmunoCAP (ThermoFisher)kUA/LInversePru p 1 sIgESusceptibilityImmunoCAP (ThermoFisher)kUA/LInversePru p 4 sIgESusceptibilityImmunoCAP (ThermoFisher)kUA/LInverseBet v 1 sIgESusceptibilityImmunoCAP (ThermoFisher)kUA/LInverse Peanut Alves et al. [67]2022Portugal 121* 7 years (median)3–15 (IQR)YesAnaphylaxisAra h 2 sIgESusceptibilityImmunoCAP (ThermoFisher)kUA/LPositiveBet v 1 sIgESusceptibilityImmunoCAP (ThermoFisher)kUA/LInverseSantos et al. [37]2020United Kingdom981ND5–6 (min-max)YesSevere symptomsPeanut BATSusceptibilityBAT (Homemade)%PositiveAra h 2 sIgESusceptibilityImmunoCAP (ThermoFisher)kUA/LPositivePeanut SPTSusceptibilitySPT (ALK extract)mmPositivePeanut sIgESusceptibilityImmunoCAP (ThermoFisher)kUA/LPositivePeanut sIgG4/sIgESusceptibilityImmunoCAP (ThermoFisher)kUA/LPositiveKaur et al. [56]2021Australia2228 years (median)5–12 (min-max)YesSevere symptomsPeanut sIgESusceptibilityImmunoCAP (ThermoFisher)kUA/LPositiveAra h 1 sIgESusceptibilityImmunoCAP (ThermoFisher)kUA/LPositiveAra h 2 sIgESusceptibilityImmunoCAP (ThermoFisher)kUA/LPositiveAra h 6 sIgESusceptibilityImmunoCAP (ThermoFisher)kUA/LPositivePercival et al. [57]2020Australia2111.4 years (median)5.1–16.5 (min-max)YesAnaphylaxis vs. non-anaphylactic symptoms at OFCFeNOPrognosticFeNO (NIOX VERO-Circassia AB)ppbInverseDatema et al. [77]2021Iceland, United Kingdom, Netherlands, Poland, Czech Republic, Bulgaria, France, Lithuania, Switzerland, Italy, Greece, Spain393 24.8 years (mean)*
13.7 (SD)* YesSevere vs. mild/moderate reactionPeanut SPTSusceptibilitySPT (ALK extract)mmPositivePeanut sIgESusceptibilityImmunoCAP (ThermoFisher)kUA/LPositiveAra h 1 sIgESusceptibilityISAC ImmunoCAP (Thermofisher)ISUPositiveAra h 2 sIgESusceptibilityISAC ImmunoCAP (Thermofisher)ISUPositiveAra h 6 sIgESusceptibilityISAC ImmunoCAP (Thermofisher)ISUPositiveAra h 3 sIgESusceptibilityISAC ImmunoCAP (Thermofisher)ISUPositiveAra h 8 sIgESusceptibilityISAC ImmunoCAP (Thermofisher)ISUInverseAl-Ahmad et al. [79]2022Kuwait 52* 23.6 years (mean)11.8 (SD)YesSystemic vs. local reactionPeanut sIgESusceptibilityImmunoCAP (ThermoFisher)kUA/LPositiveAra h 1 sIgESusceptibilityImmunoCAP (ThermoFisher)kUA/LPositiveAra h 2 sIgESusceptibilityImmunoCAP (ThermoFisher)kUA/LPositiveDatema et al. [64]2019Denmark1626.5 years (mean)4.4 (SD)YesSeverityPeanut sIgESusceptibilityImmunoCAP (ThermoFisher)kUA/LPositiveAra h 1 sIgESusceptibilityImmunoCAP (ThermoFisher)kUA/LPositiveAra h 2 sIgESusceptibilityImmunoCAP (ThermoFisher)kUA/LPositiveAra h 3 sIgESusceptibilityImmunoCAP (ThermoFisher)kUA/LPositiveLang et al. [65]2023USA37NDNDYesSeverityAlpha tryptaseSusceptibilityPCRCopy numberPositivePetek et al. [69]2023Slovenia9412 years (median)3–18 (min-max)YesAnaphylaxis vs. non-anaphylactic symptomsAra h 2 sIgESusceptibilityImmunoCAP (ThermoFisher)kUA/LPositiveCottel et al. [66]2021France569.5 years (median)6.9–14 (min-max)YesSevere vs. mild-moderate symptomstIgESusceptibilityImmunoCAP (ThermoFisher)kUA/LPositivePeanut sIgESusceptibilityImmunoCAP (ThermoFisher)kUA/LPositiveAra h 2 sIgESusceptibilityImmunoCAP (ThermoFisher)kUA/LPositivePositive control BAT (FcεRI)SusceptibilityFlow-CAST (Bülhman)%PositivePositive control BAT (fMLP)SusceptibilityFlow-CAST (Bülhman)%Positive Pollen-related plant-food Li et al. [70]2020China30229.5 years (mean)8–84 (min-max)YesAnaphylaxis vs. OASMugwort sIgESusceptibilityImmunoCAP (ThermoFisher)kUA/LPositiveArt v 3 sIgESusceptibilityImmunoCAP (ThermoFisher)kUA/LPositive Soya Caballero et al. [60]2023Germany3438 years (mean)NDNoIntensity of oral tingling/itching at OFCBet v 1 peptide GL12 (127-139aa) sIgG4SusceptibilityIn silico peptide arrayNAPositive Walnut Lyons et al. [10]2021Iceland, United Kingdom, Netherlands, Poland, Czech Republic, Bulgaria, France, Lithuania, Switzerland, Italy, Greece, Spain33630.4 years (mean)13.9 (SD)YesSeverityWalnut sIgESusceptibilityImmunoCAP (ThermoFisher)kUA/LPositiveGoldberg et al. [61]2021Israel 120* 8 years (median)6–11 (min-max)YesEpinephrin required reaction at OFCWalnut BATSusceptibilityBAT (Homemade)%Positive Wheat Faihs et al. [62]2023Germany2253.5 years (median)25–80 (min-max)YesSevere reactionGluten sIgESusceptibilityImmunoCAP (ThermoFisher)mmPositiveGliadin sIgESusceptibilityImmunoCAP (ThermoFisher)mmPositiveTryptaseSusceptibilityImmunoCAP (ThermoFisher)mg/LPositive^1^*USA *United States of America. ^2^*IQR *Interquartile range, SD Standard deviation. ^3^OAS Oral allergy syndrome, OFC Oral food challenge. ^4^*BAT *Basophil activation test, SPT Skin prick test, sIgE Specific IgE, sIgG4 Specific IgG4. ^5^*ISU *ISAC standardized units, ppb Parts per billion. NA Not applicable, ND Not determined
The most studied allergic food was peanut (40%) [37, 56, 57, 64–67, 69, 77, 79] and nuts (32%) [10, 38, 58, 59, 61, 63, 67, 68], followed by peach (20%) [71–73, 78, 80] and, less represented, soya (4%) [60] or wheat (4%) [62]. In addition, general pollen related plant-food was also studied in one article [70]. Accordingly, the most endorsed Bms were Ara h 2 sIgE (28%) [37, 56, 64, 66, 67, 69, 79] and peanut sIgE (28%) [37, 56, 59, 64, 66, 77, 79]. However, Pru p 3 sIgE was only related to severity for peach in one study [72] and for almond in another one [67]. Interestingly, the majority of Bms identified for peach severity were related to mild reactions [71, 73]. Moreover, Bms of mild reactions were also identified for hazelnut [67] and peanut [57, 67, 77], related to PR-10 or profilin sensitization.
A large number of studies identified sIgE (76%) [10, 37, 56, 58, 59, 62–64, 66–69, 71, 73, 77–80], mainly to specific allergens (20%) [58, 62, 69, 78, 80] rather than whole extracts (12%) [10, 59, 68], although most of the studies identified both types of sIgE (44%) [37, 56, 63, 64, 66, 67, 70, 71, 73, 77, 79]. Subsequently, the next most frequent Bms were SPT (20%) [37, 58, 59, 63, 77], using commercial (16%) [37, 59, 63, 77] or homemade extracts (4%) [58]; BAT (16%), analyzing the percentage of activated basophils [37, 38, 61] or the response to positive controls [66]; and other Bms (20%), such as sIgG4/sIgE ratio [37], FeNO [57], tryptase levels [62], the number of α-tryptase copies [65] and Bet v 1 peptide GL12 sIgG4 (127-139aa) epitope [60]. Moreover, further than the study focused on pollen related plant FA [70], where mugwort sIgE and Art v 3 sIgE were directly associated with severe reactions, other pollen derived Bms (Pla a 3 sIgE [80] and Alder sIgE [71]) were also associated with peach allergy severity. Interestingly, some Bms were related to severe reactions to different foods from their origin, such as Pru p 3 sIgE [67] or other whole extract tree nuts sIgE [59] for almond.
Threshold
We included 17 articles showing association between Bms and reactive thresholds, analyzing a total of 2,431 patients and identifying 47 Bms (Table 4). However, the number of subjects per study was heterogeneous depending on the specific food or the type of Bm investigated. Generally, articles on peanut allergy were those with biggest cohorts [37, 81, 82]; while smaller groups of patients were used for investigating less common allergies, such as cofactor-dependent wheat allergy [62], or for studies employing sophisticated technologies [43, 83].
Table 4. Studies about different levels of threshold (n = 17). Italics* indicate the specific study population for that biomarker (Bm) within the total cohort. A positive association is related to an increase in the Bm according to the pathology/condition evaluated, while an inverse association is linked to a decrease in the BmARTICLESTUDIED POPULATIONBIOMARKERFoodReferenceYear of publicationCountry^1^Sample sizeAgeRange^2^Control groupPathology/Condition^3^Name^4^TypeDiagnostic technique (manufacturer)Units^5^Association Cashew Goldberg et al. [58]2024Israel 82* 8.4 years (median)6.2–11.6 (IQR)NoThreshold during OFC (low to high dose)Cashew BATPredictiveBAT (Flow-CAST)%InverseCashew SPTPredictiveSPT (Homemade extract)mmInverseAna o 3 sIgEPredictiveImmunoCAP (ThermoFisher)kUA/LInverseRöntynen et al. [38]2022Finland725.5 years (median)1.4–16.7 (range)YesThreshold during OFC (low to high dose)Ana o 3 sIgEPredictiveImmunoCAP (ThermoFisher)kUA/LInverseCashew BATPredictiveBAT (Flow-CAST)%InverseCashew SPTPredictiveSPT (ALK extract)mmInverseCashew sIgEPredictiveImmunoCAP (ThermoFisher)kUA/LInverse Peanut Santos et al. [37]2020United Kingdom981ND5–6 (min-max)NoThreshold during OFC (low to high dose)Peanut SPTPredictiveSPT (ALK extract)mmInverseAra h 2 sIgEPredictiveImmunoCAP (ThermoFisher)kUA/LInversePeanut sIgEPredictiveImmunoCAP (ThermoFisher)kUA/LInversePeanut IgG4/IgEPredictiveImmunoCAP (ThermoFisher)kUA/LInversePeanut BATPredictiveBAT (Homemade)%InverseKaur et al. [56]2021Australia 89* 8 years (median)5–12 (IQR)YesThreshold during OFC (low to high dose)Ara h 1 sIgEPredictiveImmunoCAP (ThermoFisher)kUA/LInverseAra h 2 sIgEPredictiveImmunoCAP (ThermoFisher)kUA/LInverseAra h 3 sIgEPredictiveImmunoCAP (ThermoFisher)kUA/LInverseAra h 6 sIgEPredictiveImmunoCAP (ThermoFisher)kUA/LInversePeanut sIgEPredictiveImmunoCAP (ThermoFisher)kUA/LInverseRuinemans-Koerts et al. [40]2021Netherlands 38* 5.3 years (median)3.6–8.00 (IQR)YesThreshold during OFC (low to high dose)Ara h 2 Indirect BAT (EC50)PredictiveBAT (Flow-CAST)ng/mLPositiveKlueber et al. [43]2022Luxemburg 11* 7.5 years (mean)3–12 (min-max)YesThreshold during OFC (low to high dose)Intermediate monocyte cellsPredictiveMaxpar Human Immune Monitoring Panel kit (Fluidigm)N. of eventsInverseMyeloid dendritic cellsPredictiveMaxpar Human Immune Monitoring Panel kit (Fluidigm)N. of eventsInverseElegbede et al. [81]2018France, Belgium, Luxemburg2388 years (median)6–11 (IQR)NoThreshold during OFC (low to high dose)Ara h 2 sIgEPredictiveImmunoCAP (ThermoFisher)kUA/LInversePeanut SPTPredictiveNDmmInverseBerin et al. [83]2022USA749.5 years (mean)4–20 (min-max)NoThreshold during OFC (low to high dose)IL4 + CD154 + cellsPredictiveCytometry (FlowJo Software)N. of eventsInverseType 2 CD4 + cellsPredictiveCytometry (FlowJo Software)N. of eventsInverseSuprun et al. [82]2022United Kingdom, Australia331ND4–25 (min-max)YesLow, moderate and high cumulative tolerated dosePeptides of Ara h 1 sIgE (n = 33) #PredictiveBBEASignal levelPositivePeptides of Ara h 2 sIgE (n = 14) #PredictiveBBEASignal levelPositivePeptides of Ara h 3 sIgE (n = 14) #PredictiveBBEASignal levelPositiveDreskin et al. [84]2019USA 46* ND0.75–3.75 (min-max)NoThreshold during OFC (low to high dose)Peanut sIgEPredictiveImmunoCAP (ThermoFisher)kUA/LInverseAra h 2 sIgEPredictiveImmunoCAP (ThermoFisher)kUA/LInverseLinear epitope 5 of Ara h 2 sIgEPredictiveiPepStar™ peptide microarray platform (JPT Peptide Technologies)Signal levelInverseLinear epitope 6 of Ara h 2 sIgEPredictiveiPepStar™ peptide microarray platform (JPT Peptide Technologies)Signal levelInverseRuiter et al. [86]2019USA6217 years (median)10–24 (IQR)YesLow and high reactive dosePeanut sIgEPredictiveImmunoCAP (ThermoFisher)kUA/LInversePeanut sIgE/tIgEPredictiveImmunoCAP (ThermoFisher)kUA/LInverseAra h 2 sIgEPredictiveImmunoCAP (ThermoFisher)kUA/LInversePeanut sIgE/IgG4PredictiveImmunoCAP (ThermoFisher)kUA/LInversePeanut SPTPredictiveNDmmInversePeanut specific T cellsPredictiveCytometry (FlowJo Software)N. of eventsPositiveCottel et al. [66]2020France5612.4 years (median)7.7–14.1 (IQR)NoLow and high reactive doseAra h 2 sIgEPredictiveImmunoCAP (ThermoFisher)kUA/LInversePeanut BAT (10ng/ml)PredictiveBAT (Flow-CAST)%InversePeanut sIgEPredictiveImmunoCAP (ThermoFisher)kUA/LInversePeanut BAT (1ng/ml)PredictiveBAT (Flow-CAST)%InversePeanut BAT (EC50)PredictiveBAT (Flow-CAST)ng/mLPositivePeanut BAT (AUC)PredictiveBAT (Flow-CAST)AUCInversePeanut BAT (100ng/ml)PredictiveBAT (Flow-CAST)%InverseNormalized (FcεRI) Peanut BAT (10ng/ml)PredictiveBAT (Flow-CAST)%InverseNormalized (FcεRI) Peanut BAT (1ng/ml)PredictiveBAT (Flow-CAST)%InverseNormalized (FcεRI) Peanut BAT (EC50)PredictiveBAT (Flow-CAST)ng/mLPositiveNormalized (FcεRI) Peanut BAT (AUC)PredictiveBAT (Flow-CAST)AUCInverseZhang et al. [87]2022USA59ND4–14 (min-max)YesLow and high reactive doseα-diversity of oral microbiotaPredictive16 S rRNA sequencingShannon indexInverseOral Veillonella nakazawae (ASV 1979)Predictive16 S rRNA sequencingASVsPositiveStool Bacteroides thetaiotaomicron (ASV 6829)Predictive16 S rRNA sequencingASVsInverse Pistachio Goldberg et al. [58]2024Israel 74* 8.4 years (median)6.2–11.6 (IQR)NoThreshold during OFC (low to high dose)Pistachio SPTPredictiveSPT (Homemade extract)mmInverseAna o 3 sIgEPredictiveImmunoCAP (ThermoFisher)kUA/LInverse Soya Caballero et al. [60]2023Germany3438 years (mean)NDNoThreshold during OFC (low to high dose)Bet v 1 peptide GL12 (127-139aa) sIgG4PredictiveIn silico peptide arrayNAPositive Walnut Goldberg et al. [61]2020Israel 120* 8 years (median)6–11 (min-max)NoThreshold during OFC (low to high dose)Pecan SPTPredictiveSPT (Homemade extract)mmInversePecan BATPredictiveBAT (Homemade)%InverseWalnut BATPredictiveBAT (Homemade)%Inverse Wheat Faihs et al. [62]2023Germany2253.5 years (median)25–80 (min-max)NoThreshold during OFC (low to high dose)Gluten sIgEPredictiveImmunoCAP (ThermoFisher)kUA/LInverseGliadin sIgEPredictiveImmunoCAP (ThermoFisher)kUA/LInverseω5 Gliadin sIgEPredictiveImmunoCAP (ThermoFisher)kUA/LInverseItonaga et al. [85]2024Japan1242.4 years (median)1.6–3.8 (IQR)YesTolerance to low dosetIgEPredictiveImmunoCAP (ThermoFisher)kUA/LInverseWheat sIgEPredictiveImmunoCAP (ThermoFisher)kUA/LInverseω5 Gliadin sIgEPredictiveImmunoCAP (ThermoFisher)kUA/LInverse^1^*USA *United States of America. ^2^*IQR *Interquartile range. ^3^*OFC *Oral food challenge. ^4^*AUC *Area under curve, BAT Basophil activation test, EC50 Half maximal effective concentration, SPT Skin prick test, sIgE Specific IgE, sIgG4 Specific IgG4. # Specific peptides of Ara h 1 (sIgE): 8, 21, 22, 25, 29, 30, 33, 35, 40, 41, 44, 45, 47, 50, 56, 58, 90, 97, 103, 130, 131, 137, 167, 170, 173, 176, 179, 180, 184, 186, 187, 194, 203; Specific peptides of Ara h 2 (sIgE): 5, 8, 10, 17–19, 21, 30, 31, 36–38, 40, 45; Specific peptides of Ara h 3 (sIgE): 18, 30, 31, 37, 60, 68, 79, 80, 92, 93, 100, 102, 152, 162. ^5^*ASVs *Amplicon variant sequence, *AUC *Area under curve. NA Not applicable, ND Not determined
Threshold was assessed by analyzing the reactive dose at OFC based on different protocols among studies, even on the same plant food. To classify patients’ threshold some articles used the specific allergen amount [38, 56, 60, 61, 84], continuous numeric transformed variables [58, 81] or ordinary scales, employing the interaction between dose and cofactors [62]; whereas other studies used categorical classifications such as low-high threshold [37, 40, 43, 66, 83, 85–87] or low-moderate-high dose reactivity thresholds [81, 82].
Peanut was the most frequent cause of FA in this section (64.7%) [37, 40, 43, 56, 66, 81–84, 86, 87]; followed by nuts (17.6%) [38, 58, 61], although only one article evaluated more than one nut [58]; wheat (11.8%) [62, 85], where one study considered cofactor-dependent allergy [62]; and soybean (5.9%) [60].
The most frequent Bms were sIgE against molecular allergens (58.8%) [37, 38, 56, 58, 62, 66, 81, 84–86] and to the whole food extract (47.1%) [37, 38, 56, 62, 66, 84–86]. Furthermore, epitope-based array studies identified different peptide sIgE (11.8%) [82, 84] or sIgG4 (5.9%) [60], requiring further validation. Moreover, SPT was evaluated in six articles (35.3%) [37, 38, 58, 61, 81, 86], using commercial [37, 38] and homemade extracts [58, 61], although two studies did not specify the origin [81, 86]. Likewise, BAT was also measured in six articles (35.3%) [37, 38, 40, 58, 61, 66], even using different parameters such as EC50 or area under the curve (AUC) [40, 66]. In addition, novel threshold Bms have been described related to stool and oral microbiome [87] or to specific peripheral blood cell populations [43, 83, 86].
Follow-up Treatment
We included 15 papers about Bms related to treatment response, performed in 1,687 patients and identifying 53 Bms (Table 5). Among them, 11 studies were focused on OIT (73.3%) [84, 85, 88–96], one using Omalizumab as adjunct therapy [94], whereas four articles evaluated EPIT (26.7%) [83, 97–99]. Treatment response was determined heterogeneously among these articles. Certain studies considered efficacy when demonstrating sustained unresponsiveness [84, 90, 91, 93, 96], others when changing the immunological parameters after desensitization [83, 84, 88, 89, 92–95, 97], and others when increasing the threshold tolerated dose [85, 91, 98, 99]. These differences did not make comparisons difficult, as all the studies had similar endpoints: identifying Bms related to successful treatment response. In five articles there was no control group (33%) [88, 91, 93–95] defined mainly as subjects receiving a placebo.
Table 5. Studies about the response to treatments (n = 15). Italics* indicate the specific study population for that biomarker (Bm) within the total cohort. A positive association is related to an increase in the Bm according to the pathology/condition evaluated, while an inverse association is linked to a decrease in the BmARTICLESTUDIED POPULATIONBIOMARKERFoodReferenceYear of publicationCountry^1^Sample sizeAgeRange^2^Control groupPathology/Condition^3^Name^4^TypeDiagnostic technique (manufacturer)Units^5^Association Hazelnut Moraly et al. [88]2020France1005 years (median)3–9 (IQR)NoOITHazelnut sIgETreatment response predictionImmunoCAP (ThermoFisher)kUA/LInverseCor a 14 sIgETreatment response predictionImmunoCAP (ThermoFisher)kUA/LInverse Peanut Jones et al. [89]2022USA14639.3 months (median)30.8–44.7 (IQR)YesOITPeanut sIgETreatment response predictionImmunoCAP (ThermoFisher)kUA/LInversePeanut sIgE/tIgETreatment response predictionImmunoCAP (ThermoFisher)NAInverseAra h 1 sIgETreatment response predictionImmunoCAP (ThermoFisher)kUA/LInverseAra h 2 sIgETreatment response predictionImmunoCAP (ThermoFisher)kUA/LInverseAra h 3 sIgETreatment response predictionImmunoCAP (ThermoFisher)kUA/LInverseAra h 6 sIgETreatment response predictionImmunoCAP (ThermoFisher)kUA/LInversePeanut BATTreatment response predictionBAT%InversePeanut sIgG4Treatment response predictionImmunoCAP (ThermoFisher)kUA/LPositiveAra h 1 sIgG4Treatment response predictionImmunoCAP (ThermoFisher)kUA/LPositiveAra h 2 sIgG4Treatment response predictionImmunoCAP (ThermoFisher)kUA/LPositiveAra h 3 sIgG4Treatment response predictionImmunoCAP (ThermoFisher)kUA/LPositiveAra h 6 sIgG4Treatment response predictionImmunoCAP (ThermoFisher)kUA/LPositiveBerin et al. [83]2021USA749.5 years (mean)4–20 (min-max)YesEPITIL-4Treatment response predictionT cell assays (BD Biosystems)MFIInverseIL-10Treatment response predictionT cell assays (BD Biosystems)MFIPositiveIL-13Treatment response predictionT cell assays (BD Biosystems)MFIInverseCCR6+ cells(antigen-specific T cell)Treatment response predictionPBMCs assay (BD Biosystems)%PositiveTsai et al. [90]2020USA12011 years (median)1–3 (IQR)YesOITPeanut sIgETreatment response predictionImmunoCAP (ThermoFisher)kUA/LInverseAra h 1 sIgETreatment response predictionImmunoCAP (ThermoFisher)kUA/LInverseAra h 2 s IgETreatment response predictionImmunoCAP (ThermoFisher)kUA/LInverseAra h 3 sIgETreatment response predictionImmunoCAP (ThermoFisher)kUA/LInversePeanut sIgE/tIgETreatment response predictionImmunoCAP (ThermoFisher)kUA/LInversePeanut sIgG4Treatment response predictionImmunoCAP (ThermoFisher)kUA/LPositivePeanut sIgG4/sIgETreatment response predictionImmunoCAP (ThermoFisher)NAPositivePeanut BATTreatment response predictionBAT%InversePeanut BATSustained unresponsiveness predictionBAT%InverseScurlock et al. [97]2021USA746.2 years (median)5.2–9.1 (IQR)YesEPITPeanut sIgG4Treatment response predictionImmunoCAP (ThermoFisher)kUA/LPositiveAra h 2 sIgG4Treatment response predictionImmunoCAP (ThermoFisher)kUA/LPositivePeanut sIgETreatment response predictionImmunoCAP (ThermoFisher)kUA/LInverseScurlock et al. [84]2019USA47NA9–36 months (min-max)YesOITPeanut sIgESustained unresponsiveness predictionImmunoCAP (ThermoFisher)kUA/LInverseAra h 2 sIgESustained unresponsiveness predictionImmunoCAP (ThermoFisher)kUA/LInverseAra h 2 epitope 1 sIgESustained unresponsiveness predictionPeptides and microarray printing (Intuitive Biosciences)kUA/LInverseBastin et al. [98]2023Australia, Canada, Germany, Ireland, USA301 7 years (median)*
6–9 (IQR)* YesEPITAra h 1 sIgETreatment response predictionImmunoCAP (ThermoFisher)kUA/LInverseAra h 2 sIgETreatment response predictionImmunoCAP (ThermoFisher)kUA/LInversePeanut sIgG4/sIgETreatment response predictionImmunoCAP (ThermoFisher)NAPositiveO’B Hourihane et al. [92]2020Ireland, France, Germany, Italy, Spain, Sweden, United Kingdom1759.1 years (mean)3.7 (SD)YesOITPeanut sIgG4Treatment response predictionImmunoCAP (ThermoFisher)kUA/LPositivePeanut sIgE/sIgG4Treatment response predictionImmunoCAP (ThermoFisher)NAInverseDavis et al. [93]2022USA128.7 years (mean)5.2–12.2 (min-max)NoOITIL-4Treatment response predictionCell bead array technology (BD Biosciences)pg/mLInverseIL-5Treatment response predictionCell bead array technology (BD Biosciences)pg/mLInverseIL-9Treatment response predictionCell bead array technology (BD Biosciences)pg/mLInverseIL-13Treatment response predictionCell bead array technology (BD Biosciences)pg/mLInverseIL-4Sustained unresponsiveness predictionCell bead array technology (BD Biosciences)pg/mLPositiveIL-5Sustained unresponsiveness predictionCell bead array technology (BD Biosciences)pg/mLPositiveIL-9Sustained unresponsiveness predictionCell bead array technology (BD Biosciences)pg/mLInverseIL-10Sustained unresponsiveness predictionCell bead array technology (BD Biosciences)pg/mLPositiveIL-13Sustained unresponsiveness predictionCell bead array technology (BD Biosciences)pg/mLInverseIL-17Sustained unresponsiveness predictionCell bead array technology (BD Biosciences)pg/mLInverseFleischer et al. [99]2020USA, Canada, Germany, Ireland, Australia, France356 7 years (median)*
6–9 (IQR)* YesEPITPeanut sIgETreatment response predictionImmunoCAP (ThermoFisher)kUA/LInverseYee et al. [94]2019USA1310 years (median)8–16 (min-max)NoOmalizumab + OITtIgETreatment response predictionImmunoCAP (ThermoFisher)kUA/LInversePeanut sIgETreatment response predictionImmunoCAP (ThermoFisher)kUA/LInversePeanut sIgE/tIgETreatment response predictionImmunoCAP (ThermoFisher)NAInversePeanut sIgG4Treatment response predictionImmunoCAP (ThermoFisher)kUA/LPositivePeanut sIgE/sIgG4Treatment response predictionImmunoCAP (ThermoFisher)NAInverseAra h 1 sIgETreatment response predictionImmunoCAP (ThermoFisher)kUA/LInverseAra h 2 sIgETreatment response predictionImmunoCAP (ThermoFisher)kUA/LInverseAra h 1 sIgG4Treatment response predictionImmunoCAP (ThermoFisher)kUA/LPositiveAra h 2 sIgG4Treatment response predictionImmunoCAP (ThermoFisher)kUA/LPositiveAra h 1 sIgE/sIgG4Treatment response predictionImmunoCAP (ThermoFisher)NAInverseAra h 2 sIgE/sIgG4Treatment response predictionImmunoCAP (ThermoFisher)NAInverseRambo et al. [95]2023USA2016.2 years (median)8–17 (min-max)NoOITAra h 2 sIgETreatment response predictionISAC ImmunoCAP (ThermoFisher)kUA/LInverseAra h 3 sIgETreatment response predictionISAC ImmunoCAP (ThermoFisher)kUA/LInverseAra h 6 sIgETreatment response predictionISAC ImmunoCAP (ThermoFisher)kUA/LInversePeptide 116 of Ara h 1 sIgE/sIgG4Treatment response predictionPeptides and microarray printing (JPT Peptide Technology)NAPositivePeptides of Ara h 3 sIgE/sIgG4 (n = 5) #Treatment response predictionPeptides and microarray printing (JPT Peptide Technology)NAPositivePeptide 16 of Ara h 8 sIgE/sIgG4Treatment response predictionPeptides and microarray printing (JPT Peptide Technology)NAPositivePeptide 13 of Ara h 9 sIgE/sIgG4Treatment response predictionPeptides and microarray printing (JPT Peptide Technology)NAPositivePeptide 12 of Ara h 10 sIgE/sIgG4Treatment response predictionPeptides and microarray printing (JPT Peptide Technology)NAPositivePeptides of Ara h 11 sIgE/sIgG4 (n = 5) #Treatment response predictionPeptides and microarray printing (JPT Peptide Technology)NAPositivePeptides of Ara h 1 sIgE/sIgG4 (n = 15) #Treatment response predictionPeptides and microarray printing (JPT Peptide Technology)NAInversePeptides of Ara h 2 sIgE/sIgG4 (n = 8) #Treatment response predictionPeptides and microarray printing (JPT Peptide Technology)NAInversePeptides of Ara h 3 sIgE/sIgG4 (n = 8) #Treatment response predictionPeptides and microarray printing (JPT Peptide Technology)NAInversePeptide 5 of Ara h 6 sIgE/sIgG4Treatment response predictionPeptides and microarray printing (JPT Peptide Technology)NAInversePeptides of Ara h 9 sIgE/sIgG4 (n = 4) #Treatment response predictionPeptides and microarray printing (JPT Peptide Technology)NAInversePeptide 6 of Ara h 11 sIgE/sIgG4Treatment response predictionPeptides and microarray printing (JPT Peptide Technology)NAInversePeptide 17 of Ara h 5 sIgG4Treatment response predictionPeptides and microarray printing (JPT Peptide Technology)MFIPositivePeptide 23 of Ara h 6 sIgG4Treatment response predictionPeptides and microarray printing (JPT Peptide Technology)MFIPositivePeptide 25 of Ara h 6 sIgG4Treatment response predictionPeptides and microarray printing (JPT Peptide Technology)MFIPositivePeptide 19 of Ara h 5 sIgETreatment response predictionPeptides and microarray printing (JPT Peptide Technology)MFIPositiveSuprun et al. [96]2024USA106 10 years (median)*
8.5–13.5 (IQR)* YesOITtIgETreatment response predictionImmunoCAP (ThermoFisher)kUA/LInversePeanut sIgETreatment response predictionImmunoCAP (ThermoFisher)kUA/LInverseAra h 1 sIgETreatment response predictionImmunoCAP (ThermoFisher)kUA/LInverseAra h 2 sIgETreatment response predictionImmunoCAP (ThermoFisher)kUA/LInverseAra h 3 sIgETreatment response predictionImmunoCAP (ThermoFisher)kUA/LInversePeanut sIgG4Treatment response predictionImmunoCAP (ThermoFisher)kUA/LPositiveAra h 2 sIgG4Treatment response predictionImmunoCAP (ThermoFisher)kUA/LPositivePeptides of Ara h 1 sIgE (n = 14) Treatment response and sustained unresponsiveness predictionBBEAMFIInversePeptides of Ara h 3 sIgE (n = 13) Treatment response and sustained unresponsiveness predictionBBEAMFIInversePeptides of Ara h 2 sIgG4 (n = 14) Treatment response and sustained unresponsiveness predictionBBEAMFIInversePeanut sIgESustained unresponsiveness predictionImmunoCAP (ThermoFisher)kUA/LInverseAra h 2 sIgESustained unresponsiveness predictionImmunoCAP (ThermoFisher)kUA/LInverseAra h 1 sIgESustained unresponsiveness predictionImmunoCAP (ThermoFisher)kUA/LInversePeanut sIgG4Sustained unresponsiveness predictionImmunoCAP (ThermoFisher)kUA/LInversePeptides of Ara h 1 sIgE (n = 20) Sustained unresponsiveness predictionBBEAMFIInversePeptide 92 of Ara h 3 sIgESustained unresponsiveness predictionBBEAMFIInverse Wheat Itonaga et al. [85]2024Japan124 2.4 years (median)*
1.6–3.8 (IQR)* YesOITWheat sIgETreatment response predictionImmunoCAP (ThermoFisher)kUA/LInverseω5 Gliadin sIgETreatment response predictionImmunoCAP (ThermoFisher)kUA/LInversePourvali et al. [91]2023Iran197.42 years (mean)3.6 (SD)NoOITWheat sIgESustained unresponsiveness predictionImmunoCAP (ThermoFisher)kUA/LInverseWheat sIgE/sIgG4Sustained unresponsiveness predictionImmunoCAP (ThermoFisher)NAInverse^1^*USA *United States of America. ^2^*IQR *Interquartile range, *SD *Standard deviation. ^3^*EPIT *Epicutaneous immunotherapy, OIT Oral immunotherapy. ^4^*BAT *Basophil activation test, sIgE Specific IgE, sIgG4 Specific IgG4, tIgE Total IgE. # Specific peptides of Ara h 3 (sIgE/sIgG4, positive): 4, 5, 49, 50, 61; Specific peptides of Ara h 11 (sIgE/sIgG4, positive): 1, 5, 16–18; Specific peptides of Ara h 1 (sIgE/sIgG4, inverse): 5–7, 15–22, 28–31; Specific peptides of Ara h 2 (sIgE/sIgG4, inverse): 6–8, 17, 28–31; Specific peptides of Ara h 3 (sIgE/sIgG4, inverse): 1–3, 55, 56, 95–97; Specific peptides of Ara h 9 (sIgE/sIgG4, inverse): 6, 7, 9, 16. $ Specific peptides of Ara h 1 (sIgE): 8, 25, 29, 30, 33, 35, 40, 41, 44, 45, 47, 50, 56, 58, 90, 130, 131, 170, 176, 184, 186, 187, 194, 203; Specific peptides of Ara h 2 (sIgE): 5, 8, 10, 17–19, 21, 36–38, 101; Specific peptides of Ara h 3 (sIgE): 18, 30, 31, 37, 68, 79, 80, 92, 93, 100, 102, 152, 162; Specific peptides of Ara h 1 (sIgG4): 8, 15, 21, 22, 25, 29, 30, 33, 35, 40, 41, 44, 45, 47, 50, 56, 58, 90, 97, 103, 130, 131, 137, 167, 170, 173, 176, 179, 180, 184, 186, 187, 194, 203; Specific peptides of Ara h 2 (sIgG4): 5, 8, 10, 14, 17, 19, 21, 30, 36–38, 40, 43, 45; Specific peptides of Ara h 3 (sIgG4): 18, 30, 31, 60, 80, 92, 93, 162. ^5^*MFI *Median fluorescence intensity. BBEA Bead-based epitope assay, PBMCs Peripheral blood mononuclear cells, NA Not applicable, ND Not determined
All studies were performed in pediatric cohorts, although two studies also incorporated young adults [83, 95]. The majority of the studies were carried out in America (56%) [83, 84, 89, 90, 93–97], two were performed in Europe (13.3%) [88, 92], and two in several continents (13.3%) [98, 99].
The most frequent Bms were whole extract sIgE (66,7%) [84, 85, 88–91, 94, 96, 97, 99] and molecular sIgE (60%) [84, 85, 88–90, 94–96, 98]. In addition, six articles identified IgG4 as a Bm (40%) [89, 90, 92, 94, 96, 97]. Precisely, treatment efficacy is related to a sIgE decrease [84, 89, 90, 94–96, 98] and a sIgG4 increase for specific allergens [89, 94, 96, 97] and for whole extract [89, 90, 92, 94, 96, 97]. Even more, the decrease in sIgE/tIgE also indicated good tolerance [89, 90, 94]. On the other hand, some studies identified sophisticated Bms such as T cell assays and peptide microarrays [83, 84, 93, 95], or epitope array [95, 96]. In addition, interleukins [83, 93] and sIgE/IgG4 ratio against specific peptides [95] were also characterized.
Overall Risk-of-bias and Certainty
All articles included were assessed for risk-of-bias using tools adapted to their specific study design. For non-randomized studies (Table S2), the overall risk-of-bias was predominantly moderate, mainly due to confounding and certain limitations in outcome measurement and participant selection. In contrast, classification of exposures, deviations from intended interventions, selection of results, and handling of missing data were generally considered to be at low risk of bias. On the other hand, for studies of diagnostic accuracy (Table S3), the overall risk ranged from low to moderate, primarily due to non-optimal reference standards and issues in patient selection, as well as unclear flow and timing of procedures. Nonetheless, both clinical applicability and validity of the index test were found to be robust. Moreover, for cross-sectional studies (Table S4), the overall risk-of-bias was mostly rated as moderate, primarily due to sample size and justification, followed by issues related to participant selection, risk of non-response bias, and some concerns about measurement validity and reliability. In contrast, domains such as clear aims and justification, appropriate study design, statistical methods and reporting, and ethics and disclosures were consistently rated as low risk. Finally, the follow-up trials (Table S5) showed a low risk-of-bias across all categories. Altogether the body of evidence is characterized by a moderate (n = 45) and a low (n = 26) risk-of-bias, supporting an intermediate level of confidence in the overall conclusions.
In addition, all the studies were systematically evaluated using the GRADE approach to determine the certainty of evidence on the results (Table S6). The overall quality of evidence varied among low (n = 4), moderate (n = 59) and high (n = 8). The most frequent cause of degradation was imprecision, mainly due to moderate or small sample size. Other relevant factors that influenced the degree of certainty were the risk-of-bias and indirectness, associated with the design of the studies (especially the diagnostic method) and the lack of clinical validation of the results. Inconsistency and publication bias were generally low in all articles. Overall, the scope and robustness of the results were considered moderate, reflecting the exploratory nature of most of the studies.
Discussion
A total of 71 original articles about Bms in plant FA have been systematically reviewed and summarized. Surprisingly, although the prevalence of plant FA has been increasing globally [100], the number of studies about Bms seems to be limited and has been stable in the last few years. Nevertheless, our vision can be narrowed by the studied time range and the terms used as search criteria.
From a geographical perspective, only a restricted number of countries are researching plant FA Bms, with Europe and North America being the main areas where it has been investigated. No studies from Africa or South America were identified, which may be related to economic constraints or lower prevalences, although these are regions where plant-based foods are commonly consumed. Except for Europe, where studies were more relocated, in North America, Asia or Oceania research comes predominantly from the USA, Japan and Australia, respectively. Moreover, many of these studies were conducted using the same cohort of patients, highlighting the need for new investigations that include multiple countries and diverse geographical regions. On the other hand, most of the reviewed articles were focused on peanuts and nuts, indicating a notable lack of research on fruits, vegetables, and seeds. However, this may partly be a limitation of the search strategy and/or the inclusion and exclusion criteria applied.
Age population is also a relevant factor in plant FA, since most of the Bms studies were settled in pediatric populations. Comparative studies between children and adults are scarce [101–103], despite their potential to provide valuable insights on age-related differences in FA manifestations and mechanisms. Importantly, there are also age-related methodological limitations that may influence the applicability of Bms, as invasive sampling procedures often face greater ethical and practical constraints in pediatric settings, which may restrict the range of parameters assessed and influence study design. Therefore, this review evidences that recently published research on plant FA Bms has been largely conducted in pediatric peanut allergic patients from Europe and North America.
To address some of the main clinical questions in plant FA, this review has been structured into five thematic sections (Fig. 3): sensitization acquisition (sensitization), prediction of tolerance (tolerance), susceptibility to develop severe reactions (severity), clinical response to different threshold levels (threshold) or response to validated or non-validated treatments (follow-up treatment). Most of the studies were related to severity and tolerance, and a few to sensitization, suggesting that the classical question of clinical relevance is still a hot topic. However, the low number of articles in the sensitization section could also be influenced by limitations in the search strategy, as it did not include the term “sensitisation”.
Fig. 3. Comparison of allergenic sources and types of biomarkers (Bm) studied across the five thematic sections. Each section includes the number and the percentage of articles describing the Bm/allergenic sources in that section (most of them describe several Bm/allergenic sources). The most frequent Bm/allergenic source is highlighted in bold. The radial graph indicates the number of articles covered in each thematic section. Image created with Biorender.com
Across the five sections, peanut was the most represented food, followed distantly by nuts and grains. There is a notable absence of fruits, only represented by peach in the severity section. In contrast, wheat allergy was represented in all sections, predominantly in sensitization, probably due to its ubiquity more than for its prevalence [104]. In the sensitization section, studies focused on different plant foods were reviewed by repeating a similar list of plant food allergens reported in other sections. No articles on vegetables were found, probably due to limitations in the terms used in our search strategy.
The most frequent type of Bm identified across the different sections was molecular sIgE, closely followed by sIgE against the whole allergenic source. However, the sensitization section was where new Bms (some of them related to atopic dermatitis) were most extensively investigated: such as stratum corneum hydration (SCH), transepithelial water loss (TEWL), plasma and fecal metabolites, and microbiota composition. Although microbiota and FA is a growing interest topic [105, 106], microbiota-related Bms were only identified in one study of sensitization [27] and one study of threshold [87]. The presence of sIgG4, sIgE/sIgG4 ratios or interleukins were more frequent in the follow-up treatment section than in others; whereas cellular response, mainly basophils, was preferentially observed in tolerance, severity and threshold. Precisely, BAT was implicated in different types of Bms, from the percentage of activated basophils incubated with whole extract associated with tolerance [36–38, 42, 47, 48, 51, 88], threshold [37, 38, 61] or severity [61], to the normalized percentage of basophils, the AUC or the EC50, exclusively associated with threshold predictivity [40, 66]. The use of molecular allergens in BAT was mainly identified related to peanut tolerance [36, 40]. On the other hand, apart from the “classical” Bms, recent studies have identified others, such as genes [35], FeNO [57], immune cells [43, 83, 86], interleukins [83, 93], and allergen epitopes [60, 82, 84, 95, 96], although further research is needed.
Overall, studies based on molecular diagnosis identified mainly sIgE and BAT as Bms. Actually, CRD is the cornerstone of precision medicine in FA [107]. The usefulness of CRD is unquestionable, leading to a more accurate diagnosis, stratifying risk or providing more specific management advice [12, 108] and, thus, improving patient safety and quality of life. Certain molecular sIgE determinations are strongly recommended in clinical guidelines as tolerance Bms, such as Ara h 2, Ana o 3 or Cor a 14 sIgE in patients with a history of suspected IgE-mediated allergy to peanut, cashew or hazelnut, respectively [8]. In our review, the predictive role of these Bms has been supported not only in tolerance, but also in FA severity and threshold, although in the latter case only for Ara h 2 and Ana o 3 sIgE, since Cor a 14 sIgE was not identified as a threshold Bm. Precisely, Cor a 14 sIgE was not endorsed by all the studies focused on it. In a Japanese children cohort, Inoue et al. [47] identified high Cor a 9 and low Cor a 1 sIgE levels related to hazelnut allergy, but Cor a 14 sIgE was not significantly associated with hazelnut allergy.
Remarkably, positive results or high levels of the identified Bms were related to the pathology with very rare exceptions [39, 41, 84, 98], such as sensitization, clinical reactivity, more severe reaction or lower threshold. In turn, predominantly lower levels of the identified Bms were related to treatment response, probably due to the outcomes studied. Moreover, Bm identification can be influenced by the selected studied sample. Molecular Bms are a clear example, given that they can be biased by the predominant patient sample serotype. This aspect may potentially compromise the external validation of Bms and contribute to delaying the global access to CRD, although it should not be overlooked that Bms in allergy are more probabilistic than determinant [109]. On the other hand, although CRD is considered a game changer in diagnosis and management of plant FA, “classical” Bms have been identified among the most frequent, such as whole source sIgE, SPT or tIgE. These types of Bms highlight the accessibility of characterizing plant FA in many populations and locations. Even more, in many cases, the Bm identification is determined by the selected studied sample and requires external validation. For example, severity is defined differently in the reviewed articles, and in half of them it is based on symptoms reported by patients.
The assessment of risk-of-bias and certainty indicated an intermediate level of confidence in the overall conclusions of this review. The scope and strength of the evidence were considered moderate, consistent with the exploratory nature of many of the included studies. For these analyses, a hybrid strategy combining AI and human review was implemented. This approach demonstrated clear advantages in terms of efficiency, reproducibility, and reduction of subjective variability compared to fully manual assessments. However, limitations remain, as linguistic models may misinterpret nuanced methodological details or context-specific criteria. Human oversight is therefore essential to ensure accuracy and methodological rigor. While this strategy appears promising for large-scale evidence syntheses and seems encouraging for future reviews, its current role should be considered complementary to expert judgment, not a substitute for it. Future improvements in AI reliability may enhance its utility, but consensus-based oversight remains indispensable at present.
In conclusion, this systematic review highlights the critical role of Bms in advancing precision medicine for plant FA, while revealing significant gaps that limit their global applicability, underscoring that the identified Bms are far from meeting the standards required by the in vitro diagnostic regulation [110], which entails the use of Bms specifically validated technically and clinically for a given intended use when sample-dependent variations are common. Despite the recognized utility of CRD, current testing remains heavily skewed toward peanut allergy and pediatric cohorts in Europe and North America, leaving other plant foods and diverse populations underrepresented. Emerging Bms offer promising avenues for future research but require rigorous validation and standardization before clinical integration. Furthermore, the heterogeneity observed across studies highlights the need for multicenter, and geographically inclusive, research with harmonized methodologies to ensure validity. Bridging these gaps will ultimately be critical to facilitate access to precision diagnostic tools and optimize individualized management strategies, thereby improving the safety and quality of life for patients worldwide.
Supplementary Information
Below is the link to the electronic supplementary material.
Supplementary Material 1
The reference list from the paper itself. Each links out to its DOI / PubMed record.
- 1FDA-NIH Biomarker Working Group (2016) BEST (Biomarkers, Endpoint S, and other Tools) Resource. Food and Drug Administration (US), Silver Spring (MD)27010052 · pubmed ↗
- 2Open AI (2023) Chat GPT (March 14 version) [language model]. https://chat.openai.com