Association between dietary fiber intake and bone mineral density: a systematic review and meta-analysis of observational studies
Yuqi Pang, Zilan Chen, Ye Ju, Bin Yang, Jiaojiao Hou, Sirui Zheng, Zihao Li, Ting Liu, Hongxia Xia, Maoyao Xia, Yangdan Zhong, Jiayuan Li, Zhong Li, Xia Jiang

TL;DR
This study finds that higher dietary fiber intake is linked to better bone mineral density, especially in males and non-European/American populations.
Contribution
The paper provides a comprehensive meta-analysis of observational studies to clarify the inconsistent evidence on fiber and bone health.
Findings
Higher dietary fiber intake is significantly associated with higher bone mineral density (β = 0.013, 95%CI 0.011–0.015).
The association is stronger in males and populations outside Europe and America.
No publication bias was detected, and results were robust in sensitivity analyses.
Abstract
Although prior studies have linked dietary fiber to bone mineral density (BMD), the currently available evidences remain inconsistent and there is a lack of synthesis. This systematic review and meta-analysis aimed to comprehensively examine the association between dietary fiber intake and BMD in adults. We systematically searched the PubMed, Ovid, Web of Science, and ScienceDirect for studies evaluating the association between dietary fiber and BMD, from 2000 to January 2025. Two authors independently extracted data and assessed the risk of bias using the NOS and the AHRQ for observational cohort and cross-sectional Studies. Pooled \documentclass[12pt]{minimal} \usepackage{amsmath} \usepackage{wasysym} \usepackage{amsfonts} \usepackage{amssymb} \usepackage{amsbsy} \usepackage{mathrsfs} \usepackage{upgreek} \setlength{\oddsidemargin}{-69pt}…
Genes, proteins, chemicals, diseases, species, mutations and cell lines named across the full text — each resolved to its canonical identifier and authoritative record.
Click any figure to enlarge with its caption.
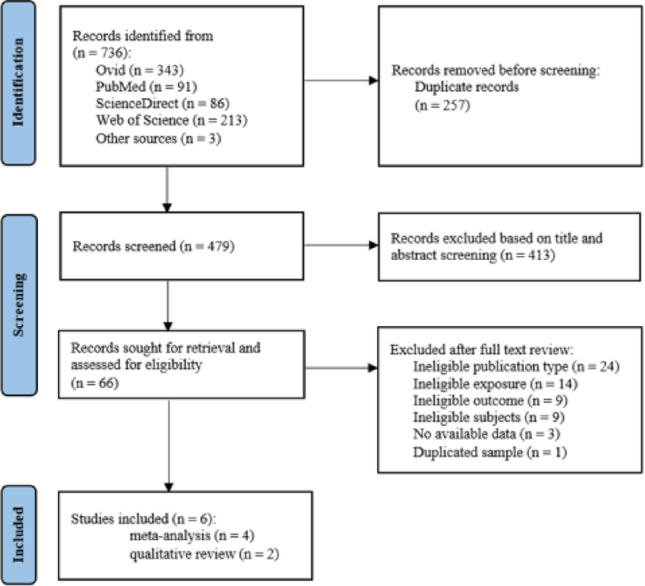 Figure 1
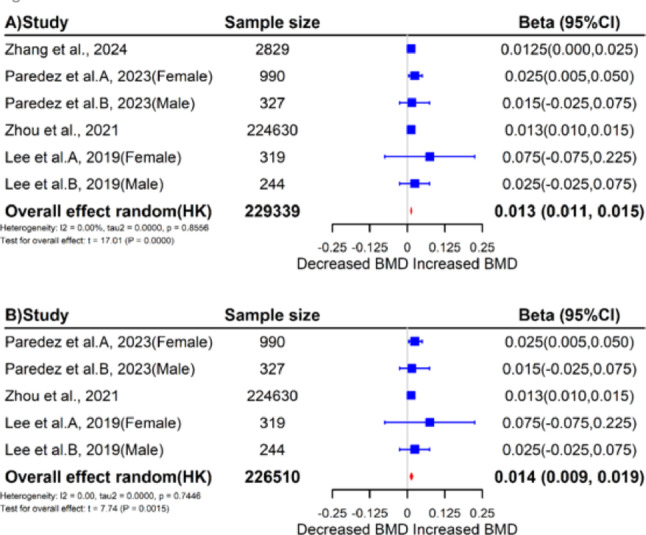 Figure 2
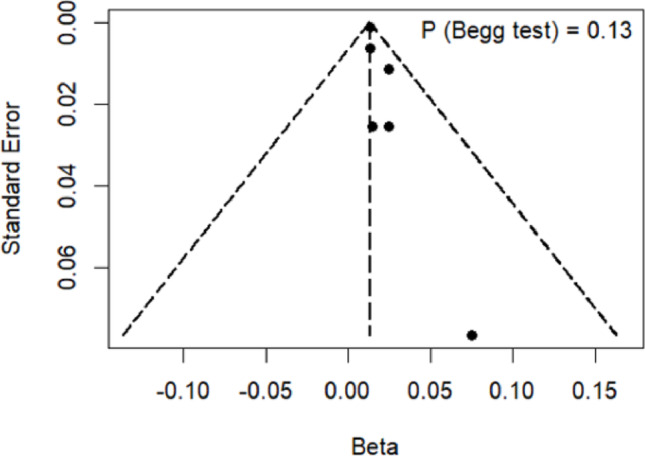 Figure 3
- —Karolinska Institute
Peer Reviews
No public reviews on file for this paper yet. If you reviewed it on a platform where reviews are public (OpenReview, ICLR, NeurIPS, ICML), you can paste yours below so the community can read it here.
Videos
No videos yet. Explain this paper in a talk, walkthrough, or lecture? Add one.
Taxonomy
TopicsBone health and osteoporosis research · Nutrition and Health in Aging · Food composition and properties
Introduction
Osteoporosis is a prevalent chronic disease characterized by systemic deterioration in bone mass and microstructures, leading to an increased risk of fractures [1, 2]. Worldwide, osteoporotic fractures affect approximately 33% of women and 20% of men aged over 50 [3]. As global population ages, the impairment of physical function, comorbidity, and mortality associated with osteoporosis is expected to rise, thereby bringing a huge medical and social burden [2, 4]. To address this pressing public health challenge, it is important to identify modifiable factors associated with osteoporosis.
Bone mineral density (BMD) is the primary diagnostic indicator of osteoporosis and is influenced by a multitude of genetic and environmental factors [5]. Dietary modification is one of the few safe and easily implementable strategies. Maintaining a healthy and balanced nutritional intake has been shown to play a vital role in preventing the onset of osteoporosis as well as in slowing its progression [6]. Several prospective cohort studies have demonstrated that, in addition to vitamin D and calcium, dietary patterns rich in fruits and vegetables are associated with higher BMD [7–9]. Given that dietary fiber is a fundamental component underlying these foods, it is plausible to hypothesize a potential role of dietary fiber intake in the promotion of BMD. However, research on this topic remains limited, and the precise nature of the association remains unclear.
Several clinical trials have demonstrated that dietary fiber promotes calcium absorption [10, 11] and retention [12], but these benefits fail to be translated into measurable improvements in BMD for trials of middle-aged and elderly individuals ( \documentclass[12pt]{minimal} \usepackage{amsmath} \usepackage{wasysym} \usepackage{amsfonts} \usepackage{amssymb} \usepackage{amsbsy} \usepackage{mathrsfs} \usepackage{upgreek} \setlength{\oddsidemargin}{-69pt} \begin{document}$$\:{N}_{sample}$$\end{document} 237–300, duration = 2 years) [13, 14]. Notably, in existing clinical trials, the term “dietary fiber” typically refers to a single type of fiber – such as wheat bran fiber or short-chain fructo-oligosaccharides – supplemented as an intervention. This neglects the fact that multiple types of fiber from daily diets may exert different biological effects compared to the single type. Furthermore, the duration of existing clinical trials does not exceed two years, which may be relatively short for dietary fiber interventions. Given that dietary fiber exerts its effects on bone health indirectly [15, 16] and that these effects require time to accumulate, significant improvements in BMD may only be observed over a longer duration [17, 18]. Therefore, evidence synthesis from well-designed, large-scale, population-based epidemiological studies is needed. However, findings to date remain inconsistent: smaller cross-sectional studies ( \documentclass[12pt]{minimal} \usepackage{amsmath} \usepackage{wasysym} \usepackage{amsfonts} \usepackage{amssymb} \usepackage{amsbsy} \usepackage{mathrsfs} \usepackage{upgreek} \setlength{\oddsidemargin}{-69pt} \begin{document}$$\:{N}_{sample}$$\end{document} 300–500) reported null or negative associations [19, 20], whereas larger cross-sectional studies ( \documentclass[12pt]{minimal} \usepackage{amsmath} \usepackage{wasysym} \usepackage{amsfonts} \usepackage{amssymb} \usepackage{amsbsy} \usepackage{mathrsfs} \usepackage{upgreek} \setlength{\oddsidemargin}{-69pt} \begin{document}$$\:{N}_{sample}$$\end{document} 2,800 − 220,000) suggested positive associations [21–23]. Longitudinal evidence also remains inconsistent: a Mexican cohort with 6-year follow-up ( \documentclass[12pt]{minimal} \usepackage{amsmath} \usepackage{wasysym} \usepackage{amsfonts} \usepackage{amssymb} \usepackage{amsbsy} \usepackage{mathrsfs} \usepackage{upgreek} \setlength{\oddsidemargin}{-69pt} \begin{document}$$\:{N}_{sample}$$\end{document} = 1,317) observed a negative association between dietary fiber intake and femoral-neck BMD change in males [24], whereas the Framingham Offspring Study with 12-year follow-up ( \documentclass[12pt]{minimal} \usepackage{amsmath} \usepackage{wasysym} \usepackage{amsfonts} \usepackage{amssymb} \usepackage{amsbsy} \usepackage{mathrsfs} \usepackage{upgreek} \setlength{\oddsidemargin}{-69pt} \begin{document}$$\:{N}_{sample}$$\end{document} = 1,857) found higher dietary fiber intake to be associated with more favorable annual changes in femoral-neck BMD among males [25].
Given the inconsistencies and limitations of existing research, as well as a lack of comprehensive synthesis, our study systematically reviews available data on the association between dietary fiber intake and BMD in adults and conducts a meta-analysis.
Method
Protocol and registration
This systematic review and meta-analysis was performed in accordance with the Preferred Reporting Items for Systematic Reviews and Meta-Analysis (PRISMA). A pre-specified protocol has been registered in the International Prospective Register of Systematic Reviews (PROSPERO) under the identification number CRD42025643323.
Search strategy
A comprehensive literature search was conducted in PubMed, Ovid, Web of Science, and ScienceDirect databases from 2000 to January 2025 by two independent reviewers. The search was not restricted to any specific language. We used search terms including “Diet”, “Dietary fiber”, “bone mineral density”, “BMD”, “bone mineral content” and more. A detailed search strategy is provided in Supplementary Table S1. The reference lists of related reviews and articles were manually screened for additional eligible studies. All literature was imported into EndNote 21 for subsequent screening.
Eligibility and study selection
Inclusion criteria were as follows: (1) the study was conducted in humans; (2) the study investigated the association between dietary fiber and bone mass – including bone mineral density, bone mineral content, T-score and Z-score; (3) the study reported effect estimates in a format of odds ratios (ORs), relative risks (RRs), hazard ratios (HRs), or \documentclass[12pt]{minimal} \usepackage{amsmath} \usepackage{wasysym} \usepackage{amsfonts} \usepackage{amssymb} \usepackage{amsbsy} \usepackage{mathrsfs} \usepackage{upgreek} \setlength{\oddsidemargin}{-69pt} \begin{document}$$\:\beta\:$$\end{document} -coefficients, with corresponding 95% confidence intervals (95%CIs), and appropriate adjustments for confounders.
Exclusion criteria were as follows: (1) studies published in languages other than English; (2) studies targeting populations with specific comorbidities (e.g., cardiovascular disease, diabetes, or cancer) rather than the general population; (3) inappropriate types of publication (e.g., conference abstract or conference proceedings); (4) studies involving children or adolescents (i.e., aged 0–18 years); (5) studies with unavailable data. When multiple studies derived from the same cohort were identified, priority was given to the one with the greatest statistical power, i.e., the largest sample size, the most comprehensive adjustment for confounders, or the longest follow-up period.
Two authors (YP and ZC) independently assessed the eligibility of each study based on the pre-determined inclusion and exclusion criteria. After removing duplicates, titles and abstracts were screened to exclude irrelevant reports. Subsequently, the full texts of the remaining studies were evaluated in detail, with any discrepancies resolved through consultation with a third author (YJ) until consensus was achieved.
Data extraction
Two reviewers (YP and YJ) independently extracted data from each eligible study, including the first author’s name, year of publication, study design, country, sample size, participants’ age and sex, methods used to assess dietary fiber intake and bone mass, covariates included in the statistical model, and the effect estimates with their 95%CIs. When multiple models with different adjustments were available, the most adjusted effect estimate was selected. All extracted data were cross-verified for consistency, and any discrepancies were resolved through discussion among the authors.
Risk of bias assessment
Two reviewers (YP and ZC) independently evaluated the risk of bias for the included studies using the Newcastle-Ottawa Scale (NOS) [26] for cohort studies and the Agency for Healthcare Research and Quality tool (AHRQ) [27] for cross-sectional studies. Any discrepancies were resolved through discussion.
The NOS comprises eight items categorized into three dimensions: participant selection, comparability, and outcome determination. Each item within the selection and outcome category receives a maximum of one point, while comparability is worth a maximum of two points. Based on the calculated total scores, each study was classified as low (0–3 points), medium (4–6 points), or high (7–9 points) quality [28].
The AHRQ tool comprises 11 items, each categorized as “Yes”, “No”, or “Unclear”, with a score of 1 assigned for “Yes” and 0 for others. Total scores are then categorized as low (0–3 points), medium (4–7 points), or high-quality (8–11 points), in accordance with the most commonly used classification methods [29].
Statistical analysis
According to WHO’s recommendation on that adults should obtain at least 25 g dietary fiber per day from food [30], the original \documentclass[12pt]{minimal} \usepackage{amsmath} \usepackage{wasysym} \usepackage{amsfonts} \usepackage{amssymb} \usepackage{amsbsy} \usepackage{mathrsfs} \usepackage{upgreek} \setlength{\oddsidemargin}{-69pt} \begin{document}$$\:\beta\:$$\end{document} -coefficient corresponding to a 1 g/day dietary fiber as the unit of change was converted into an effect corresponding to a 25 g/day of dietary fiber as the unit of change. We used the pooled converted \documentclass[12pt]{minimal} \usepackage{amsmath} \usepackage{wasysym} \usepackage{amsfonts} \usepackage{amssymb} \usepackage{amsbsy} \usepackage{mathrsfs} \usepackage{upgreek} \setlength{\oddsidemargin}{-69pt} \begin{document}$$\:\beta\:$$\end{document} -coefficients values and their corresponding 95%CIs to synthesize the results of each study by inverse variance weighting through a random effects model. Sensitivity analyses were performed using the leave-one-out elimination method to assess the robustness of results. Given the significant impact of calcium and vitamin D on bone health [31], additional sensitivity analyses were conducted by excluding studies that did not adjust for these key confounders.
We comprehensively evaluated the heterogeneity among studies (between-study heterogeneity) through three methods. First, the \documentclass[12pt]{minimal} \usepackage{amsmath} \usepackage{wasysym} \usepackage{amsfonts} \usepackage{amssymb} \usepackage{amsbsy} \usepackage{mathrsfs} \usepackage{upgreek} \setlength{\oddsidemargin}{-69pt} \begin{document}$$I^{2}$$\end{document} statistic was used to quantify the proportion of total variation attributable to heterogeneity, and an \documentclass[12pt]{minimal} \usepackage{amsmath} \usepackage{wasysym} \usepackage{amsfonts} \usepackage{amssymb} \usepackage{amsbsy} \usepackage{mathrsfs} \usepackage{upgreek} \setlength{\oddsidemargin}{-69pt} \begin{document}$$\:{I}^{2}$$\end{document} < 25%, 25–50% and > 50% was considered as low, moderate and high heterogeneity, respectively [32]. Second, the restricted maximum-likelihood estimator of \documentclass[12pt]{minimal} \usepackage{amsmath} \usepackage{wasysym} \usepackage{amsfonts} \usepackage{amssymb} \usepackage{amsbsy} \usepackage{mathrsfs} \usepackage{upgreek} \setlength{\oddsidemargin}{-69pt} \begin{document}$$\:{\tau\:}^{2}$$\end{document} was used to assess the heterogeneity [33]. Third, Q-tests were used to obtain the corresponding \documentclass[12pt]{minimal} \usepackage{amsmath} \usepackage{wasysym} \usepackage{amsfonts} \usepackage{amssymb} \usepackage{amsbsy} \usepackage{mathrsfs} \usepackage{upgreek} \setlength{\oddsidemargin}{-69pt} \begin{document}$$\:P$$\end{document} -values. For meta-analyses involving fewer than 5 studies, we adopted the Hartung-Knap-Sidik-Jonkman (HKSJ) method to reduce the type I error rates [34].
Existing evidence suggests that the effects of nutrients on BMD are influenced by multiple key characteristics, such as ethnicity, levels of socio-economic development, and dietary patterns [9, 35–37], and may vary depending on BMD measurement site and dietary assessment methods [24, 38, 39]. Therefore, subgroup analyses were performed based on (1) BMD site (femoral neck vs. lumbar spine vs. hip), (2) sex (female vs. male), (3) regions (Europe and America vs. other), and (4) dietary assessment method (Food Frequency Questionnaire [FFQ] vs. 24 h-recall) to explore factors that might influence the association between dietary fiber intake and BMD. Publication bias was assessed using funnel plots and Begg’s tests. Statistical analyses and forest plots were conducted using software R version 4.3.2. A \documentclass[12pt]{minimal} \usepackage{amsmath} \usepackage{wasysym} \usepackage{amsfonts} \usepackage{amssymb} \usepackage{amsbsy} \usepackage{mathrsfs} \usepackage{upgreek} \setlength{\oddsidemargin}{-69pt} \begin{document}$$\:P$$\end{document} -value < 0.05 was considered statistically significant.
Results
Literature search and selection
The flowchart of study selection is presented in Fig. 1. Initially, our comprehensive search retrieved a total of 736 records; after duplicate removal, 479 records remained for title and abstract screening. From these records, 66 reports were further reviewed for full-texts and assessed for eligibility. Ultimately, 6 original studies were included in our systematic review and meta-analysis. Detailed justifications for each excluded full-text report are provided in Supplementary Table S2.Fig. 1. The overall flowchart of identification, screening and inclusion of studies
Study characteristics
Characteristics extracted from the included studies are summarized in Table 1. Notably, Rivera-Paredez’s study comprised two parts with distinct outcomes – a cross-sectional part reporting BMD and a longitudinal part reporting BMD change. Therefore, these two parts were treated as two separate studies. We ultimately included six articles involving seven studies, of which four studies reported BMD, one BMD change, 1% BMD change, and one T-score. Four studies reporting BMD as outcomes were included into meta-analysis, while the other three studies with slightly different outcomes were reviewed qualitatively.
Table 1. Characteristics of included studiesFirstauthorYearCountrySubjectsexSample sizeMale (%)Age(mean ± SD or m, Q1-Q3 or range), yNutrientOutcomeCovariatesQuality scoreDaily intake(mean ± SD or m, Q1-Q3),g/dMeasurementTypeSiteMeasurementLushuang Zhang^2^2024USAFemale28290.061.14 ± 0.2315.61 ± 0.3124-hr dietary recall dataBMD^1^Femoral neck,DXA^1^Age, race, education, marriage, poverty-to-income ratio, physical activity, hypertension, previous fracture, BMI^1^, circumference, cotinine, protein intake, history of physician-diagnosed osteoporosis or osteoporosis treatment, estrogens treatment, and total energy9Total femurB.Rivera-Paredez(A^2,3^2023MexicoFemale9900.046,37–5525.9,(18.8–35.3)FFQ^1^BMD,Femoral neck,DXAAge (years), BMI; energy intake, diabetes, smoking status, leisure-time physical activity, calcium intake, calcium supplements, vitamin D intake, UA levels^1^,alcohol intake, HRT^1^, caffeine intake9BMD changeLumbar spine,HipB.Rivera-Paredez(B^2,3^2023MexicoMale327100.045,36–5424.8,(18.1–34.1)FFQBMD,Femoral neck,DXAAge (years), BMI; energy intake, diabetes, smoking status, leisure-time physical activity, calcium intake, calcium supplements, vitamin D intake, UA levels,alcohol intake, caffeine intake9BMD changeLumbar spine,HipTao Zhou^2^2021UKFemale & Male224,63046.056.8 ± 8.014.2 ± 6.1Touchscreen dietary questionnaireBMDHeelUltrasoundAge, sex, assessment center, BMI, deprivation status, physical activity, smoking status, alcohol intake, dietary calcium intake, dietary vitamin D intake, and total energy intake9Taehoon Lee(A^2^2019South KoreaFemale3190.0> 655.31 ± 0.1924-hr dietary recall dataBMDFemoral neck,DXAAge, BMI, serum vitamin D level, cigarette smoking, physical activity, alcohol use, daily consumption of carbohydrate, protein, fat, calcium, phosphate, iron, thiamine, riboflavin, niacin, and vitamin C, HRT7Lumbar spine,Total femurTaehoon Lee(B^2^2019South KoreaMale244100.0> 659.87 ± 2.3324-hr dietary recall dataBMDFemoral neck,DXAAge, BMI, serum vitamin D level, cigarette smoking, physical activity, alcohol use, daily consumption of carbohydrate, protein, fat, calcium, phosphate, iron, thiamine, riboflavin, niacin, and vitamin C7Lumbar spine,Total femurZhaoli Dai(A^3^2018USAFemale1,0650.0057.3 ± 9.019.50 ± 8.10FFQ%ΔBMD^1^Femoral neck,DXAExam period, total energy intake, age, BMI, height, current cigarette smoking, physical activity, modified DGAI 2010 excluding fiber component, calcium supplement intake, vitamin D supplement intake, caffeine intake, dietary calcium, dietary vitamin D, menopausal status, current estrogen use8Lumbar spine,TrochanterZhaoli Dai(B^3^2018USAMale792100.058.1 ± 8.919.70 ± 7.90FFQ%ΔBMDFemoral neck,DXAExam period, total energy intake, age, BMI, height, current cigarette smoking, physical activity, modified DGAI 2010 excluding fiber component, calcium supplement intake, vitamin D supplement intake, caffeine intake, dietary calcium, dietary vitamin D, menopausal status, current estrogen use8Lumbar spine,TrochanterLuWei Li^3^2023USAFemale & Male9,87154.350–8015.20 ± 9.8424-hr dietary recall dataT-scoreFemoral neck,DXASex, age, family history, height, weight, BMI, caffeine intake, carbohydrate consumption, blood phosphorus, blood potassium, blood sodium6^1^BMD, bone mineral density; DXA, dual-energy X-ray absorptiometry; BMI, body mass index; FFQ, food frequency questionnaire; UA levels, uric acid levels; HRT, hormonal replacement therapy; %ΔBMD, percentage change in BMD^2^Included in meta-analysis^3^Included in qualitative review
Of the four studies (all with cross-sectional design) involved in the meta-analysis, two reported effects separately for males and females and were therefore treated as independent data points. With a total of six data points, these four studies involved 223,339 individuals (45.3% males; 56.8 \documentclass[12pt]{minimal} \usepackage{amsmath} \usepackage{wasysym} \usepackage{amsfonts} \usepackage{amssymb} \usepackage{amsbsy} \usepackage{mathrsfs} \usepackage{upgreek} \setlength{\oddsidemargin}{-69pt} \begin{document}$$\:\pm\:$$\end{document} 8.05 years). Specifically, one study was conducted in the US, one in Mexico, one in South Korea, and one in the UK. For the measurement of BMD, three studies used dual-energy X-ray absorptiometry (DXA), a widely recognized standard method, and one used ultrasound. For the measurement of dietary fiber, two studies used the 24-hour dietary recall, one used FFQ, and one used the touchscreen dietary questionnaire following the FFQ design [40, 41].
Three studies were involved in the qualitative review. The two cohort studies were conducted in the US and Mexico, respectively, involving 3,174 individuals (35.3% males; 52.7 \documentclass[12pt]{minimal} \usepackage{amsmath} \usepackage{wasysym} \usepackage{amsfonts} \usepackage{amssymb} \usepackage{amsbsy} \usepackage{mathrsfs} \usepackage{upgreek} \setlength{\oddsidemargin}{-69pt} \begin{document}$$\:\pm\:$$\end{document} 12.5 years). One cross-sectional study was conducted in the US, involving 9871 individuals (54.3% males; 50–80 years). For the measurement of BMD changes or T-scores, all studies used DXA. For the measurement of dietary fiber, two studies used FFQ and one used the 24-hour dietary recall.
Risk of bias assessment
Table 1 summarizes the risk of bias assessment for the included studies, with additional details available in Supplementary Tables S3 and S4. All literature was considered of satisfactory quality according to our predefined classification thresholds (at least “moderate”, 100%). Cohort studies were scored between 8 and 9, with primary sources of risk of bias derived from poorly defined baseline outcomes or insufficient follow-up information. Cross-sectional studies were scored between 6 and 9, with primary sources of risk of bias derived from inadequate reporting of missing data handling or no assessment undertaken for quality assurance purposes.
Association between dietary fiber intake and bone mineral density
Results of the overall meta-analysis are presented in Fig. 2. A significant positive association was found between dietary fiber intake and BMD level ( \documentclass[12pt]{minimal} \usepackage{amsmath} \usepackage{wasysym} \usepackage{amsfonts} \usepackage{amssymb} \usepackage{amsbsy} \usepackage{mathrsfs} \usepackage{upgreek} \setlength{\oddsidemargin}{-69pt} \begin{document}$$\:\beta\:$$\end{document} = 0.013, 95%CI = 0.011–0.015, \documentclass[12pt]{minimal} \usepackage{amsmath} \usepackage{wasysym} \usepackage{amsfonts} \usepackage{amssymb} \usepackage{amsbsy} \usepackage{mathrsfs} \usepackage{upgreek} \setlength{\oddsidemargin}{-69pt} \begin{document}$$\:P$$\end{document} < 0.01; \documentclass[12pt]{minimal} \usepackage{amsmath} \usepackage{wasysym} \usepackage{amsfonts} \usepackage{amssymb} \usepackage{amsbsy} \usepackage{mathrsfs} \usepackage{upgreek} \setlength{\oddsidemargin}{-69pt} \begin{document}$$\:{\tau\:}^{2}$$\end{document} = 0.00; \documentclass[12pt]{minimal} \usepackage{amsmath} \usepackage{wasysym} \usepackage{amsfonts} \usepackage{amssymb} \usepackage{amsbsy} \usepackage{mathrsfs} \usepackage{upgreek} \setlength{\oddsidemargin}{-69pt} \begin{document}$$\:{I}^{2}$$\end{document} = 0.00%; \documentclass[12pt]{minimal} \usepackage{amsmath} \usepackage{wasysym} \usepackage{amsfonts} \usepackage{amssymb} \usepackage{amsbsy} \usepackage{mathrsfs} \usepackage{upgreek} \setlength{\oddsidemargin}{-69pt} \begin{document}$$\:{P}_{Q-test}$$\end{document} = 0.86). The association remained significant even in sensitivity analysis excluding studies not adjusting for calcium or vitamin D ( \documentclass[12pt]{minimal} \usepackage{amsmath} \usepackage{wasysym} \usepackage{amsfonts} \usepackage{amssymb} \usepackage{amsbsy} \usepackage{mathrsfs} \usepackage{upgreek} \setlength{\oddsidemargin}{-69pt} \begin{document}$$\:\beta\:$$\end{document} = 0.014, 95%CI = 0.009–0.019, \documentclass[12pt]{minimal} \usepackage{amsmath} \usepackage{wasysym} \usepackage{amsfonts} \usepackage{amssymb} \usepackage{amsbsy} \usepackage{mathrsfs} \usepackage{upgreek} \setlength{\oddsidemargin}{-69pt} \begin{document}$$\:P$$\end{document} < 0.01; \documentclass[12pt]{minimal} \usepackage{amsmath} \usepackage{wasysym} \usepackage{amsfonts} \usepackage{amssymb} \usepackage{amsbsy} \usepackage{mathrsfs} \usepackage{upgreek} \setlength{\oddsidemargin}{-69pt} \begin{document}$$\:{\tau\:}^{2}$$\end{document} = 0.00; \documentclass[12pt]{minimal} \usepackage{amsmath} \usepackage{wasysym} \usepackage{amsfonts} \usepackage{amssymb} \usepackage{amsbsy} \usepackage{mathrsfs} \usepackage{upgreek} \setlength{\oddsidemargin}{-69pt} \begin{document}$$\:{I}^{2}$$\end{document} = 0.00%; \documentclass[12pt]{minimal} \usepackage{amsmath} \usepackage{wasysym} \usepackage{amsfonts} \usepackage{amssymb} \usepackage{amsbsy} \usepackage{mathrsfs} \usepackage{upgreek} \setlength{\oddsidemargin}{-69pt} \begin{document}$$\:{P}_{Q-test}$$\end{document} = 0.74). Leave-one-out sensitivity analysis confirmed the robustness of results (Supplementary Figure S1). Despite the funnel plot exhibited a non-symmetric distribution, Begg’s test indicated a lack of publication bias ( \documentclass[12pt]{minimal} \usepackage{amsmath} \usepackage{wasysym} \usepackage{amsfonts} \usepackage{amssymb} \usepackage{amsbsy} \usepackage{mathrsfs} \usepackage{upgreek} \setlength{\oddsidemargin}{-69pt} \begin{document}$$\:P$$\end{document} = 0.12) (Fig. 3).Fig. 2. Forest plots of the primary meta-analyses. A: The overall meta-analysis of all included studies. B: The meta-analysis excluding studies that did not adjust for calcium and vitamin D. Abbreviations – 95%CI, 95% confidence intervals; HK, Hartung Knapp methodmeta-analyses Fig. 3. Funnel plots of dietary fiber and BMD
Subgroup analysis
Details of the subgroup analysis are summarized in Table 2 and Supplementary Figs. S2-S5. Despite effect sizes varied by BMD measurement site, sex and dietary assessment method, subgroup analysis confirmed none as a source of heterogeneity in the association between dietary fiber intake and BMD ( \documentclass[12pt]{minimal} \usepackage{amsmath} \usepackage{wasysym} \usepackage{amsfonts} \usepackage{amssymb} \usepackage{amsbsy} \usepackage{mathrsfs} \usepackage{upgreek} \setlength{\oddsidemargin}{-69pt} \begin{document}$$\:{P}_{interaction}$$\end{document} = 0.31, 0.86 and 0.68, respectively). For sites, despite the effect size being the strongest at lumbar spine ( \documentclass[12pt]{minimal} \usepackage{amsmath} \usepackage{wasysym} \usepackage{amsfonts} \usepackage{amssymb} \usepackage{amsbsy} \usepackage{mathrsfs} \usepackage{upgreek} \setlength{\oddsidemargin}{-69pt} \begin{document}$$\:\beta\:$$\end{document} = 0.025, 95%CI = \documentclass[12pt]{minimal} \usepackage{amsmath} \usepackage{wasysym} \usepackage{amsfonts} \usepackage{amssymb} \usepackage{amsbsy} \usepackage{mathrsfs} \usepackage{upgreek} \setlength{\oddsidemargin}{-69pt} \begin{document}$$\:-$$\end{document} 0.049–0.099, \documentclass[12pt]{minimal} \usepackage{amsmath} \usepackage{wasysym} \usepackage{amsfonts} \usepackage{amssymb} \usepackage{amsbsy} \usepackage{mathrsfs} \usepackage{upgreek} \setlength{\oddsidemargin}{-69pt} \begin{document}$$\:P$$\end{document} = 0.36), statistically significance was observed only at femoral neck ( \documentclass[12pt]{minimal} \usepackage{amsmath} \usepackage{wasysym} \usepackage{amsfonts} \usepackage{amssymb} \usepackage{amsbsy} \usepackage{mathrsfs} \usepackage{upgreek} \setlength{\oddsidemargin}{-69pt} \begin{document}$$\:\beta\:$$\end{document} = 0.018, 95%CI = 0.007–0.030, \documentclass[12pt]{minimal} \usepackage{amsmath} \usepackage{wasysym} \usepackage{amsfonts} \usepackage{amssymb} \usepackage{amsbsy} \usepackage{mathrsfs} \usepackage{upgreek} \setlength{\oddsidemargin}{-69pt} \begin{document}$$\:P$$\end{document} = 0.01). For sex, the protective effect seemed to be more pronounced in males ( \documentclass[12pt]{minimal} \usepackage{amsmath} \usepackage{wasysym} \usepackage{amsfonts} \usepackage{amssymb} \usepackage{amsbsy} \usepackage{mathrsfs} \usepackage{upgreek} \setlength{\oddsidemargin}{-69pt} \begin{document}$$\:\beta\:$$\end{document} = 0.016, 95%CI = 0.014–0.019, \documentclass[12pt]{minimal} \usepackage{amsmath} \usepackage{wasysym} \usepackage{amsfonts} \usepackage{amssymb} \usepackage{amsbsy} \usepackage{mathrsfs} \usepackage{upgreek} \setlength{\oddsidemargin}{-69pt} \begin{document}$$\:P$$\end{document} < 0.01) compared to females ( \documentclass[12pt]{minimal} \usepackage{amsmath} \usepackage{wasysym} \usepackage{amsfonts} \usepackage{amssymb} \usepackage{amsbsy} \usepackage{mathrsfs} \usepackage{upgreek} \setlength{\oddsidemargin}{-69pt} \begin{document}$$\:\beta\:$$\end{document} = 0.015, 95%CI = \documentclass[12pt]{minimal} \usepackage{amsmath} \usepackage{wasysym} \usepackage{amsfonts} \usepackage{amssymb} \usepackage{amsbsy} \usepackage{mathrsfs} \usepackage{upgreek} \setlength{\oddsidemargin}{-69pt} \begin{document}$$\:-$$\end{document} 0.001–0.031, \documentclass[12pt]{minimal} \usepackage{amsmath} \usepackage{wasysym} \usepackage{amsfonts} \usepackage{amssymb} \usepackage{amsbsy} \usepackage{mathrsfs} \usepackage{upgreek} \setlength{\oddsidemargin}{-69pt} \begin{document}$$\:P$$\end{document} = 0.06). For dietary assessment method, directionally consistent results were observed for 24-hour dietary recall ( \documentclass[12pt]{minimal} \usepackage{amsmath} \usepackage{wasysym} \usepackage{amsfonts} \usepackage{amssymb} \usepackage{amsbsy} \usepackage{mathrsfs} \usepackage{upgreek} \setlength{\oddsidemargin}{-69pt} \begin{document}$$\:\beta\:$$\end{document} = 0.017, 95% CI = \documentclass[12pt]{minimal} \usepackage{amsmath} \usepackage{wasysym} \usepackage{amsfonts} \usepackage{amssymb} \usepackage{amsbsy} \usepackage{mathrsfs} \usepackage{upgreek} \setlength{\oddsidemargin}{-69pt} \begin{document}$$\:-$$\end{document} 0.017–0.051, \documentclass[12pt]{minimal} \usepackage{amsmath} \usepackage{wasysym} \usepackage{amsfonts} \usepackage{amssymb} \usepackage{amsbsy} \usepackage{mathrsfs} \usepackage{upgreek} \setlength{\oddsidemargin}{-69pt} \begin{document}$$\:P$$\end{document} = 0.16) and FFQ ( \documentclass[12pt]{minimal} \usepackage{amsmath} \usepackage{wasysym} \usepackage{amsfonts} \usepackage{amssymb} \usepackage{amsbsy} \usepackage{mathrsfs} \usepackage{upgreek} \setlength{\oddsidemargin}{-69pt} \begin{document}$$\:\beta\:$$\end{document} = 0.014, 95% CI = 0.004–0.024, \documentclass[12pt]{minimal} \usepackage{amsmath} \usepackage{wasysym} \usepackage{amsfonts} \usepackage{amssymb} \usepackage{amsbsy} \usepackage{mathrsfs} \usepackage{upgreek} \setlength{\oddsidemargin}{-69pt} \begin{document}$$\:P$$\end{document} = 0.03), while statistically significant result was only observed in the latter.
Table 2. Subgroup analysis for studies included in the analysisSubgroup analysis N ^1^ Sample sizeEffect size (95%CI^1^)I^2^ (%)τ^2^ P interaction Sites of outcomesFemoral neck54,7090.018(0.007,0.030)0.00< 0.010.31Lumbar spine41,8800.025(-0.049,0.099)0.00< 0.01Hip21,3170.009(-0.052,0.070)0.000.00SexFemale4125,4330.015(-0.001,0.031)0.00< 0.010.86Male3103,9060.016(0.014,0.019)0.000.00RegionEurope and America2227,4590.013(0.012,0.014)0.00< 0.010.02Other41,8800.024(0.008,0.040)0.00< 0.01Dietary assessment method24-hr dietary recall333,920.017(-0.017,0.051)0.00< 0.010.68FFQ^2^3225,9470.014(0.004,**0.024)**0.00< 0.01^1^N, number of studies; 95% CI, 95% confidence intervals.^2^FFQ, food frequency questionnaire.
Region was the only source of heterogeneity ( \documentclass[12pt]{minimal} \usepackage{amsmath} \usepackage{wasysym} \usepackage{amsfonts} \usepackage{amssymb} \usepackage{amsbsy} \usepackage{mathrsfs} \usepackage{upgreek} \setlength{\oddsidemargin}{-69pt} \begin{document}$$\:{P}_{interaction}$$\end{document} = 0.02). Results of the other region ( \documentclass[12pt]{minimal} \usepackage{amsmath} \usepackage{wasysym} \usepackage{amsfonts} \usepackage{amssymb} \usepackage{amsbsy} \usepackage{mathrsfs} \usepackage{upgreek} \setlength{\oddsidemargin}{-69pt} \begin{document}$$\:\beta\:$$\end{document} = 0.024, 95%CI = 0.008–0.040, \documentclass[12pt]{minimal} \usepackage{amsmath} \usepackage{wasysym} \usepackage{amsfonts} \usepackage{amssymb} \usepackage{amsbsy} \usepackage{mathrsfs} \usepackage{upgreek} \setlength{\oddsidemargin}{-69pt} \begin{document}$$\:P$$\end{document} = 0.02) showed a stronger effect compared to results of the Europe and America region ( \documentclass[12pt]{minimal} \usepackage{amsmath} \usepackage{wasysym} \usepackage{amsfonts} \usepackage{amssymb} \usepackage{amsbsy} \usepackage{mathrsfs} \usepackage{upgreek} \setlength{\oddsidemargin}{-69pt} \begin{document}$$\:\beta\:$$\end{document} = 0.013, 95%CI = 0.012–0.014, \documentclass[12pt]{minimal} \usepackage{amsmath} \usepackage{wasysym} \usepackage{amsfonts} \usepackage{amssymb} \usepackage{amsbsy} \usepackage{mathrsfs} \usepackage{upgreek} \setlength{\oddsidemargin}{-69pt} \begin{document}$$\:P$$\end{document} < 0.01).
Qualitative review
The quantitative results of the meta-analysis suggested a beneficial role of dietary fiber intake on BMD. Such a finding was supported by a study of cross-sectional design but with a special focus on a binary T-score (< \documentclass[12pt]{minimal} \usepackage{amsmath} \usepackage{wasysym} \usepackage{amsfonts} \usepackage{amssymb} \usepackage{amsbsy} \usepackage{mathrsfs} \usepackage{upgreek} \setlength{\oddsidemargin}{-69pt} \begin{document}$$\:\:-$$\end{document} 1, indicating BMD abnormality) as the outcome. This study involved 9,871 individuals and reported a modest positive association between dietary fiber intake and the T-score of femoral neck ( \documentclass[12pt]{minimal} \usepackage{amsmath} \usepackage{wasysym} \usepackage{amsfonts} \usepackage{amssymb} \usepackage{amsbsy} \usepackage{mathrsfs} \usepackage{upgreek} \setlength{\oddsidemargin}{-69pt} \begin{document}$$\:OR$$\end{document} = 0.986, 95%CI = 0.980–0.992, \documentclass[12pt]{minimal} \usepackage{amsmath} \usepackage{wasysym} \usepackage{amsfonts} \usepackage{amssymb} \usepackage{amsbsy} \usepackage{mathrsfs} \usepackage{upgreek} \setlength{\oddsidemargin}{-69pt} \begin{document}$$\:P<$$\end{document} 0.01).
Furthermore, the Framingham Offspring cohort followed 1,857 individuals (male-to-female ratio 1:1.2) for 12 years, measuring BMD at three sites (femoral neck, lumbar spine, and trochanter) and estimating the effect of dietary fiber intake on percentage BMD change (%ΔBMD) separately by sex. Among males, a significant protective effect was found at the femoral neck ( \documentclass[12pt]{minimal} \usepackage{amsmath} \usepackage{wasysym} \usepackage{amsfonts} \usepackage{amssymb} \usepackage{amsbsy} \usepackage{mathrsfs} \usepackage{upgreek} \setlength{\oddsidemargin}{-69pt} \begin{document}$$\:\beta\:$$\end{document} = 0.06, 95%CI = 0.021–0.099, \documentclass[12pt]{minimal} \usepackage{amsmath} \usepackage{wasysym} \usepackage{amsfonts} \usepackage{amssymb} \usepackage{amsbsy} \usepackage{mathrsfs} \usepackage{upgreek} \setlength{\oddsidemargin}{-69pt} \begin{document}$$\:P$$\end{document} = 0.003).
In contrast, another study of very similar design – the Health Worker cohort-based study followed 1317 individuals (male-to-female ratio 1:3) for 6 years and measured BMD at three sites (femoral neck, lumbar spine, and hip) – found a modest negative association between dietary fiber intake and BMD change at the femoral neck in males ( \documentclass[12pt]{minimal} \usepackage{amsmath} \usepackage{wasysym} \usepackage{amsfonts} \usepackage{amssymb} \usepackage{amsbsy} \usepackage{mathrsfs} \usepackage{upgreek} \setlength{\oddsidemargin}{-69pt} \begin{document}$$\:\beta\:$$\end{document} = \documentclass[12pt]{minimal} \usepackage{amsmath} \usepackage{wasysym} \usepackage{amsfonts} \usepackage{amssymb} \usepackage{amsbsy} \usepackage{mathrsfs} \usepackage{upgreek} \setlength{\oddsidemargin}{-69pt} \begin{document}$$\:-$$\end{document} 0.0007, 95%CI = \documentclass[12pt]{minimal} \usepackage{amsmath} \usepackage{wasysym} \usepackage{amsfonts} \usepackage{amssymb} \usepackage{amsbsy} \usepackage{mathrsfs} \usepackage{upgreek} \setlength{\oddsidemargin}{-69pt} \begin{document}$$\:-$$\end{document} 0.001~ \documentclass[12pt]{minimal} \usepackage{amsmath} \usepackage{wasysym} \usepackage{amsfonts} \usepackage{amssymb} \usepackage{amsbsy} \usepackage{mathrsfs} \usepackage{upgreek} \setlength{\oddsidemargin}{-69pt} \begin{document}$$\:-$$\end{document} 0.00008, \documentclass[12pt]{minimal} \usepackage{amsmath} \usepackage{wasysym} \usepackage{amsfonts} \usepackage{amssymb} \usepackage{amsbsy} \usepackage{mathrsfs} \usepackage{upgreek} \setlength{\oddsidemargin}{-69pt} \begin{document}$$\:P\:<$$\end{document} 0.05). For both cohort studies, no significant effect was found at any other site in males nor in females.
Discussion
To the best of our knowledge, this is the first systematic review and meta-analysis that quantifies the effect of dietary fiber intake on bone health as reflected by BMD. The final meta-analysis included 229,339 participants and demonstrated a higher level of dietary fiber intake to associate with an increased BMD. A possible tendency toward a stronger protective association was observed in males and populations outside Europe and America.
Our overall findings indicate that higher dietary fiber intake is associated with higher BMD. Importantly, we confirmed the results not to be confounded by calcium and vitamin D consumption, as the sensitivity analysis excluding studies lacking relevant adjustments did not alter the results substantially. These findings provide a robust evidence base to inform clinical decision-making and policy development. Moreover, the protective role of dietary fiber is further supported by additional epidemiological evidence, even when the outcomes extended to %ΔBMD and T-score. Evidence synthesized from longitudinal studies suggests that the protective effect is likely to be maintained over a longer period.
Our results indicate that the protective effect of dietary fiber on BMD is more pronounced in specific measurement site and sex. Despite a consistent positive relationship between dietary fiber intake and BMD being observed across all measurement sites, statistical significance was only reached at the femoral neck. This may be due to the relatively limited sample sizes available for lumbar spine or hip ( \documentclass[12pt]{minimal} \usepackage{amsmath} \usepackage{wasysym} \usepackage{amsfonts} \usepackage{amssymb} \usepackage{amsbsy} \usepackage{mathrsfs} \usepackage{upgreek} \setlength{\oddsidemargin}{-69pt} \begin{document}$$\:{N}_{lumbar-spine}$$\end{document} = 1,880; \documentclass[12pt]{minimal} \usepackage{amsmath} \usepackage{wasysym} \usepackage{amsfonts} \usepackage{amssymb} \usepackage{amsbsy} \usepackage{mathrsfs} \usepackage{upgreek} \setlength{\oddsidemargin}{-69pt} \begin{document}$$\:{N}_{hip}$$\end{document} = 1,317) compared to femoral neck ( \documentclass[12pt]{minimal} \usepackage{amsmath} \usepackage{wasysym} \usepackage{amsfonts} \usepackage{amssymb} \usepackage{amsbsy} \usepackage{mathrsfs} \usepackage{upgreek} \setlength{\oddsidemargin}{-69pt} \begin{document}$$\:{N}_{femoral-neck}$$\end{document} = 4,709), which likely affected the statistical power. The association between dietary fiber intake and BMD was stronger in males than in females, possibly because menopausal estrogen decline accelerates bone loss and weakens bone structure, thereby diminishing the benefits of dietary fiber on BMD [42]. The positive association was statistically significant only within the FFQ subgroup, both a larger sample size ( \documentclass[12pt]{minimal} \usepackage{amsmath} \usepackage{wasysym} \usepackage{amsfonts} \usepackage{amssymb} \usepackage{amsbsy} \usepackage{mathrsfs} \usepackage{upgreek} \setlength{\oddsidemargin}{-69pt} \begin{document}$$\:{N}_{FFQ}$$\end{document} = 225,947; \documentclass[12pt]{minimal} \usepackage{amsmath} \usepackage{wasysym} \usepackage{amsfonts} \usepackage{amssymb} \usepackage{amsbsy} \usepackage{mathrsfs} \usepackage{upgreek} \setlength{\oddsidemargin}{-69pt} \begin{document}$$\:{N}_{24h-recall}$$\end{document} = 3,392) and a long-term adherence may have contributed to this difference. In addition, the protective effect of dietary fiber on BMD also varied by regions. This may be due to the pronounced regional differences in genetic backgrounds that influence BMD [37]. Moreover, the typical western dietary pattern – high in processed foods, fats, and sweets – can negatively impact BMD by altering the gut microbiome [9]. Similarly, the protective effects of vitamin D3 and vitamin K on BMD are weaker or even non-significant in Caucasian populations compared to other populations [43, 44], suggesting that genetics and dietary patterns may modify nutrient efficacy.
Although the underlying mechanisms remain unclear, dietary fiber – a well-established prebiotic – likely exerts its effects by modulating the gut microbiota. Research has shown that consuming prebiotic fibers alters the composition of gut microbial community, increasing the abundance of specific bacteria such as Lachnospiraceae and Bacteroides [10, 45]. These bacteria ferment dietary fiber to produce short-chain fatty acids (SCFAs), which acidify the intestinal lumen to enhance calcium solubility but may also facilitate calcium absorption by stimulating transcellular transport processes and promoting intestinal morphological adaptations [46, 47]. Additionally, probiotics enhanced by dietary fiber may benefit bone health by supporting maintain a stable bone microenvironment. The underlying mechanisms include synthesizing vitamin K_2_ to promote osteocalcin carboxylation, producing SCFAs to inhibit the NF-κB pathway and reduce osteoclastogenesis, and suppressing the release of bone-resorptive factors (e.g., IL-1β) from macrophages [15, 16]. It is important to note that these processes take time to manifest; therefore, protective effects mediated via the gut-bone axis require prolonged accumulation before becoming observable [17, 18]. This likely explains why the protective effects of dietary fiber on BMD were only identified in the cohort study [25] with an extended follow-up period.
Our findings have significant public health implications. Increasing dietary fiber intake from daily diets benefit BMD, particularly among males and populations outside Europe and America. It is well-recognized that whole-food-derived dietary fiber offers greater benefits in reducing chronic disease risk than that derived from foods fractionated ingredients [48]. Our research thus provides a safe and accessible prevention strategy for populations at high risk of osteoporosis, while expanding the potential health applications of dietary fiber. The results of this meta-analysis offer robust evidence to inform public health policy, health education, and personalized nutritional interventions.
Several limitations should be noted. First, the biological effects of dietary fiber on BMD may vary slightly depending on its food source [22, 25]. Although two studies have examined the impact of dietary fiber from different food sources, their inconsistent outcomes prevented a unified quantitative analysis. Therefore, total dietary fiber intake was chosen as the primary focus of analysis to guarantee sufficient statistical power and to minimize bias. Second, since all studies included in this meta-analysis employed a cross-sectional design, our findings imply an association rather than causation. Third, crucial confounders related to diet and BMD – such as sun exposure and previous fractures – were largely unassessed due to insufficient reporting in most studies. To mitigate this limitation, we incorporated results from the most fully adjusted models available in each study. Fourth, Zhou’s study differed significantly from the other studies included in this meta-analysis in terms of sample size, dietary assessment and BMD measurement method. We attempted to minimize the influence induced by such differences through performing a leave-one-out sensitivity analysis. Results of the sensitivity analysis confirmed the robustness of our main findings. Fifth, although the region-stratified analysis showed variation in the magnitude of associations across subgroups, these findings should be interpreted with caution due to the limited number of studies included in each subgroup.
Conclusion
This systematic review and meta-analysis of population-based observational studies indicates that higher dietary fiber intake significantly promotes BMD in adults, particularly among males and populations outside Europe and America. Our study not only bridges the gap in quantitative evidence regarding the dietary fiber-BMD relationship but also suggests a potentially stronger positive association between dietary fiber and bone health in specific populations, providing a direction for future targeted interventions. Further large-scale prospective cohort studies are needed to validate these findings.
Supplementary Information
Below is the link to the electronic supplementary material.
Supplementary Material 1