Dynamic changes in serum IL-6, TNF-α, and β₂-microglobulin as early predictors of post-treatment relapse in lymphoma: a prospective cohort study
Yuhao Ma, Jianqiang Song, Chunmeng Song, Xiaolin Zhang

TL;DR
Tracking changes in IL-6, TNF-α, and β₂-microglobulin after lymphoma treatment can help predict relapse earlier than imaging.
Contribution
This study shows that dynamic changes in three serum biomarkers can predict lymphoma relapse before it is visible on imaging.
Findings
β₂-microglobulin had the strongest individual predictive value (AUC = 0.85).
A combined model of IL-6 + TNF-α + β₂-microglobulin achieved higher discrimination (AUC = 0.91).
Higher biomarker levels were associated with shorter relapse-free survival.
Abstract
Early identification of relapse after first-line chemotherapy remains a major challenge in lymphoma management. Conventional imaging provides limited sensitivity for minimal residual disease and cannot detect early biochemical changes. This prospective cohort study evaluated whether dynamic changes in serum IL-6, TNF-α, and β₂-microglobulin (β₂-MG) can serve as early predictors of relapse. A total of 260 patients with pathologically confirmed lymphoma who completed standard chemotherapy were enrolled and followed longitudinally. Serum IL-6, TNF-α, and β₂-MG were measured at T1 (end of chemotherapy), T2 (3 months post-treatment), and T3 (6 months post-treatment). Logistic regression, ROC analysis, Kaplan–Meier curves, and Cox proportional hazards models were used to assess predictive performance. During follow-up, 78 patients (30.0%) experienced relapse. All three biomarkers were…
Genes, proteins, chemicals, diseases, species, mutations and cell lines named across the full text — each resolved to its canonical identifier and authoritative record.
Click any figure to enlarge with its caption.
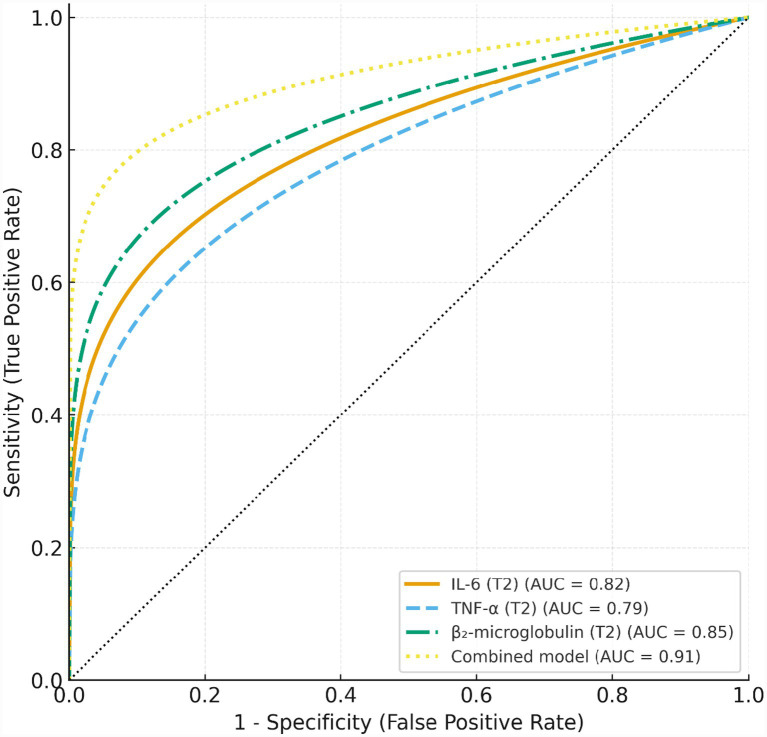 Figure 1
| Characteristic | Total ( | Relapse ( | Non-relapse ( | |
|---|---|---|---|---|
| Age, years, mean ± SD | 55.72 ± 11.70 | 53.20 ± 12.10 | 56.80 ± 11.50 | 0.045 |
| Male sex, | 150 (57.69) | 50 (64.10) | 100 (54.95) | 0.180 |
| BMI, kg/m2, mean ± SD | 24.01 ± 3.05 | 23.80 ± 3.20 | 24.10 ± 3.00 | 0.421 |
| Pathological subtype, |
| |||
| Diffuse large B-cell lymphoma | 150 (57.69) | 50 (64.10) | 100 (54.95) | |
| T-cell lymphomas† | 50 (19.23) | 15 (19.23) | 35 (19.23) | |
| Follicular lymphoma | 30 (11.54) | 8 (10.26) | 22 (12.09) | |
| Marginal zone lymphoma | 18 (6.92) | 5 (6.41) | 13 (7.14) | |
| Mantle cell lymphoma | 12 (4.62) | 2 (2.56) | 10 (5.49) | |
| Ann Arbor stage III–IV, | 150 (57.69) | 60 (76.92) | 90 (49.45) | < |
| High IPI score (3–5), | 105 (40.38) | 45 (57.69) | 60 (32.97) | < |
| B symptoms, | 90 (34.62) | 40 (51.28) | 50 (27.47) | < |
| LDH, U/L, mean ± SD | 268.43 ± 88.50 | 310.50 ± 95.30 | 250.40 ± 80.20 |
|
| β₂-microglobulin, mg/L, mean ± SD | 3.34 ± 1.08 | 3.90 ± 1.20 | 3.10 ± 1.00 |
|
| Lymphocyte count, ×109/L, mean ± SD | 1.43 ± 0.49 | 1.25 ± 0.45 | 1.50 ± 0.50 |
|
| R-CHOP–based regimen, | 215 (82.69) | 60 (76.92) | 155 (85.16) | 0.120 |
| Number of chemotherapy cycles, mean ± SD | 6.34 ± 0.87 | 6.20 ± 1.00 | 6.40 ± 0.80 | 0.083 |
| Autologous stem cell transplantation, | 80 (30.77) | 20 (25.64) | 60 (32.97) | 0.230 |
| Biomarker | Time point | Relapse ( | Non-relapse ( | |
|---|---|---|---|---|
| IL-6 (pg/mL) | T1 | 12.73 ± 4.18 | 9.47 ± 3.31 | <0.001 |
| T2 | 15.84 ± 4.96 | 10.36 ± 3.44 | <0.001 | |
| T3 | 18.59 ± 5.47 | 11.12 ± 3.87 | <0.001 | |
| TNF-α (pg/mL) | T1 | 19.63 ± 6.33 | 15.27 ± 5.14 | <0.001 |
| T2 | 23.92 ± 7.18 | 16.51 ± 5.48 | <0.001 | |
| T3 | 27.84 ± 7.82 | 17.46 ± 6.12 | <0.001 | |
| β₂-microglobulin (mg/L) | T1 | 3.87 ± 1.17 | 3.12 ± 0.97 | 0.002 |
| T2 | 4.54 ± 1.28 | 3.27 ± 1.05 | <0.001 | |
| T3 | 5.16 ± 1.41 | 3.34 ± 1.08 | <0.001 |
| Variable | Univariate OR (95% CI) | Multivariate OR (95% CI) | ||
|---|---|---|---|---|
| IL-6 at T2 (per 1 pg/mL) | 1.12 (1.08–1.17) | <0.001 | 1.08 (1.03–1.14) | 0.001 |
| TNF-α at T2 (per 1 pg/mL) | 1.06 (1.03–1.09) | <0.001 | 1.03 (0.99–1.07) | 0.118 |
| β₂-microglobulin at T2 (per 1 mg/L) | 1.55 (1.28–1.88) | <0.001 | 1.38 (1.11–1.72) | 0.003 |
| ΔIL-6 (T2–T1) | 1.21 (1.11–1.32) | <0.001 | — | — |
| Δβ₂-microglobulin (T2–T1) | 1.34 (1.12–1.60) | 0.001 | — | — |
| Ann Arbor stage III–IV | 2.40 (1.45–3.97) | 0.001 | 1.71 (1.00–2.93) | 0.049 |
| High IPI score (3–5) | 2.20 (1.35–3.58) | 0.002 | 1.86 (1.09–3.19) | 0.023 |
| Autologous transplantation (Yes) | 0.78 (0.45–1.35) | 0.374 | 0.82 (0.45–1.49) | 0.517 |
| Age (per 1 year) | 1.01 (0.99–1.03) | 0.242 | 1.00 (0.98–1.03) | 0.811 |
| Sex (Male) | 1.32 (0.80–2.16) | 0.278 | — | — |
| Model | AUC (95% CI) | Sensitivity (%) | Specificity (%) | |
|---|---|---|---|---|
| IL-6 (T2) | 0.82 (0.76–0.88) | <0.001 | 74.4 | 78.0 |
| TNF-α (T2) | 0.79 (0.72–0.85) | <0.001 | 70.5 | 75.8 |
| β₂-microglobulin (T2) | 0.85 (0.79–0.90) | <0.001 | 77.0 | 80.2 |
| Combined model | 0.91 (0.87–0.95) | <0.001 | 84.6 | 86.3 |
| Variable | Adjusted HR (95% CI) | |
|---|---|---|
| High IL-6 (vs. Low) | 1.78 (1.20–2.64) | 0.004 |
| High TNF-α (vs. Low) | 1.52 (1.03–2.26) | 0.035 |
| High β₂-microglobulin (vs. Low) | 2.06 (1.36–3.11) | <0.001 |
| Ann Arbor stage III–IV | 1.63 (1.05–2.53) | 0.029 |
| High IPI score (3–5) | 1.71 (1.11–2.63) | 0.016 |
| Autologous transplantation (Yes) | 0.89 (0.52–1.53) | 0.676 |
| Age (per 1-year increase) | 1.01 (0.99–1.04) | 0.284 |
Peer Reviews
No public reviews on file for this paper yet. If you reviewed it on a platform where reviews are public (OpenReview, ICLR, NeurIPS, ICML), you can paste yours below so the community can read it here.
Videos
No videos yet. Explain this paper in a talk, walkthrough, or lecture? Add one.
Taxonomy
TopicsLymphoma Diagnosis and Treatment · CNS Lymphoma Diagnosis and Treatment · Inflammatory Biomarkers in Disease Prognosis
Introduction
Lymphoma represents one of the most common hematologic malignancies, encompassing both Hodgkin lymphoma (HL) and non-Hodgkin lymphoma (NHL) (1, 2). Among NHL subtypes, diffuse large B-cell lymphoma (DLBCL) is the most frequently diagnosed individual entity (3). Although immunochemotherapy regimens such as R-CHOP have substantially improved overall survival, 30–40% of patients still experience relapse or develop refractory disease after frontline treatment (4–6). Relapse remains a major clinical challenge. Therapeutic options after recurrence are limited, often costly, and associated with considerable toxicity (7, 8). Moreover, survival outcomes decline sharply following relapse, particularly among patients who recur within the first year after chemotherapy (9, 10). Therefore, accurately identifying patients at high risk of relapse after completing initial treatment is critical for optimizing follow-up strategies, guiding early intervention, and improving long-term prognosis (11).
Current post-treatment surveillance of lymphoma relies predominantly on imaging modalities such as CT and PET-CT (9, 10, 12). Despite their status as the clinical standard, imaging modalities are limited by long intervals, high cost and radiation, and inadequate sensitivity for detecting minimal residual disease (MRD) (13–15). As a result, early biochemical signs of recurrence may remain undetected until radiologic progression becomes evident (7, 8). Routine hematologic indicators, such as lactate dehydrogenase (LDH) and peripheral lymphocyte counts, provide limited predictive value because they are nonspecific, influenced by diverse physiological and inflammatory conditions, and typically rise only after clinically or imaging-confirmed relapse (16–18). Thus, there is a clear need for reliable and low-cost biomarkers that can dynamically signal tumor activity and enable earlier relapse detection (19, 20).
Inflammation plays a central role in lymphoma biology, and several circulating biomarkers may capture early tumor-driven immune dysregulation (21, 22). IL-6 is a key pro-inflammatory cytokine, promoting tumor cell proliferation, survival, and immune evasion; elevated IL-6 levels have been consistently associated with poor prognosis in lymphoma (23, 24). TNF-α, another critical inflammatory mediator, reflects activation of the tumor microenvironment and B-cell responses, and may serve as an indicator of immune imbalance and tumor burden (25–27). β₂-microglobulin (β₂-MG), a structural component of MHC class I, is one of the most established prognostic markers in lymphoid malignancies and reflects cellular turnover, tumor load, and immune activation (28, 29). Given their biological relevance and consistent associations with lymphoma progression, these three biomarkers represent promising candidates for sensitive and dynamic monitoring of relapse risk.
Although IL-6, TNF-α, and β₂-MG have been individually linked to lymphoma prognosis, several important gaps remain (24, 25, 27, 30, 31). Most existing studies are cross-sectional or assess only a single time point, making it impossible to evaluate dynamic biomarker changes in relation to relapse (26, 28, 29). Furthermore, the evidence is dominated by retrospective analyses, with little continuous monitoring during the critical post-chemotherapy period when relapse begins to emerge (23, 27). Consequently, it remains unclear whether early post-treatment biomarker trajectories can predict relapse and whether combined biomarker panels outperform single indicators. This study prospectively evaluated longitudinal changes in IL-6, TNF-α, and β₂-MG at key post-treatment time points to determine their association with lymphoma relapse. By assessing both absolute levels and dynamic trajectories, we aimed to identify whether early post-chemotherapy fluctuations provide actionable early warning signals.
Methods
Study design
This prospective cohort study was conducted at The Second Hospital of Hebei Medical University between January 2019 and December 2023. A total of 260 patients with pathologically confirmed lymphoma who had completed standard first-line chemotherapy were enrolled and followed longitudinally. Based on clinical outcomes during follow-up, patients were classified into a relapse group (n = 78) and a non-relapse group (n = 182).
The study protocol was reviewed and approved by the Ethics Committee of The Second Hospital of Hebei Medical University. Written informed consent was obtained from all participants prior to enrollment. All study procedures adhered to the principles of the Declaration of Helsinki.
Sample size estimation
The sample size was determined based on the anticipated relapse rate and the requirements of multivariable logistic regression. Assuming an expected 2-year relapse rate of approximately 30%, at least 80 relapse events would be needed to satisfy the rule of ≥10 events per variable for stable model estimation. Accordingly, the target sample size was set at 250–300 patients, which was deemed sufficient to ensure adequate statistical power for both logistic and survival analyses.
Inclusion criteria and exclusion criteria
Patients were eligible for enrollment if they met all of the following criteria: (1) Age ≥18 years; (2) Pathologically confirmed non-Hodgkin lymphoma (NHL), including diffuse large B-cell lymphoma (DLBCL), T-cell lymphoma, or other NHL subtypes; (3) Completion of a standard first-line chemotherapy regimen (e.g., R-CHOP) with documented complete response (CR) or partial response (PR); (4) Ability and willingness to complete at least 24 months of clinical follow-up; (5) Availability of complete serum biomarker data at all predefined time points (T1–T3).
Patients were excluded if they met any of the following conditions: (1) Evidence of active infection, autoimmune disease, or chronic inflammatory conditions during chemotherapy or within 3 months before biomarker assessment; (2) Presence of other concurrent malignancies; (3) Severe hepatic or renal dysfunction, or a recent acute cardiovascular or cerebrovascular event; (4) Inability to comply with follow-up procedures or loss to follow-up.
Data collection and follow-up
Follow-up time points
Patients were assessed at predefined time points before and after completion of chemotherapy to capture dynamic clinical and biochemical changes. Baseline measurements were obtained before chemotherapy initiation (T0) when available. However, cytokine measurements at T0 were not included in the primary analyses because baseline levels at diagnosis are subject to substantial variability related to tumor burden and systemic inflammatory activity, which may limit their specificity for relapse prediction.
The first post-treatment assessment (T1) was performed within 1 week after completion of chemotherapy. Subsequent follow-up evaluations were conducted at 3 months (T2) and 6 months (T3) after treatment. An additional time point, Tr, was defined for immediate assessment at the onset of clinically suspected relapse. These intervals were chosen to monitor early post-treatment biological fluctuations under relatively stable clinical conditions and to facilitate timely detection of relapse.
Follow-up assessments
At each scheduled follow-up visit, comprehensive clinical and laboratory evaluations were performed. These included a detailed physical examination and review of symptoms, as well as imaging studies such as contrast-enhanced CT, PET-CT, or MRI, in accordance with routine clinical practice. Standard hematologic parameters, including lactate dehydrogenase (LDH) and peripheral lymphocyte counts, were obtained at each visit. Serum concentrations of IL-6, TNF-α, and β₂-MG were measured at all designated time points (T1–T3). All relapse events were systematically documented, including the date of recurrence and the clinical or imaging criteria supporting the diagnosis.
Definition of relapse
Relapse was defined based on the Lugano 2014 classification, which incorporates both radiologic and clinical criteria. Recurrence was diagnosed when imaging revealed new lesions, progression of previously involved sites, or when biological evidence of lymphoma activity was confirmed through laboratory or pathological assessment. Relapse-free survival was calculated from the end of chemotherapy to the date of first confirmed relapse or the last follow-up visit.
Biomarker measurement
Sample collection
Fasting venous blood samples were collected in the early morning at each predefined time point. After centrifugation, serum was immediately separated, aliquoted, and stored at −80 °C until analysis. To ensure sample integrity, repeated freeze–thaw cycles were strictly avoided, and all specimens were processed according to standardized laboratory procedures.
Assay methods
Serum IL-6 and TNF-α concentrations were quantified using commercially available enzyme-linked immunosorbent assay (ELISA) kits. All ELISA plates were read using a SpectraMax iD5 microplate reader. Assay sensitivity was 0.70 pg./mL for IL-6 and 1.2 pg./mL for TNF-α, with manufacturer-reported detection ranges of 1.0–300 pg./mL and 2.0–500 pg./mL, respectively. For additional confirmation, parallel measurements were performed using chemiluminescence immunoassay kits based on the New Industry Chemiluminescence Analyzer MAGLWNI X8 platform. All calibrators and controls were run according to the standard Roche protocol. Serum β₂-MG levels were determined using a latex-enhanced immunoturbidimetric assay on a Roche Cobas 8000 automated biochemical analyzer. The analytical sensitivity was 0.1 mg/L, with a linear detection range of 0.1–10.0 mg/L. All assays were performed strictly following manufacturers’ instructions. Calibration was performed before each batch, and internal quality controls were included at low, medium, and high concentration levels.
Quality control
All biomarker analyses were performed in the same certified clinical laboratory to minimize inter-laboratory variability. Both intra-assay and inter-assay coefficients of variation (CVs) were maintained below 10%. Each sample was measured in duplicate, and the mean value was used for analysis. Laboratory personnel conducting the assays were blinded to all clinical information, including relapse status and time points, to prevent measurement bias.
Variable definitions
Independent variables
The primary independent variables were serum levels of IL-6, TNF-α, and β₂-MG measured at three predefined post-treatment time points: T1 (within 1 week after chemotherapy), T2 (3 months post-treatment), and T3 (6 months post-treatment). In addition to absolute concentrations, dynamic changes (Δ values) were calculated to capture temporal biomarker trajectories, defined as ΔT2–T1 = T2 − T1 and ΔT3–T2 = T3 − T2. These variables were used to evaluate whether early biomarker fluctuations were associated with subsequent relapse risk.
Covariates
Covariates included key demographic, clinical, laboratory, and treatment-related variables. Baseline characteristics comprised age, sex, and body mass index (BMI). Clinical covariates included lymphoma subtype, Ann Arbor stage, and International Prognostic Index (IPI) score. Laboratory parameters included lactate dehydrogenase (LDH) and peripheral lymphocyte count at baseline. Treatment-related factors included the chemotherapy regimen, the number of chemotherapy cycles completed, and whether the patient underwent autologous stem cell transplantation. These covariates were incorporated into multivariable analyses to control for potential confounding.
Outcome variables
The primary outcome was disease relapse, defined as a binary variable (Yes/No) according to the Lugano 2014 criteria. The secondary outcome was time to relapse, measured from the end of chemotherapy to the date of confirmed recurrence or last follow-up. This time-to-event variable was used for survival analyses, including Kaplan–Meier estimation and Cox proportional hazards modeling.
Statistical analysis
Continuous variables were assessed for normality and summarized as mean ± standard deviation for normally distributed data or as median (interquartile range) when distributional assumptions were not met. Categorical variables were presented as counts and percentages. Missing data were minimal; when the proportion of missing values was less than 5%, mean or median imputation was applied as appropriate. Variables with more than 5% missingness were documented and handled as described in the Appendix.
Baseline differences between the relapse and non-relapse groups were evaluated using the independent-sample t test or Mann–Whitney U test for continuous variables, depending on data distribution, and the χ^2^ test or Fisher’s exact test for categorical variables.
Univariate logistic regression analyses were performed to evaluate the associations between each biomarker (IL-6, TNF-α, and β₂-microglobulin) measured at T1, T2, and T3 and the risk of relapse. Dynamic changes in biomarker levels (ΔT2–T1 and ΔT3–T2) were also examined. Multivariable logistic regression models were subsequently constructed focusing on biomarker levels at T2, given their strongest temporal association with relapse. IL-6, TNF-α, and β₂-microglobulin at T2 were entered simultaneously along with key clinical covariates. Results were reported as odds ratios (ORs) with 95% confidence intervals (CIs). Multicollinearity was assessed using variance inflation factors (VIFs); because dynamic change variables showed substantial collinearity with absolute T2 values, they were included only in univariate analyses.
Receiver operating characteristic (ROC) curves were generated to evaluate the discriminative performance of individual biomarkers at T2. A combined model incorporating IL-6, TNF-α, and β₂-microglobulin was also developed. The area under the ROC curve (AUC), sensitivity, specificity, and optimal cutoff values determined by the Youden index were calculated. Comparisons between AUCs were performed using DeLong’s test.
Relapse-free survival (RFS) was analyzed using the Kaplan–Meier method after stratifying patients into high- and low-biomarker groups based on median T2 values. Differences in survival distributions were assessed using the log-rank test. Multivariable Cox proportional hazards regression models were then fitted to examine the associations between T2 biomarker levels and RFS, adjusting for clinically relevant covariates including Ann Arbor stage, International Prognostic Index (IPI) score, and autologous stem cell transplantation status. Hazard ratios (HRs) with 95% CIs were reported, and the proportional hazards assumption was evaluated using Schoenfeld residuals.
To assess potential overfitting and model stability, internal validation was performed using repeated five-fold cross-validation. Model discrimination was summarized using the mean cross-validated AUC. Given the single-center nature of the cohort, orthogonal validation using an independent external dataset was not feasible; therefore, model performance is reported as internally validated discrimination rather than externally validated prediction.
All statistical analyses were conducted using R software (version 4.x; R Foundation for Statistical Computing) and SPSS (version 26.0; IBM Corp., Armonk, NY). ROC, Kaplan–Meier, and Cox regression analyses were implemented using the pROC, survival, and rms packages in R. All tests were two-sided, and a p value < 0.05 was considered statistically significant.
Results
Baseline characteristics
A total of 260 patients were included in the final analysis, of whom 78 (30.0%) experienced relapse during follow-up. The baseline characteristics of the study population are summarized in Table 1. The cohort comprised patients with clearly defined histopathological subtypes, including diffuse large B-cell lymphoma (DLBCL), T-cell lymphomas, follicular lymphoma, marginal zone lymphoma, and mantle cell lymphoma.
Compared with the non-relapse group, patients who experienced relapse had a significantly higher proportion of advanced Ann Arbor stage III–IV disease (76.92% vs. 49.45%, p = 0.001), high International Prognostic Index (IPI) scores (57.69% vs. 32.97%, p = 0.001), and B symptoms (51.28% vs. 27.47%, p = 0.001). Biochemical indicators also differed significantly between groups. The relapse group exhibited higher baseline lactate dehydrogenase (LDH) levels (310.50 ± 95.30 vs. 250.40 ± 80.20 U/L, p = 0.002) and β₂-microglobulin levels (3.90 ± 1.20 vs. 3.10 ± 1.00 mg/L, p = 0.003), whereas lymphocyte counts were significantly lower (1.25 ± 0.45 vs. 1.50 ± 0.50 × 10^9^/L, p = 0.010).
The relapse group was slightly younger than the non-relapse group (53.20 ± 12.10 vs. 56.80 ± 11.50 years), with a marginal but statistically significant difference (p = 0.045). No significant differences were observed in sex distribution, body mass index, chemotherapy regimen, number of chemotherapy cycles, or autologous stem cell transplantation.
Serum biomarker levels at different time points
Serum levels of IL-6, TNF-α, and β₂-MG at each assessment time point are presented in Table 2 and Supplementary Figure S1. At the end of chemotherapy (T1), all three biomarkers were significantly elevated in the relapse group compared with the non-relapse group, including IL-6 (12.73 ± 4.18 vs. 9.47 ± 3.31 pg./mL, p < 0.001), TNF-α (19.63 ± 6.33 vs. 15.27 ± 5.14 pg./mL, p < 0.001), and β₂-MG (3.87 ± 1.17 vs. 3.12 ± 0.97 mg/L, p = 0.002). These differences became more pronounced at the 3-month follow-up (T2), with relapse patients showing further increases in IL-6 (15.84 ± 4.96 vs. 10.36 ± 3.44 pg./mL), TNF-α (23.92 ± 7.18 vs. 16.51 ± 5.48 pg./mL), and β₂-MG (4.54 ± 1.28 vs. 3.27 ± 1.05 mg/L), all with p < 0.001. By the 6-month time point (T3), the divergence between groups was most marked. IL-6 continued to rise to 18.59 ± 5.47 pg./mL in the relapse group compared with 11.12 ± 3.87 pg./mL in the non-relapse group (p < 0.001). Similarly, TNF-α (27.84 ± 7.82 vs. 17.46 ± 6.12 pg./mL, p < 0.001) and β₂-MG (5.16 ± 1.41 vs. 3.34 ± 1.08 mg/L, p < 0.001) remained significantly higher in patients who later experienced relapse.
Association between serum biomarkers and relapse
As shown in Table 3, IL-6, TNF-α, and β₂-MG measured at the 3-month follow-up (T2) were significantly associated with relapse in univariate analyses. Each 1-pg/mL increase in IL-6 at T2 was associated with a 12% higher odds of relapse (OR = 1.12, 95% CI: 1.08–1.17, p < 0.001), while TNF-α showed a smaller but significant effect (OR = 1.06, 95% CI: 1.03–1.09, p < 0.001). β₂-MG at T2 demonstrated the strongest association, with an OR of 1.55 (95% CI: 1.28–1.88, p < 0.001). Interval changes from T1 to T2 were also predictive; for example, ΔIL-6 (T2–T1) had an OR of 1.21 (95% CI: 1.11–1.32, p < 0.001).
In the multivariate model (Table 3), IL-6 and β₂-MG at T2 remained independent predictors after adjustment for clinical covariates. IL-6 at T2 retained a significant effect with an adjusted OR of 1.08 (95% CI: 1.03–1.14, p = 0.001), and β₂-MG showed an adjusted OR of 1.38 (95% CI: 1.11–1.72, p = 0.003). In contrast, TNF-α at T2 was no longer significant (adjusted OR = 1.03, p = 0.118). Advanced Ann Arbor stage (III–IV) and high IPI score also remained independent risk factors with adjusted ORs of 1.71 (95% CI: 1.00–2.93, p = 0.049) and 2.14 (95% CI: 1.25–3.67, p = 0.023), respectively.
Subtype-specific analyses in diffuse large B-cell lymphoma
Of the 260 patients included in the study, 150 (57.7%) were diagnosed with diffuse large B-cell lymphoma (DLBCL), representing the most prevalent histological subtype in the cohort. Within the DLBCL subgroup, serum levels of IL-6, TNF-α, andβ₂-MG measured at the 3-month post-treatment time point (T2) were significantly higher in patients who subsequently experienced relapse compared with those who remained relapse-free (Supplementary Table S1). After multivariable adjustment using the same covariate set as in the primary analysis—including age, Ann Arbor stage, International Prognostic Index (IPI) score, and autologous stem cell transplantation—IL-6 at T2 (adjusted OR = 1.07, 95% CI: 1.02–1.13) and β₂-MG at T2 (adjusted OR = 1.33, 95% CI: 1.05–1.69) remained independently associated with relapse risk, whereas TNF-α at T2 did not retain statistical significance (Supplementary Table S2).
Diagnostic performance of biomarkers and the combined model
As shown in Figure 1 and Table 4, all three biomarkers measured at the 3-month follow-up (T2)—IL-6, TNF-α, and β₂-MG—demonstrated significant diagnostic ability for predicting relapse. β₂-MG yielded the highest performance among the individual markers (AUC = 0.85, 95% CI: 0.79–0.90, p < 0.001), followed by IL-6 (AUC = 0.82, 95% CI: 0.76–0.88) and TNF-α (AUC = 0.79, 95% CI: 0.72–0.85). Sensitivity and specificity for single biomarkers ranged from 70.5 to 77.0% and 75.8 to 80.2%, respectively. The combined biomarker model demonstrated markedly superior discriminative power, achieving an AUC of 0.91 (95% CI: 0.87–0.95, p < 0.001), with improved sensitivity (84.6%) and specificity (86.3%).
ROC curves for individual biomarkers and the combined model in predicting relapse. Receiver operating characteristic (ROC) curves for IL-6, TNF-α, β₂-microglobulin, and the combined biomarker model at the 3-month follow-up (T2).
Similar discriminative patterns were observed when the analyses were restricted to patients with DLBCL, with the combined biomarker model consistently demonstrating superior predictive performance compared with individual biomarkers (Supplementary Table S3).
In repeated five-fold cross-validation, the combined biomarker model demonstrated stable discriminative performance, with a mean cross-validated AUC of 0.88, which was comparable to the apparent AUC estimated in the full cohort (Supplementary Table S4).
In addition to AUC, classification performance was evaluated using confusion matrices and recall-based metrics. At the optimal cutoff, the combined biomarker model demonstrated balanced sensitivity and specificity for relapse detection, indicating that discriminative performance was not driven solely by correct classification of the majority non-relapse group (Supplementary Table S5).
Relapse-free survival analysis
Kaplan–Meier analyses demonstrated clear separation of relapse-free survival between high and low biomarker groups (Supplementary Figures S2A–C). Patients with high IL-6 levels at the 3-month assessment (T2) exhibited significantly shorter relapse-free survival compared with those with low IL-6 (log-rank p < 0.01). A similar pattern was observed for TNF-α and β₂-MG, with high-level groups showing a more rapid decline in survival probability over time. Among the three biomarkers, β₂-MG showed the widest curve separation, indicating the strongest prognostic impact.
In the multivariable Cox proportional hazards model (Table 5), high IL-6 (adjusted HR = 1.78, 95% CI: 1.20–2.64), high TNF-α (HR = 1.52, 95% CI: 1.03–2.26), and high β₂-MG (HR = 2.06, 95% CI: 1.36–3.11) remained independent predictors of earlier relapse after adjustment for Ann Arbor stage, IPI score, autologous transplantation, and age.
In subgroup analyses limited to DLBCL, higher levels of IL-6 and β₂-MG at T2 were also associated with significantly shorter relapse-free survival, as demonstrated by Kaplan–Meier analyses (Supplementary Figure S3).
Discussion
In this prospective cohort study, we had revealed several notable findings. First, all three biomarkers—IL-6, TNF-α, and β₂-MG—showed significant differences between relapse and non-relapse groups immediately after chemotherapy (T1). These differences widened at T2 and T3, driven by a progressive increase in the relapse group. The 3-month time point (T2) demonstrated the strongest predictive value: IL-6 and β₂-MG remained independent predictors in multivariable models, whereas TNF-α lost significance after adjustment. The combined biomarker model achieved superior discrimination (AUC = 0.91). Survival analyses further confirmed that higher IL-6, TNF-α, and β₂-MG were associated with shorter relapse-free survival. Overall, IL-6 and β₂-MG at 3 months post-chemotherapy independently predicted relapse within 12–24 months, and a multi-marker panel provided the strongest early-warning capacity.
Our findings align with prior evidence showing that IL-6 correlates with tumor burden and adverse outcomes in lymphoma (23, 26, 32, 33); however, most existing studies focus on diagnostic or static prognostic assessments (34, 35). In contrast, our results highlight the early post-treatment time point (T2) as a particularly informative window for relapse prediction, which has not been emphasized previously. For TNF-α, the literature has reported inconsistent predictive value, often weaker than IL-6 (25–27, 36). Our study supports this view: TNF-α was significant in univariate analyses but lost significance in multivariable models, likely due to collinearity with IL-6 (37–39). Consistent with its well-established prognostic role, β₂-MG again proved to be a strong predictor (30, 40–44). Notably, we demonstrate that β₂-MG shows superior discriminative ability for relapse compared with the other biomarkers (AUC = 0.85). Importantly, most previous studies have evaluated single biomarkers or cross-sectional data (31, 45, 46). Our study is the first to integrate longitudinal T1–T3 measurements with multiple analytic frameworks, demonstrating that a multi-marker model substantially enhances predictive performance.
Lymphoma comprises a biologically and clinically heterogeneous group of malignancies, and analyses that pool different histological subtypes may potentially obscure subtype-specific associations. To address this concern, we conducted a dedicated subgroup analysis focusing on patients with diffuse large B-cell lymphoma, the most common subtype in our cohort. Importantly, the key findings observed in the overall population—namely, the independent prognostic value of IL-6 and β₂-MG measured at 3 months after completion of chemotherapy—were preserved within the DLBCL subgroup. These results support the robustness and clinical relevance of our primary conclusions. Nevertheless, subgroup analyses of less frequent lymphoma subtypes were underpowered in the present study and should be interpreted with caution, warranting further validation in larger, subtype-specific cohorts.
Although internal validation demonstrated stable model performance, orthogonal validation in an independent cohort was not available in the present study. As a result, the findings should be interpreted as internally validated associations and discrimination. External validation in independent, preferably multicenter, cohorts will be required to confirm generalizability and to support potential clinical implementation.
The biological behavior of the three biomarkers provides a plausible explanation for their predictive value in relapse surveillance. IL-6 is a key pro-inflammatory cytokine that activates the JAK/STAT3 pathway, sustaining inflammatory signaling within the tumor microenvironment and promoting tumor cell proliferation, survival, and immune evasion (47, 48). Elevated IL-6 levels have been linked to increased proliferative activity and higher residual tumor burden, consistent with its strong association with relapse in our cohort (49, 50). TNF-α also contributes to lymphoma biology through activation of the NF-κB pathway, amplifying inflammatory cascades and reflecting dysregulated immune responses (25, 51). However, its close biological overlap with IL-6 likely explains the attenuation of its independent predictive effect in multivariable models, suggesting that TNF-α may function more as a marker of generalized inflammatory activation rather than a specific driver of relapse (26, 36). β₂-MG, a structural component of the MHC class I complex, reflects both tumor cell turnover and tumor burden, and has long been recognized as an adverse prognostic factor in aggressive lymphomas (27, 40). Its strong performance in predicting relapse in our study is consistent with its role as a direct indicator of residual disease activity (30). Finally, the prognostic relevance of dynamic changes further supports a biological model in which persistent or rising inflammation after chemotherapy reflects ongoing microscopic disease.
These findings have clear clinical relevance. Serial measurement of IL-6, TNF-α, and β₂-MG provides an accessible early-warning system that can detect relapse risk during the intervals between routine imaging, offering particular value for patients who cannot undergo frequent CT or PET scans. The 3-month post-treatment time point (T2) emerges as a critical surveillance window, during which biomarker elevations may justify earlier imaging, shortened follow-up intervals, or consideration of intensified monitoring. The combined biomarker model further enables practical risk stratification, distinguishing low-risk patients who may continue standard follow-up from high-risk individuals who may benefit from closer monitoring or adjunctive MRD assessments such as ctDNA. Given their low cost and ease of implementation, these serum biomarkers represent a feasible and scalable complement—rather than an alternative—to conventional imaging-based surveillance.
This study has several limitations. First, it was conducted at a single center with a moderate sample size, which may limit the generalizability of the findings and warrants validation in larger multi-center cohorts. Second, molecular MRD markers such as ctDNA or flow cytometric MRD were not included; integrating these assays could further refine relapse prediction. Third, we did not perform subtype-specific analyses, and differences between lymphoma subtypes—such as DLBCL and T-cell lymphomas—may influence biomarker performance. In addition, the potential impact of immunomodulatory treatments, including PD-1 inhibitors, was not fully controlled for and may affect inflammatory marker levels. Although internal validation using repeated cross-validation demonstrated stable model performance, external validation in independent cohorts will be required before clinical implementation. Finally, the follow-up duration was relatively limited, and longer-term outcomes such as late relapse and overall survival require further investigation. Future research should aim to validate these findings in large, multi-center prospective cohorts to strengthen external applicability. Incorporating molecular MRD assays, particularly ctDNA, may enable the development of a multi-modal surveillance strategy that integrates inflammatory biomarkers with tumor-specific genetic markers. Subtype-specific modeling and exploration of treatment–biomarker interactions could also enhance predictive precision. Ultimately, combining dynamic serum biomarkers with molecular and imaging data may yield a more comprehensive, personalized relapse-monitoring framework.
Conclusion
In this prospective cohort study, longitudinal changes in IL-6, TNF-α, and β₂-MG were associated with subsequent lymphoma relapse. IL-6 and β₂-MG measured at 3 months after chemotherapy demonstrated independent prognostic value, and a combined biomarker model improved discriminative performance compared with individual markers. Notably, biomarker dynamics preceded radiologic relapse, suggesting potential utility for early risk stratification. These findings, which were consistent in the diffuse large B-cell lymphoma subgroup, support the use of readily available serum biomarkers as adjuncts to imaging in post-treatment surveillance.
The reference list from the paper itself. Each links out to its DOI / PubMed record.
- 1Yao Z Deng L Xu-Monette ZY Manyam GC Jain P Tzankov A . Concordant bone marrow involvement of diffuse large B-cell lymphoma represents a distinct clinical and biological entity in the era of immunotherapy. Leukemia. (2018) 32:353–63. doi: 10.1038/leu.2017.222, 28745330 PMC 5985660 · doi ↗ · pubmed ↗
- 2van Bladel DAG Stevens WBC Kroeze LI de Groen RAL de Groot FA van der Last-Kempkes J . A significant proportion of classic Hodgkin lymphoma recurrences represents clonally unrelated second primary lymphoma. Blood Adv. (2023) 7:5911–24. doi: 10.1182/bloodadvances.2023010412, 37552109 PMC 10558751 · doi ↗ · pubmed ↗
- 3Karmali R Gordon LI. Sequencing T-cell therapy for relapsed or refractory large B-cell lymphoma. Lancet Haematol. (2025) 12:946–55. doi: 10.1016/S 2352-3026(25)00342-441448214 · doi ↗ · pubmed ↗
- 4Reitter S Rohn A Schmidt HH Linkesch W. Upfront radioimmunotherapy represents an effective and safe therapeutic option in cutaneous B-cell non-Hodgkin lymphoma. Ann Hematol. (2012) 91:129–30. doi: 10.1007/s 00277-011-1216-1, 21437587 · doi ↗ · pubmed ↗
- 5Peng W Wu J Feng J. Long noncoding RNA HULC predicts poor clinical outcome and represents pro-oncogenic activity in diffuse large B-cell lymphoma. Biomed Pharmacother. (2016) 79:188–93. doi: 10.1016/j.biopha.2016.02.032, 27044827 · doi ↗ · pubmed ↗
- 6Manni S Pesavento M Spinello Z Saggin L Arjomand A Fregnani A . Protein kinase CK 2 represents a new target to boost Ibrutinib and Venetoclax induced cytotoxicity in mantle cell lymphoma. Front Cell Dev Biol. (2022) 10:935023. doi: 10.3389/fcell.2022.935023, 36035991 PMC 9403710 · doi ↗ · pubmed ↗
- 7Humme D Haider A Mobs M Mitsui H Suárez-Fariñas M Ohmatsu H . Aurora kinase a is upregulated in cutaneous T-cell lymphoma and represents a potential therapeutic target. J Invest Dermatol. (2015) 135:2292–300. doi: 10.1038/jid.2015.139, 25848977 · doi ↗ · pubmed ↗
- 8Hall JS Usher S Byers RJ Higgins RC Memon D Radford JA . Quanti Gene plex represents a promising diagnostic tool for cell-of-origin subtyping of diffuse large B-cell lymphoma. J Mol Diagn. (2015) 17:402–11. doi: 10.1016/j.jmoldx.2015.03.01025982535 · doi ↗ · pubmed ↗