Distribution and clinical significance of peripheral blood lymphocyte PD-1 and PD-L1 in non-Hodgkin lymphoma: a retrospective study in Chinese patients
Lu Liu, Lei Wang, Wei Wang, Yansu Wang, Yanrong Wang, Na Xu, Na Li, Haifeng Liu

TL;DR
This study shows that PD-1 and PD-L1 levels in blood lymphocytes are linked to disease severity and treatment outcomes in non-Hodgkin lymphoma patients.
Contribution
The study provides new insights into the clinical relevance of PD-1 and PD-L1 in peripheral blood lymphocytes for non-Hodgkin lymphoma in a Chinese population.
Findings
Higher PD-1 and PD-L1 levels on CD8+ T cells were found in patients with elevated LDH.
PD-1 on CD8+ T cells was higher in patients with bone marrow involvement.
Lower PD-L1 levels on T cells were associated with better treatment response.
Abstract
Programmed death-1 (PD-1) and its ligand PD-L1 play critical roles in immune checkpoint regulation. This study investigated the relationship between PD-1 and PD-L1 expression on peripheral blood lymphocytes and Non- Hodgkin Lymphoma progression. This retrospective study included patients diagnosed with Non- Hodgkin Lymphoma at Jilin Cancer Hospital between October 2013 and May 2017. PD-1 and PD-L1 expression on CD4+ and CD8+ T cells was analyzed using flow cytometry. A total of 125 non- Hodgkin Lymphoma patients (65 males and 60 females; median age, 57 years; range, 14–86 years) were included. PD-1 and PD-L1 expression on CD8+ T cells was significantly higher in patients with elevated lactate dehydrogenase (LDH) (>245 U/L) than in those with normal LDH (PD-1: 16.46% vs. 12.68%, P = 0.005; PD-L1: 9.96% vs. 7.90%, P = 0.043). PD-1 expression on CD8+ T cells was also higher in patients…
Genes, proteins, chemicals, diseases, species, mutations and cell lines named across the full text — each resolved to its canonical identifier and authoritative record.
Click any figure to enlarge with its caption.
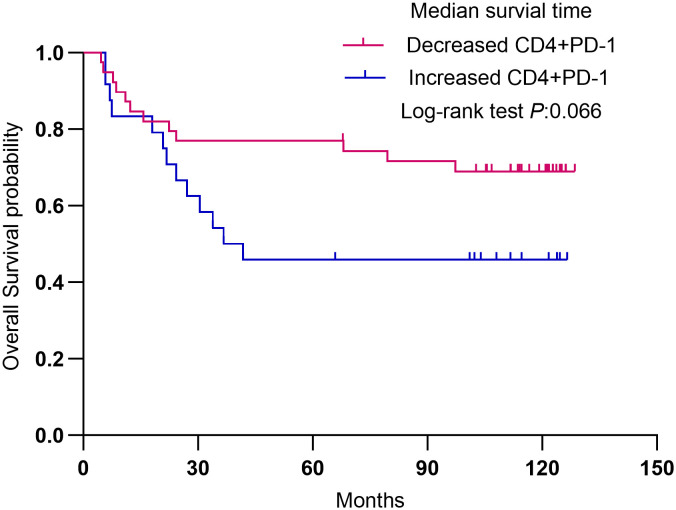 Figure 1
| Characteristics | n | % |
|---|---|---|
| Sex | ||
| Male | 65 | 52.0 |
| Female | 60 | 48.0 |
| Age | ||
| ≤60 | 78 | 62.4 |
| >60 | 47 | 37.6 |
| Pathological type | ||
| B cell non-Hodgkin lymphoma | 92 | 73.6 |
| T cell non-Hodgkin lymphoma | 33 | 26.4 |
| Extranodal involvement | ||
| No | 28 | 22.4 |
| Yes | 97 | 77.6 |
| Bone marrow involvement | ||
| No | 110 | 88.0 |
| Yes | 15 | 12.0 |
| Stage | ||
| I-II | 54 | 43.2 |
| III-IV | 71 | 56.8 |
| β2-microglobulin | ||
| Normal | 60 | 48.0 |
| Elevated | 65 | 52.0 |
| Lactic dehydrogenase | ||
| Normal | 75 | 60.0 |
| Elevated | 50 | 40.0 |
| B symptoms | ||
| A | 91 | 72.8 |
| B | 34 | 27.2 |
| Characteristics | n | PD1-CD4(%), median (IQR) | P | PD1-CD8(%), median (IQR) | P | PDL1-CD4(%), median (IQR) | P | PDL1-CD8(%), median (IQR) | P |
|---|---|---|---|---|---|---|---|---|---|
| Sex | |||||||||
| Male | 65 | 22.30 (17.38-26.03) | 0.169 | 14.32 (11.22-17.25) | 0.974 | 12.67 (10.61-22.53) | 0.857 | 8.33 (5.34-13.28) | 0.931 |
| Female | 60 | 22.85 (18.81-28.02) | 14.87 (10.49-22.39) | 14.65 (10.15-21.94) | 9.66 (5.69-13.15) | ||||
| Age | |||||||||
| ≤60 | 78 | 22.69 (19.43-27.23) | 0.399 | 14.95 (10.58-21.32) | 0.509 | 13.66 (10.68-21.49) | 0.872 | 8.36 (5.60-13.03) | 0.689 |
| >60 | 47 | 22.00 (18.56-26.95) | 12.84 (10.54-21.94) | 14.23 (9.98-22.71) | 9.64 (4.69-13.25) | ||||
| Pathological type | |||||||||
| B cell NHL | 92 | 22.46 (18.66-26.95) | 0.555 | 13.82 (10.56-21.41) | 0.345 | 14.00 (10.48-22.25) | 0.940 | 9.32 (4.99-12.54) | 0.291 |
| T cell NHL | 33 | 22.44 (17.02-27.07) | 15.65 (11.62-21.45) | 13.54 (10.34-21.76) | 9.67 (6.67-15.36) | ||||
| β2MG | |||||||||
| Normal | 60 | 21.85 (18.56-25.89) | 0.163 | 14.87 (10.58-23.56) | 0.580 | 13.66 (10.47-22.36) | 0.935 | 9.09 (5.90-12.13) | 0.548 |
| Elevated | 65 | 23.25 (19.18-27.05) | 13.87 (10.54-19.48) | 14.23 (10.35-21.66) | 9.50 (5.07-13.61) | ||||
| LDH | |||||||||
| Normal | 75 | 22.15 (18.56-26.95) | 0.338 | 12.68 (10.54-16.84) | 0.005* | 13.44 (9.68-22.15) | 0.412 | 8.33 (4.46-12.28) | 0.070 |
| Elevated | 50 | 22.74 (19.09-27.80) | 16.46 (12.40-23.96) | 15.07 (10.97-22.20) | 10.30 (6.32-15.05) | ||||
| Stage | |||||||||
| 0-II | 54 | 21.99 (18.19-26.95) | 0.180 | 13.28 (10.54-18.12) | 0.103 | 13.11 (10.01-22.20) | 0.699 | 10.16 (4.59-12.72) | 0.690 |
| III-IV | 71 | 22.78 (19.68-21.70) | 15.51 (10.98-22.54) | 14.22 (10.75-21.96) | 8.66 (5.87-13.58) | ||||
| B symptoms | |||||||||
| A | 91 | 22.44 (19.67-26.95) | 0.504 | 14.32 (10.58-21.61) | 0.822 | 14.23 (10.54-21.54) | 0.393 | 9.68 (5.71-13.63) | 0.127 |
| B | 34 | 22.50 (15.69-27.33) | 15.26 (10.50.-20.60) | 12.91 (8.94-22.20) | 6.86 (5.17-11.61) | ||||
| Extranodal involvement | |||||||||
| No | 28 | 23.30 (19.48-27.10) | 0.292 | 140.4 (10.55-18.75) | 0.700 | 12.31 (9.95-19.86) | 0.492 | 7.02 (4.83-10.64) | 0.175 |
| Yes | 97 | 22.36 (18.60-26.95) | 14.88 (10.58-21.70) | 14.28 (10.50-22.25) | 9.67 (5.93-13.66) | ||||
| Bone marrow involvement | |||||||||
| No | 110 | 22.34 (18.56-26.95) | 0.185 | 13.94 (10.55-20.21) | 0.053 | 14.00 (9.93-21.62) | 0.179 | 9.44 (5.31-12.86) | 0.521 |
| Yes | 15 | 22.78 (20.84-29.67) | 16.84 (12.84-29.67) | 13.64 (10.97 + 33.10) | 9.67 (6.18-15.25) | ||||
| Response | n | PD1-CD4(%), median (IQR) | P | PD1-CD8(%), median (IQR) | P | PDL1-CD4(%), median (IQR) | P | PDL1-CD8(%), median (IQR) | P |
|---|---|---|---|---|---|---|---|---|---|
| CR | 34 | 22.57 (18.56-27.36) | 0.978 | 14.57 (11.10-18.45) | 0.883 | 11.14 (5.98-19.09) | 0.001* | 7.19 (4.21-10.65) | 0.032* |
| Non-CR | 69 | 22.31 (18.66-26.97) | 13.87 (10.56-23.79) | 18.61 (11.63-23.55) | 10.60 (6.15-15.17) |
| Adverse reaction grade | n | PD1-CD4(%), median (IQR) | P | PD1-CD8(%), median (IQR) | P | PDL1CD4(%), median (IQR) | P | PDL1CD8(%), median (IQR) | P |
|---|---|---|---|---|---|---|---|---|---|
| Leucopenia | |||||||||
| 0-2 | 47 | 21.86 (16.99-25.69) | 0.140 | 12.69 (10.52-15.81) | 0.008* | 12.67 (10.75-21.54) | 0.733 | 9.58 (4.85-13.68) | 0.927 |
| 3-4 | 78 | 22.69 (19.09-27.75) | 15.72 (11.54-23.72) | 14.25 (10.21-23.03) | 8.85 (5.83-12.86) | ||||
| Neutropenia | |||||||||
| 0-2 | 39 | 21.86 (16.99-26.37) | 0.364 | 13.77 (10.52-16.84) | 0.204 | 12.59 (10.44-21.96) | 0.685 | 9.52 (5.32-14.98) | 0.649 |
| 3-4 | 86 | 22.60 (19.09-27.10) | 15.50 (11.15-22.79) | 14.26 (10.41-22.45) | 9.44 (5.60-12.62) | ||||
| Anemia | |||||||||
| 0-2 | 114 | 22.31 (18.56-26.95) | 0.018* | 14.11 (10.57-20.21) | 0.086 | 13.54 (10.39-22.01) | 0.405 | 8.97 (5.34-12.97) | 0.234 |
| 3-4 | 11 | 26.25 (22.51-44.17) | 16.57 (11.67-36.25) | 20.28 (11.67-22.36) | 10.44 (6.36-29.67) | ||||
| Thrombocytopenia | |||||||||
| 0-2 | 101 | 22.15 (18.56-26.63) | 0.042* | 14.56 (10.58-20.24) | 0.804 | 13.54 (10.45-21.40) | 0.211 | 9.50 (5.70-12.87) | 0.836 |
| 3-4 | 24 | 25.40 (20.50-29.56) | 14.18 (10.71-23.45) | 18.00 (7.34-29.22) | 8.27 (4.98-14.85) | ||||
| Infection | |||||||||
| No | 89 | 22.15 (18.66-26.75) | 0.276 | 13.87 (10.55-20.46) | 0.202 | 12.67 (10.28-21.46) | 0.175 | 8.06 (4.87-12.27) | 0.072 |
| Yes | 36 | 23.02 (16.65-29.50) | 15.71 (11.77-23.13) | 15.82 (10.56-23.56) | 10.51 (6.00-15.52) | ||||
| Characteristics | Univariable analysis | Multivariable analysis | ||
|---|---|---|---|---|
| HR (95%CI) | P | HR (95%CI) | P | |
| Sex | ||||
| Male | 1 | |||
| Female | 0.90 (0.54-1.51) | 0.690 | ||
| Age | ||||
| ≤60 | 1 | 1 | ||
| >60 | 2.21 (1.32-3.71) | 0.003* | 2.89 (1.52-5.52) | 0.001* |
| Pathological type | ||||
| B cell NHL | 1 | 1 | ||
| T cell NHL | 2.56 (1.50-4.40) | 0.001* | 2.90 (1.48-5.69) | 0.002* |
| Extranodal involvement | ||||
| No | 1 | |||
| Yes | 1.29(0.67-2.49) | 0.445 | ||
| Bone marrow involvement | ||||
| No | 1 | |||
| Yes | 2.03 (1.02-4.01) | 0.043* | ||
| Stage | ||||
| 0-II | 1 | 1 | ||
| III-IV | 2.56 (1.45-4.51) | 0.001* | 1.95 (1.02-3.71) | 0.043* |
| β2-microglobulin | ||||
| Normal | 1 | |||
| Elevated | 2.38 (1.38-4.09) | 0.002* | ||
| Lactic dehydrogenase | ||||
| Normal | 1 | |||
| Elevated | 1.70 (1.01-2.85) | 0.044* | ||
| B symptoms | ||||
| A | 1 | |||
| B | 1.06 (0.60-1.87) | 0.841 | ||
| Response | ||||
| CR | 1 | |||
| Non-CR | 2.37 (1.14-4.95) | 0.021* | ||
| Leucopenia | ||||
| Grade 0-2 | 1 | |||
| Grade 3-4 | 1.24 (0.72-2.14) | 0.432 | ||
| Neutropenia | ||||
| Grade 0-2 | 1 | |||
| Grade 3-4 | 1.01 (0.58-1.77) | 0.964 | ||
| Anemia | ||||
| Grade 0-2 | 1 | 1 | ||
| Grade 3-4 | 3.09 (1.45-6.57) | 0.003* | 2.96 (1.28-6.85) | 0.011* |
| Thrombocytopenia | ||||
| Grade 0-2 | 1 | |||
| Grade 3-4 | 1.18 (0.63-2.23) | 0.609 | ||
| Infection | ||||
| No | 1 | 1 | ||
| Yes | 2.55 (1.51-4.31) | <0.001* | 2.57 (1.37-4.81) | 0.003* |
| PD1-CD4 (%) | 1.00 (0.97-1.03) | 0.926 | ||
| PD1-CD8 (%) | 1.01 (0.99-1.03) | 0.568 | ||
| PDL1CD4 (%) | 1.02 (0.99-1.04) | 0.220 | ||
| PDL1CD84 (%) | 1.01 (0.98-1.04) | 0.470 | ||
| Characteristics | n | % |
|---|---|---|
| Sex | ||
| Male | 33 | 52.4 |
| Female | 30 | 47.6 |
| Age | ||
| ≤60 | 45 | 71.4 |
| >60 | 18 | 28.6 |
| Pathological type | ||
| B cell non-Hodgkin lymphoma | 48 | 76.2 |
| T cell non-Hodgkin lymphoma | 15 | 23.8 |
| Extranodal involvement | ||
| No | 19 | 30.2 |
| Yes | 44 | 69.8 |
| Bone marrow involvement | ||
| No | 58 | 92.1 |
| Yes | 5 | 7.9 |
| Stage | ||
| I-II | 32 | 50.8 |
| III-IV | 31 | 49.2 |
| β2-microglobulin | ||
| Normal | 32 | 50.8 |
| Elevated | 31 | 49.2 |
| Lactic dehydrogenase | ||
| Normal | 38 | 60.3 |
| Elevated | 25 | 39.7 |
| B symptoms | ||
| A | 44 | 69.8 |
| B | 19 | 30.2 |
Peer Reviews
No public reviews on file for this paper yet. If you reviewed it on a platform where reviews are public (OpenReview, ICLR, NeurIPS, ICML), you can paste yours below so the community can read it here.
Videos
No videos yet. Explain this paper in a talk, walkthrough, or lecture? Add one.
Taxonomy
TopicsCancer Immunotherapy and Biomarkers · CAR-T cell therapy research · Ferroptosis and cancer prognosis
Background
Non-Hodgkin lymphoma ranks among the ten most common malignancies in China, with an age-standardized incidence rate of 3.75 cases per 100,000 people (1, 2). It is also one of the leading causes of cancer-related deaths in the country (3). Management of non-Hodgkin lymphoma involves various approaches tailored to the specific type and stage of the disease, including chemotherapy, radiation therapy, immunotherapy, targeted therapy, and stem cell transplantation (4–7). However, due to the limited understanding of non-Hodgkin lymphoma pathogenesis, chemotherapy remains the primary treatment option, apart from the use of rituximab in CD20-positive B-cell lymphoma (6). Many patients either develop resistance to initial chemotherapy or relapse after remission, leaving limited treatment options and resulting in poor prognoses (5–7). Consequently, identifying new therapeutic targets and predictors of treatment efficacy is critical for improving non-Hodgkin lymphoma management and patient outcomes.
The tumor microenvironment and the immune response to cancer cells play significant roles in controlling tumor progression (8). However, cancer cells can exploit various immune checkpoints to evade detection by the immune system (9). As a result, recent treatment paradigms have shifted toward targeting these immune evasion mechanisms (10). Programmed cell death-1 (PD-1) and its ligand PD-L1 are key immune checkpoints targeted by immunotherapy (11). The PD-1 receptor protein inhibits T cell-mediated immune responses (12). Tumor and stromal cells within the microenvironment can express PD-L1 (B7-H1) and PD-L2 (B7-DC), which bind to PD-1 and suppress lymphocyte proliferation and cytokine production (11, 12). Nivolumab, an anti-PD-1 antibody, was approved by the Food and Drug Administration (FDA) in 2016 for relapsed/refractory Hodgkin’s lymphoma (rrHL) following brentuximab vedotin and autologous stem cell transplantation (ASCT) failure (13). Pembrolizumab, another anti-PD-1 antibody, received FDA and European Commission approval for rrHL in 2017 (14). Beyond their role in checkpoint inhibition, PD-1 and PD-L1 expression may also influence chemotherapy response in lymphoma. Chemotherapy can alter the tumor microenvironment and induce PD-L1 expression on tumor cells, thereby reducing T cell activity and weakening the antitumor immune response (15, 16).
While these therapies show great promise, overall response rates to immune checkpoint blockade are 60%–80% for rrHL but only 20%–40% for non-Hodgkin lymphoma (NHL) (17, 18). In comparison, chemotherapy response rates remain around 50% (19, 20). Thus, reliable methods are needed to identify patient subsets most likely to benefit from these therapies. Tumor tissue provides valuable biomarker information, but its use is limited by restricted availability, tumor heterogeneity, dynamic expression patterns, and technical challenges (21, 22). In contrast, liquid biopsies, such as peripheral blood sampling, offer a convenient, non-invasive means of dynamic monitoring with the advantage of reflecting systemic heterogeneity (22). Previous studies suggest that upregulation of PD-1/PD-L1 expression on peripheral blood cells is closely associated with cancer (23). Moreover, CD28 expression by peripheral blood PD-1+ CD8+ T cells has been proposed as a potential biomarker for predicting responses to PD-1/PD-L1 checkpoint blockade therapy (24). However, the precise roles of PD-1 and PD-L1 expression on peripheral blood immune cells in non-Hodgkin lymphoma remain unclear.
This study aims to investigate the impact of PD-1 and PD-L1 expression on peripheral blood non-Hodgkin lymphocytes in relation to lymphoma progression. The findings may help in developing strategies to identify patients most likely to benefit from anti-PD-1 and anti-PD-L1 therapies.
Materials and methods
Study population
This retrospective study included patients diagnosed with non-Hodgkin lymphoma at Jilin Cancer Hospital between October 2013 and May 2017 Eligible patients met the following criteria: (1) diagnosis confirmed by the hospital’s pathology department based on the WHO classification of hematopoietic and lymphoid tissue tumors using morphological and immunohistochemical methods; (2) availability of complete clinical data, treatment records, and follow-up information; (3) newly diagnosed cases without prior anti-lymphoma therapy; and (4) pretreatment peripheral blood PD-1 and PD-L1 test results. Patients were excluded if they had incomplete data, a history of other malignancies, congenital immunodeficiency, infectious diseases, or significant diseases of the heart, liver, kidneys, or other vital organs.
The study was approved by the Ethics Committee of Jilin Cancer Hospital (Approval No. 202507-004-01). The committee waived the requirement for individual informed consent due to the retrospective nature of the study. This study initially included patients with both Hodgkin Lymphoma (HL) and Non-Hodgkin Lymphoma (NHL). Given the fundamental differences in the tumor microenvironment, cell of origin, and standard treatment approaches between HL and NHL, and the small number of HL cases (n=149), the subsequent analyses of biomarker association and prognosis were focused on the NHL cohort (n=125) to ensure biological and clinical homogeneity.
PD-1/PD-L1 status was assessed using fasting venous blood samples collected in EDTA tubes and stored at 4 °C. During the study period, flow cytometry was performed with mouse anti-human monoclonal antibodies, including PD-1 (CD279-PE), PD-L1 (CD274-PE), and CTLA-4 (CD152-PerCP), as well as CD3, CD4, CD25, and CD8. The frequencies of PD-1 and PD-L1 expression were evaluated in all participants using a BD flow cytometer, with a minimum diagnostic threshold of 250,000 events per sample.
PD-1/PD-L1 flow cytometry analysis
PD-1/PD-L1 status was assessed using fasting venous blood samples collected in EDTA tubes and stored at 4°C. During the study period, flow cytometry was performed with mouse anti-human monoclonal antibodies, including PD-1 (CD279-PE), PD-L1 (CD274-PE), and CTLA-4 (CD152-PerCP), as well as CD3, CD4, CD25, and CD8. Lymphocytes were first gated based on forward and side scatter characteristics. Subsequently, CD3+ T cells were selected. From the CD3+ population, CD4+ and CD8+ subsets were identified. PD-1 (CD279) and PD-L1 (CD274) expression were then analyzed within these CD4+ and CD8+ gates. Isotype controls were used to define positive populations. The frequencies of PD-1 and PD-L1 expression were evaluated in all participants using a BD flow cytometer, with a minimum diagnostic threshold of 250,000 events per sample.
Data collection
Demographic data (sex and age), clinical characteristics (pathological type, extranodal involvement, bone marrow involvement, stage, β2-microglobulin [β2MG], Eastern Cooperative Oncology Group performance status [ECOG PS], B symptoms, and lactate dehydrogenase [LDH]), PD-1/PD-L1 expression status, treatment response, and complications (leukopenia, neutropenia, anemia, thrombocytopenia, and infection) were extracted from medical records.
Treatment regimens were standardized based on lymphoma subtype. Patients with Diffuse Large B-Cell Lymphoma (DLBCL) received R-CHOP (rituximab, cyclophosphamide, doxorubicin, vincristine, prednisone). Patients with Hodgkin Lymphoma received ABVD (doxorubicin, bleomycin, vinblastine, dacarbazine). Patients with peripheral T-cell lymphoma received CHOP-based regimens. Response (CR/PR) was assessed after 4–6 cycles of these first-line therapies.
Staging was performed in accordance with the 2014 Lugano staging system (25) (Appendix 1). Treatment response was evaluated based on the 2014 Lugano criteria for lymphoma treatment response assessment, which include complete response (CR), partial response (PR), stable disease (SD), and progressive disease (PD) (25). Hematologic adverse events were graded according to the Common Terminology Criteria for Adverse Events (CTCAE) version 4.03.
Follow-up data were obtained from the medical records. For patients who remained alive, follow-up was censored on October 31, 2024. The cause and time of death were recorded. Overall survival was calculated from the date of cancer diagnosis to death from any cause.
Serum lactate dehydrogenase (LDH) levels were measured as part of routine clinical biochemistry using an automated analyzer (specify model, e.g., Beckman Coulter AU5800) at the hospital’s central laboratory. The upper limit of normal (ULN) was defined as 245 U/L according to the laboratory’s reference range. Detailed flow cytometry protocol: Whole blood was stained within 4 hours of collection. The antibody panel included: anti-CD3-FITC (clone SK7, BioLegend), anti-CD4-PerCP (clone SK3, BD Biosciences), anti-CD8-APC (clone SK1, BioLegend), anti-PD-1-PE (clone EH12.2H7, BioLegend), and anti-PD-L1-PE/Cy7 (clone 29E.2A3, BioLegend). Appropriate isotype controls were used. Red blood cells were lysed using BD FACS Lysing Solution. A minimum of 100,000 lymphocyte-gated events were acquired on a BD FACS Canto II flow cytometer and analyzed using FlowJo software.
Statistical analysis
All data were analyzed using SPSS version 26.0 (IBM, Armonk, NY, USA). Categorical variables were expressed as n (%), and non-normally distributed continuous variables were presented as medians with interquartile ranges. The Mann-Whitney U test was used for comparisons between groups, and the Wilcoxon signed-rank test was applied for pre- and post-treatment comparisons. Survival curves were generated using the Kaplan-Meier method and analyzed with the log-rank test, while survival rates were calculated with the life table method. Multivariable Cox stepwise regression was performed to adjust for confounding variables and to identify factors independently associated with overall survival as the dependent variable. Variables with P < 0.10 in univariable analysis were entered into a multivariable Cox proportional hazards model using a backward stepwise elimination procedure (removal criterion P > 0.05). Two-sided P-values <0.05 were considered statistically significant. P-values are reported to two or three decimal places.
Results
Characteristics of the patients
A total of 125 patients diagnosed with non-Hodgkin lymphoma were included in this study, comprising 65 males and 60 females, with a median age of 57 years (range, 14–86 years). All patients had an Eastern Cooperative Oncology Group performance status (ECOG PS) of 0–2. The clinical characteristics of the patients are presented in Table 1.
The associations between baseline clinical characteristics and the expression of peripheral blood lymphocyte PD-1 and PD-L1 in non-Hodgkin lymphoma are illustrated in Table 2. No significant associations were observed between PD-1 and PD-L1 expression and clinical parameters such as sex, age, disease status, pathological type, β2-microglobulin (β2MG) levels, ECOG PS, B symptoms, extranodal involvement, and bone marrow involvement. However, PD-1 expression on CD8+ T cells was significantly higher in patients with elevated LDH levels (>245 U/L) than in those with normal LDH levels (PD-1: 16.46 [12.40-23.96]% vs. 12.68 [10.54-16.84]%, P = 0.005), as shown in Table 2.
Patients with CR demonstrated lower PD-L1 expression
All patients underwent chemotherapy, and treatment responses were assessed in 103 individuals (82.4%). Among these evaluable patients, 34(33.0%) achieved CR, 62(60.2%) achieved PR, 6 (5.8%) experienced SD, and 1 patient exhibited PD. Notably, PD-L1 expression on CD4+ and CD8+ T cells was significantly lower in patients with CR compared to those without CR (CD4+: 11.14% [5.98-19.09] vs. 18.61% [1.63-23.55], P < 0.001; CD8+: 7.19% [4.21-10.65] vs. 10.60% [6.15-15.17], P = 0.032. PD-1 expression did not show any significant association with treatment response (Table 3).
Adverse reactions
Adverse reactions were documented in all patients, including hematological toxicity and infection. PD-1 expression on CD8+ T cells was found to be elevated in patients experiencing more severe leukopenia (15.72 [11.54-23.72]% vs. 12.69 [10.52-15.81]%, P = 0.008). Additionally, PD-1 expression on CD4+ T cells was significantly higher in patients with more severe anemia and thrombocytopenia (anemia: 26.25 [22.51-44.17]% vs. 22.31 [18.56-26.95]%, P = 0.018; thrombocytopenia:25.40 [20.50-29.56]% vs. 22.15 [18.56-26.63]%, P = 0.042) (Table 4).
Associations of PD-1 and PD-L1 with prognosis
Within a median follow-up period of 94.0 months (range: 0.0–132.0), fore patients (3.2%) were lost to follow-up, and 62 patients (49.6%) died from the disease. Table 5 presents the results of the univariable and multivariable analyses of prognostic factors for OS. The Cox multivariable analysis revealed that age >60 years (HR: 2.89 95% CI: 1.52-5.52; P=0.001), T cell NHL(HR: 2.90, 95% CI: 1.48-5.69 P = 0.002), stage III–IV disease (HR: 1.95, 95% CI: 1.02-3.71 P=0.043), severe anemia (HR: 2.96 95% CI: 1.28-6.85; P=0.011), and infection (HR: 2.57, 95% CI: 1.37-4.81; P=0.003) were independent predictors of OS. Notably, PD-1 and PD-L1 levels showed no significant association with prognosis.
Conversely, changes in PD-1 expression before and after treatment appeared to correlate with outcomes, as patients with decreased PD-1 levels post-treatment had longer OS. Blood samples were collected from 63 patients before and after treatment (57 received anthracycline-based chemotherapy, five received gemcitabine-based chemotherapy, and one received methotrexate-based chemotherapy) (Table 6). Two patients (3.2%) were lost to follow-up. Among the remaining patients, 39 (61.9%) demonstrated decreased CD4+ PD-1 levels post-treatment, while 24 patients (38.1%) exhibited an increase. Patients with reduced CD4+ PD-1 levels showed superior survival compared with those with increased levels (rP=0.066) (Figure 1).
Survival analysis in 63 patients with lymphoma. Overall survival (OS) was analyzed according to the change in PD-1+ CD4 +.
Discussion
This study explored the potential association between PD-1 and PD-L1 expression on peripheral blood lymphocytes and the progression of non-Hodgkin lymphoma. The findings indicate that peripheral blood lymphocyte PD-1/PD-L1 expression is associated with LDH, bone marrow involvement, and treatment response. A reduction in CD4+ PD-1 levels after treatment appeared to be associated with overall survival (OS) benefits. These observations suggest that monitoring peripheral blood lymphocyte PD-1 and PD-L1 could provide insights into treatment response and complications in non-Hodgkin lymphoma patients. Although the results are promising, further prospective studies are required to validate the clinical utility of PD-1/PD-L1 as biomarkers for monitoring disease progression and prognosis in non-Hodgkin lymphoma.
The observed lower peripheral PD-L1 expression on T cells in patients achieving CR likely reflects a reduced state of systemic immune activation and exhaustion following effective tumor debulking. In contrast, patients with PR, SD, or PD have persistent disease, which continuously presents tumor antigens (47). This chronic antigenic stimulation is a primary driver of T-cell exhaustion, characterized by the upregulation of inhibitory receptors like PD-1 and its ligand PD-L1. Persistent PD-L1 expression on CD4+ and CD8+ T cells in the non-CR group may thus serve as a surrogate marker for an ongoing, but ineffective, immune response against residual tumor cells. This exhausted phenotype is associated with impaired T-cell proliferation, cytokine production (e.g., IFN-γ, TNF-α), and cytotoxic function. Therefore, the failure to downregulate this checkpoint axis post-chemotherapy may indicate a tumor microenvironment that remains immunosuppressive and resistant to immune-mediated clearance, explaining the poorer outcomes in this group. Future studies correlating peripheral PD-1/PD-L1 levels with functional assays of T-cell exhaustion and tumor microenvironment analysis are warranted to validate this mechanistic link (48).
A decrease in CD4+ PD-1 after treatment was associated with improved overall survival. The results provide evidence that PD-1 and PD-L1 are involved in non-Hodgkin lymphoma prognosis. A decrease in PD-L1 expression after treatment in lymphoma may be a positive prognostic indicator (26, 27). While high PD-L1 expression is often associated with poor outcomes, its reduction suggests a potential response to treatment and may even improve survival. Similar results were observed in lung cancer (28), B-cell lymphoma (29), and DLBCL (30).
While the downregulation of PD-1/PD-L1 on tumor-infiltrating lymphocytes or soluble PD-L1 post-treatment has been documented in some lymphoma studies (cite relevant studies) (49), our study provides novel evidence that this dynamic change is also detectable and clinically relevant in the peripheral blood compartment. This is significant for two reasons. First, it supports the use of non-invasive liquid biopsy for monitoring immune checkpoint status. Second, our cohort consisted of patients treated predominantly with conventional chemotherapy, not PD-1/PD-L1 inhibitors. This suggests that effective chemotherapy itself can modulate the systemic immune checkpoint landscape, potentially by reducing tumor antigen burden and associated T-cell exhaustion (50). Our finding that this peripheral decrease is associated with better outcomes highlights its potential as a dynamic, systemic biomarker of effective anti-tumor response, irrespective of the specific therapy used.
The present study revealed that PD-1 and PD-L1 were expressed on peripheral blood CD4+ and CD8+ T cells in patients with non-Hodgkin lymphoma. This differed from a study in small cell lung cancer, in which PD-L1 was not detected (31). The present study also showed that patients with higher LDH levels or bone marrow involvement had higher CD8+ T cell PD-1 and PD-L1 expression compared with those with less severe disease. These findings are consistent with previous studies reporting that PD-1 expression levels on T cells may be positively associated with the progression of gastric cancer, chronic lymphocytic leukemia, and cervical cancer (23, 32, 33). MacFarlane et al. (34) similarly reported increased PD-1 expression on peripheral blood effector T cells in renal cell carcinoma, which was significantly reduced soon after surgical resection of the primary tumor. This could be explained by PD-1 expression being induced by high antigen concentration and prolonged antigen stimulation. Therefore, PD-1 expression in peripheral blood may serve as an immunological predictor of tumor progression and outcomes in lymphoma patients.
Although PD-L1 expression by tumor cells has been used as a biomarker for selecting patients for PD-L1/PD-1 checkpoint blockade therapies, patients whose tumor cells lack PD-L1 expression can still respond positively to such therapies (35). This suggests that PD-L1 expressed by non-malignant cells may contribute to antitumor immunity. In the present study, all patients were treated with chemotherapy. PD-L1 expression on CD4+ and CD8+ T cells was lower in those who achieved complete response (CR) compared with those who did not (i.e., PR, SD, or PD), while PD-1 expression showed no significant association with CR. This finding is supported by Wang et al. (36), who found that patients with extranodal NK/T-cell lymphoma had significantly elevated serum soluble plasma PD-L1 levels if they had increased LDH or failed to achieve CR following chemotherapy. Peripheral blood PD-L1 expression has also been associated with tumor progression and prognosis in gastric cancer, renal cell carcinoma, DLBCL, and multiple myeloma (37–41). On the other hand, in the present study, PD-1 and PD-L1 were not associated with overall survival. PD-L1 on effector CD8+ T cells is required for their survival and function (42), but higher CD8+ PD-L1+ expression here was linked to poorer treatment responses. This may reflect unique characteristics of PD-L1 expression and its role in non-Hodgkin lymphoma, requiring further investigation. Nevertheless, PD-L1 expression on T cells may serve as a predictive biomarker and highlight the potential usefulness of alternative immunological therapeutic strategies, including PD-1 axis inhibitors, in lymphoma.
PD-1 expression on CD8+ T cells was higher in patients with more severe leukopenia, while PD-1 expression on CD4+ T cells was higher in those with more severe anemia or thrombocytopenia. PD-1 expression on T cells has been linked to various hematological disorders, including anemia, thrombocytopenia, and leukopenia. Although the underlying mechanisms are not fully understood, PD-1 regulates T cell activity, and its dysregulation may contribute to immune-mediated damage to the hematopoietic system (43–45). PD-1 is strongly expressed on T cells in patients with aplastic anemia, implying a role in immune-mediated destruction of red blood cell precursors (45). PD-1 expression is also increased in CD4+ and CD8+ T cells in patients with active immune thrombocytopenia (ITP), further supporting the involvement of the PD-1/PD-L1 axis in disease pathogenesis (43, 44, 46).
This study has several limitations. First, it was conducted at a single institution and included a relatively small sample size, limiting the generalizability of the findings. Second, the retrospective design constrained the analysis to available patient records, potentially introducing selection or information bias. Additionally, the study assessed only peripheral blood PD-1 and PD-L1 expression without considering tumor-related parameters, limiting associations with tumor characteristics. Finally, all patients received chemotherapy, but the regimens varied, and results may not reflect broader treatment contexts. Therefore, further prospective studies are warranted to validate these findings and to explore the role of PD-1 and PD-L1 in lymphoma across different therapeutic approaches.
Conclusion
In summary, peripheral blood lymphocyte PD-1 and PD-L1 levels appear to be associated with clinical factors such as LDH levels, bone marrow involvement, treatment-related adverse events, and treatment efficacy in patients with non-Hodgkin lymphoma. Notably, a decrease in CD4+ PD-1 levels following treatment was associated with improved overall survival. Although these findings are promising, further studies are needed to confirm these associations and to explore their potential clinical applications in non-Hodgkin lymphoma management.
The reference list from the paper itself. Each links out to its DOI / PubMed record.
- 1Health Commission Of The People’s Republic Of China N . National guidelines for diagnosis and treatment of Malignant lymphoma 2022 in China (English version). Chin J Cancer Res. (2022) 34:425–46. doi: 10.21147/j.issn.1000-9604.2022.05.01, PMID: 36398117 PMC 9646456 · doi ↗ · pubmed ↗
- 2Wang XM Bassig BA Wen JJ Li GD Liu ZB Yao WX . Clinical analysis of 1629 newly diagnosed Malignant lymphomas in current residents of Sichuan province, China. Hematol Oncol. (2016) 34:193–9. doi: 10.1002/hon.2202, PMID: 25824105 PMC 6760855 · doi ↗ · pubmed ↗
- 3Shi Y . Current status and progress of lymphoma management in China. Int J Hematol. (2018) 107:405–12. doi: 10.1007/s 12185-018-2404-8, PMID: 29388166 · doi ↗ · pubmed ↗
- 4Ansell SM . Hodgkin lymphoma: 2023 update on diagnosis, risk-stratification, and management. Am J Hematol. (2022) 97:1478–88. doi: 10.1002/ajh.26717, PMID: 36215668 · doi ↗ · pubmed ↗
- 5Burton C Allen P Herrera AF . Paradigm shifts in hodgkin lymphoma treatment: from frontline therapies to relapsed disease. Am Soc Clin Oncol Educ Book. (2024) 44:e 433502. doi: 10.1200/EDBK_433502, PMID: 38728605 · doi ↗ · pubmed ↗
- 6NCCN Clinical Practice Guidelines in oncology (NCCN guidelines). B-Cell Lymphomas. Version 2.2025. Fort Washington: National Comprehensive Cancer Network (2025).
- 7NCCN Clinical Practice Guidelines in oncology (NCCN guidelines). Hodgkin Lymphoma. Version 2.2025. Fort Washington: National Comprehensive Cancer Network (2025).
- 8de Visser KE Joyce JA . The evolving tumor microenvironment: From cancer initiation to metastatic outgrowth. Cancer Cell. (2023) 41:374–403. doi: 10.1016/j.ccell.2023.02.016, PMID: 36917948 · doi ↗ · pubmed ↗