Junk food consumption and socio-demographic correlates among health sciences students in the UAE
Vimala Edwin, Mohamedanas Mohamedfaruk Patni, Ramya Kundayi Ravi, Priyalatha Muthu, Sirajunisa Talath, Nallan C. S. K. Chaitanya, Veronica Edwin Nayagam

TL;DR
This study explores how socio-demographic factors affect junk food consumption among health science students in the UAE.
Contribution
The study identifies specific socio-demographic predictors of junk food consumption among future healthcare professionals in the UAE.
Findings
Health science students show high awareness of junk food risks but moderate consumption, especially of beverages.
Age, gender, and self-rated health significantly predict BMI and eating behaviors.
Year 2 and Year 3 students consume the most junk food between meals.
Abstract
Junk food consumption is rising among university students despite well-documented health risks. This study examines the socio-demographic factors influencing junk food consumption among health professional students in the UAE. A validated, semi-structured questionnaire was used to assess junk-food awareness, consumption patterns, and behavioral preferences among health-professional students. The tool comprised sections on sociodemographic characteristics, awareness of junk food as unhealthy, consumption frequency, portion size, and eating behaviors. Awareness items were scored as 1 = Yes and 0 = No/Do not know, while consumption items were rated on a four-point scale (0–3) based on frequency. Internal consistency of the instrument was confirmed through pilot testing, with Cronbach’s alpha = 0.82 for awareness items and 0.79 for consumption items. Awareness of junk food hazards was…
Genes, proteins, chemicals, diseases, species, mutations and cell lines named across the full text — each resolved to its canonical identifier and authoritative record.
Click any figure to enlarge with its caption.
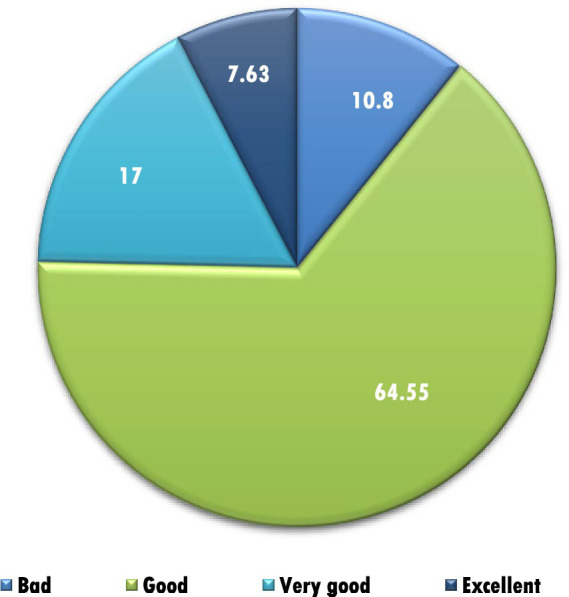 Figure 1
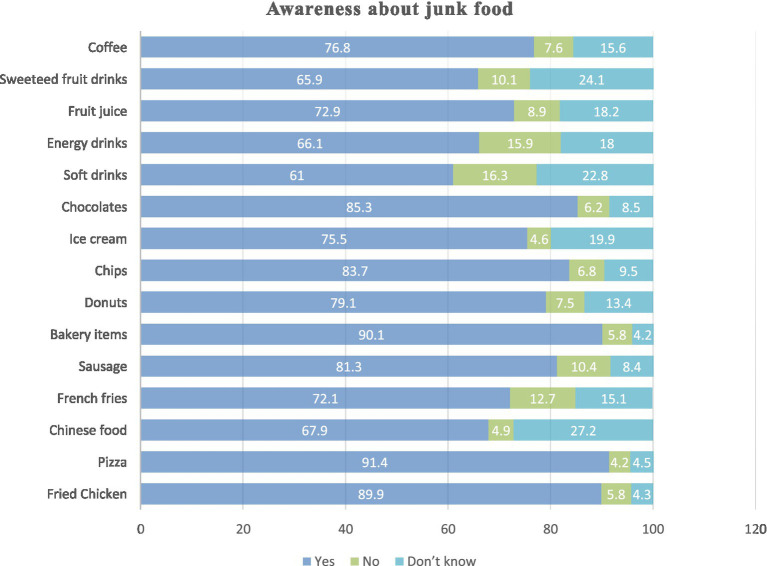 Figure 2
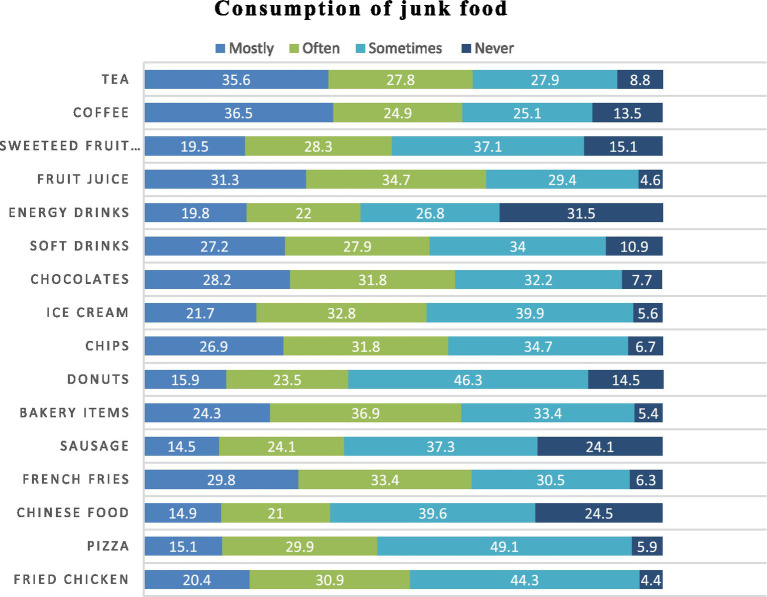 Figure 3
| Sociodemographic variable | Frequency [%] |
|---|---|
| Age | |
| < 18 years | 118 [17] |
| 19–20 | 304 [43.8] |
| 21–22 | 196 [28.2] |
| 23–24 | 59 [8.5] |
| >24 years | 17 [2.4] |
| Mean ± SD = 20.27 ± 1.91 | |
| Gender | |
| Male | 194 [27.9] |
| Female | 500 [72.1] |
| Year of study | |
| 1 | 144 [20.7] |
| 2 | 188 [27.1] |
| 3 | 237 [34.1] |
| 4 | 55 [7.9] |
| 5 | 70 [10.2] |
| Type of family | |
| Nuclear | 423 [60.9] |
| Joint | 271 [39.1] |
| Living with whom? | |
| Parents | 484 [67.5] |
| Relative | 18 [2.5] |
| Hostel | 123 [17.1] |
| Friends | 14 [2] |
| Alone | 55 [7.9] |
| Weight in kg [Mean ± SD] | |
| Boys | 79.54 |
| Girls | 60.21 |
| Height in meter [Mean ± SD] | |
| Boys | 1.76 |
| Girls | 1.61 |
| Money spent on junk food | |
| <10 | 62 |
| 11–20 | 140 |
| 21–30 | 143 |
| 31–40 | 120 |
| >40 | 229 |
| Scores | Gender | t or | ||
|---|---|---|---|---|
| Male | Female | |||
| Mean awareness score ± SD | 11.12 ± 3.74 | 11.77 ± 3.51 | 2.080 |
|
| Mean Consumption score ± SD | 26.23 ± 9.91 | 28.39 ± 10.43 | 2.531 |
|
| Questions | Responses | Male | Female | χ2 value | |
|---|---|---|---|---|---|
| Why do you prefer junk food | Delicious taste | 110 | 312 | 2.041 | 0.56 |
| Attractive ads | 14 | 34 | |||
| Easily available | 54 | 125 | |||
| Lack of other options | 15 | 29 | |||
| What time do you prefer junk food? | 8 a.m. to 12 p.m. | 19 | 44 | 4.72 | 0.193 |
| 1–6 pm | 65 | 197 | |||
| 7–10 p.m. | 82 | 212 | |||
| After 10 p.m. | 28 | 47 | |||
| How much portion of junk food do you usually eat? | Large | 49 | 49 | 36.48 |
|
| Medium | 118 | 306 | |||
| Small | 27 | 145 | |||
| Do you feel your junk food habits is increasing? | Yes | 62 | 148 | 3.684 | 0.159 |
| No | 95 | 222 | |||
| Not sure | 37 | 130 | |||
| Do you eat junk food between regular meals? | Yes | 63 | 109 | 14.48 |
|
| No | 97 | 242 | |||
| Sometimes | 34 | 149 | |||
| Do you check nutrient fact labels on junk food? | Yes | 75 | 156 | 3.685 | 0.158 |
| No | 75 | 209 | |||
| Sometimes | 44 | 135 | |||
| Where do you get lunch on a typical university day? | No lunch | 48 | 149 | 10.928 |
|
| Home | 63 | 120 | |||
| Campus cafeteria | 40 | 146 | |||
| Restaurants | 43 | 85 | |||
| How many times in a day do you eat junk food | Once a day | 144 | 379 | 0.593 | 0.743 |
| Two times a day | 41 | 94 | |||
| More than 2 times/day | 9 | 27 |
| Questions | Responses | Year 1 | Year 2 | Year 3 | Year 4 | Year 5 | χ2 value | |
|---|---|---|---|---|---|---|---|---|
| Why do you prefer junk food | Delicious taste | 99 | 115 | 140 | 32 | 35 | 14.81 | 0.25 |
| Attractive ads | 6 | 16 | 20 | 2 | 6 | |||
| Easily available | 28 | 50 | 62 | 16 | 22 | |||
| Lack of other options | 11 | 7 | 15 | 5 | 7 | |||
| What time do you prefer junk food? | 8 a.m. to 12 p.m. | 13 | 19 | 22 | 4 | 5 | 15.45 | 0.22 |
| 1–6 pm | 44 | 82 | 93 | 19 | 24 | |||
| 7–10 p.m. | 62 | 69 | 104 | 26 | 33 | |||
| After 10 p.m. | 25 | 18 | 18 | 6 | 8 | |||
| How much portion of junk food do you usually eat? | Large | 10 | 28 | 40 | 4 | 16 | 18.19 |
|
| Medium | 94 | 123 | 137 | 35 | 35 | |||
| Small | 40 | 37 | 60 | 16 | 19 | |||
| Do you feel your junk food habits is increasing? | Yes | 29 | 53 | 89 | 16 | 23 | 22.39 |
|
| No | 65 | 91 | 96 | 29 | 36 | |||
| Not sure | 50 | 44 | 52 | 10 | 11 | |||
| Do you eat junk food in between regular meals? | Yes | 19 | 49 | 75 | 9 | 20 | 23.67 |
|
| No | 78 | 88 | 106 | 28 | 39 | |||
| Sometimes | 47 | 51 | 56 | 18 | 11 | |||
| Do you check nutrient fact label on junk food? | Yes | 45 | 61 | 83 | 17 | 25 | 3.5 | 0.899 |
| No | 60 | 82 | 92 | 20 | 30 | |||
| Sometimes | 39 | 45 | 62 | 18 | 15 | |||
| Where do you get lunch on a typical university day? | No lunch | 37 | 47 | 74 | 14 | 25 | 22.51 |
|
| Home | 40 | 53 | 57 | 13 | 20 | |||
| Campus cafeteria | 46 | 50 | 63 | 21 | 6 | |||
| Restaurants | 21 | 38 | 43 | 7 | 19 | |||
| How many times in a day do you eat junk food | Once a day | 117 | 134 | 173 | 41 | 58 | 9.549 | 0.298 |
| Two times a day | 22 | 44 | 50 | 9 | 10 | |||
| More than 2 times/day | 5 | 10 | 14 | 5 | 2 |
| Variable | Regression coefficient | Wald’s statistic [t] | 95% confidence interval | ||
|---|---|---|---|---|---|
| Lower bound | Upper bound | ||||
| Constant | 22.47 | 11.35 |
| 18.58 | 26.536 |
| Age (years) | 0.322 | 3.72 |
| 0.15 | 0.49 |
| Gender (male vs female) | −2.074 | −5.51 |
| −2.81 | −1.33 |
| Rating own health (self-rated health) | −0.793 | −3.55 |
| −1.23 | −0.35 |
| Portion of junk food (portion size/unit) | 0.909 | 3.31 |
| 0.37 | 1.45 |
Peer Reviews
No public reviews on file for this paper yet. If you reviewed it on a platform where reviews are public (OpenReview, ICLR, NeurIPS, ICML), you can paste yours below so the community can read it here.
Videos
No videos yet. Explain this paper in a talk, walkthrough, or lecture? Add one.
Taxonomy
TopicsFood Safety and Hygiene · Consumer Attitudes and Food Labeling · Obesity, Physical Activity, Diet
Introduction
1
Eating habits among university students have changed rapidly in recent years, with increasing reliance on convenient, inexpensive, and highly palatable foods. This trend is driven by academic pressures, limited time for meal preparation, aggressive food marketing, and the widespread availability of fast foods across university environments (1–3). Of particular concern is junk food, broadly defined as readily available products high in calories, sugar, fat, and salt, but low in essential nutrients such as fiber, vitamins, and minerals (4, 5). Examples include fried fast foods, confectionery, sweetened beverages, savory snacks, processed meats, and other ultra-processed items (6).
Although junk food is often consumed for its taste, convenience, and social appeal, regular intake is associated with poor dietary quality and long-term health risks (2, 7). University students represent a critical population for studying these behaviors, as dietary patterns established during this formative period often persist into adulthood (8, 9). Health professional students are of particular interest: while they face the same environmental pressures that encourage unhealthy eating, they also represent the future health workforce. Their personal dietary habits may influence their credibility, attitudes toward patient counseling, and willingness to model healthy lifestyle behaviors (10, 11). Understanding junk food awareness and consumption in this group, therefore, has implications not only for their own well-being but also for broader health promotion efforts across university campuses.
In the United Arab Emirates (UAE), rapid economic and nutritional transitions have contributed to increased consumption of energy-dense, nutrient-poor foods among adolescents and young adults (12). This shift has been linked to rising rates of overweight, obesity, and metabolic risk factors, underscoring the growing public health impact of modern dietary patterns (13, 14). While previous studies in the UAE and wider Gulf region have examined general dietary habits, obesity trends, and lifestyle risk factors among university students, limited evidence specifically addresses junk food awareness, consumption patterns, and the socio-demographic determinants of these behaviors among health professional students. Much of the existing research has focused broadly on nutritional status or fast-food intake without evaluating the gap between knowledge of unhealthy food choices and actual consumption, highlighting a significant area for further investigation (15).
Addressing this gap is particularly relevant in the UAE, where lifestyle-related conditions such as obesity, metabolic syndrome, and diabetes continue to rise (16). This study, therefore, investigates the socio-demographic factors influencing junk food consumption among health professional students. As future healthcare providers, their health behaviors may affect both their professional practice and patient counseling. By assessing awareness and consumption patterns, this study aims to identify the factors associated with dietary choices and provide evidence to inform targeted health promotion initiatives within universities.
Materials and methods
2
Study design
2.1
A quantitative, descriptive cross-sectional study was undertaken to examine the socio-demographic correlates of junk food consumption among undergraduate students enrolled in medical, dental, pharmacy, and nursing programs at a Health Sciences University. Ethical approval was obtained from the Research and Ethics Committee of the institution [Reference: RAKMHSU-REC-213-2022/23-F-N].
Study setting
2.2
The study was conducted at a semi-government Health Sciences University located in Ras Al Khaimah, in the northern emirates of the United Arab Emirates. The university hosts diverse undergraduate cohorts across Medicine, Dentistry, Pharmacy, and Nursing programs.
Study population
2.3
The study population comprised undergraduate students of both sexes, representing all academic years and programs.
Sample size
2.4
The required sample size was calculated using the Raosoft sample size calculator (Raosoft, Inc., 2004) based on a total student population of 1,245, with a 5% margin of error, 95% confidence level, and 50% response distribution. The minimum required sample size was 294. To strengthen validity, all eligible and consenting students present during data collection were included, yielding a final sample of 694 participants.
Data collection instrument
2.5
Data were collected using a semi-structured, self-administered questionnaire developed in English, drawing from existing literature on similar research topics (17–19). Content validity was established through expert review, and reliability was tested in a pilot study of 30 students (excluded from the final sample). Cronbach’s alpha values indicated good internal consistency (0.82 for awareness items, 0.79 for consumption frequency items).
The questionnaire comprised of four sections. Section I comprised of socio-demographic data [age, gender, academic year, program of study- Medicine, Dentistry, Pharmacy, and Nursing, height, weight, family and living status, junk food consumption frequency, weekly expenditure in AED, and self-rated health].
Section II included five questions that assessed general awareness of junk food (an example of the item was “Junk foods contain less nutrient and are unhealthy for all age groups”) and ten questions regarding knowledge of health hazards of junk food consumption (an example of the item was “Frequent intake of junk-food leads to extra weight gain and obesity”) using a three-point response format [Yes, No, I do not know]. For every item, a score of 1 was assigned if the participant responded “Yes,” indicating correct awareness. Responses of “No” or “Do not know” were both assigned a score of 0, as they reflected lack of awareness. The total awareness score for each participant was obtained by summing the scores across all items.
Section III evaluated junk food consumption preferences on a four-point scale [Mostly, Often, Sometimes, Never]. The question was “How frequently do you consume the following?”. The items included were fried chicken, pizza, Chinese food, French fries, sausage, bakery items, donuts, chips, ice-cream, chocolates, soft drinks, energy drinks, Fresh fruit juice, sweetened fruit drinks and coffee. The responses were converted into numerical values of 3, 2, 1, and 0, respectively. These item-level scores were summed up to generate a total consumption score, where higher values indicated more frequent intake of junk food items. Both total scores were used as continuous variables for subsequent statistical analyses.
Section IV assessed attitudes toward junk food preferences through eight structured items. There were three questions asked with four response categories “Why do you prefer junk food?” (Delicious taste, Attractive advertisements, Easy availability, Lack of other suitable option); “What time do you prefer to eat junk food?” (11.00 a.m.-12. 00 p.m, 1.00–6.00 p.m., 7.00–10.00 p.m. after 10.00 p.m.); “Where do you get lunch on a typical university day?” (I do not eat my lunch, I go home during lunch time, I eat lunch at campus cafeteria, I eat lunch outside such as restaurant, café) and five questions were asked with three response categories: “How much portion size of junk food do you usually eat?” (Large, Medium, Small); Do you feel your junk food habits is increasing day by day? (Yes, no, I am not sure); Do you eat junk food in between regular meals? (Yes, no, Sometimes); Do you have the habits of checking the nutrient fact label in the junk food? (Yes, no, Sometimes); How many times in a day do you eat the junk food? (Once a day, Two times day, more than two times a day). Portion size categories (small, medium, large) were based on standardized descriptions provided to participants to minimize subjective variation. Students were instructed to classify their usual portion according to the examples given (e.g., “small = minimal amount,” “medium = standard single serving,” “large = more than one serving or a visibly large portion”).
Data collection procedure
2.6
Participation was voluntary, with informed consent obtained before questionnaire administration. No incentives were provided. Data were collected face-to-face in classrooms during free periods between September 29 and November 15, 2024. Of 718 responses, 24 incomplete questionnaires were excluded, resulting in 694 valid responses (response rate: 58%).
Data analysis
2.7
Data were analyzed using SPSS version 29. Categorical variables were summarized using frequencies and percentages. Continuous variables, such as age and weekly junk food expenditure, were presented as means and standard deviations. Chi-square tests assessed associations between sociodemographic variables and levels of awareness regarding junk food and its health implications. ANOVA was used to compare mean awareness and consumption scores across academic programs and demographic groups. Multiple linear regression analyses examined the impact of predictors such as age, sex, and weekly expenditure on consumption frequency and BMI. Regression coefficients with 95% confidence intervals and p-values were reported to identify significant predictors. A p-value of <0.05 was considered statistically significant. This approach allowed for a comprehensive evaluation of junk food consumption patterns and their associations with sociodemographic factors in the study population.
Results
3
A total of 694 undergraduate students participated (mean age 20.3 ± 1.9 years). The majority were female (72.1%), and most lived with parents in nuclear families. Students were distributed across all academic years, with Year 3 comprising the largest group (34.1%). Weekly expenditure on junk food varied, with one-third of students reporting spending more than 40 AED (Table 1). Most participants rated their health as “good” (64.5%), followed by “very good” (17%) and “excellent” (7.6%) (Figure 1).
Self-reported health ratings (n = 694).
Awareness was generally high for common items such as pizza (91.4%), bakery products (90.1%), fried chicken (89.9%), chips (88.7%), and chocolates (85.3%). Awareness was lower for beverages, including energy drinks (61.0%) and sweetened fruit drinks (65.9%). Items such as sausages, French fries, and Chinese food showed higher proportions of “do not know” responses, reflecting uncertainty among students (Figure 2).
Awareness about junk food among study participants (n = 694).
Despite high awareness, moderate consumption persisted. Beverages and snack items were most frequently consumed: tea (63.4% “mostly/often”), coffee (61.4%), soft drinks (55.1%), chocolates (60.0%), and chips (58.7%). Fried chicken and French fries also showed substantial intake. In contrast, energy drinks, donuts, sausages, and Chinese food were consumed less frequently, with higher proportions reporting “sometimes” or “never” (Figure 3).
Consumption of junk food among study participants (n = 694).
Table 2 presents the mean awareness and consumption scores for junk food across various socio-demographic groups among the study participants (n = 694). Gender-wise comparison showed that females had significantly higher awareness scores than males (11.77 ± 3.51 vs. 11.12 ± 3.74, p = 0.038), and also demonstrated significantly higher consumption scores (28.39 ± 10.43 vs. 26.23 ± 9.91, p = 0.012). No statistically significant differences in awareness or consumption scores were observed between students from nuclear and joint families. When analyzed by year of study, awareness scores did not differ significantly, although Year 4 students showed the highest mean awareness score. Consumption scores varied significantly across academic years (p < 0.001), with Year 2 students reporting the highest consumption levels. Living status showed no significant association with either awareness or consumption scores. Weekly expenditure on junk food was not significantly associated with awareness; however, consumption scores increased progressively with higher spending categories, with a statistically significant difference across groups (p = 0.001).
Gender-specific differences were noted in portion size (p < 0.0001), with males more likely to report large portions, and in eating between meals (p < 0.001), where females more often reported “sometimes.” Lunch source also differed (p = 0.012), with females more frequently eating at campus cafeterias and males reporting restaurant meals or skipping lunch (Table 3).
Year-wise comparisons revealed significant variation in portion size (p = 0.0198), perceived increase in junk food habits (p = 0.004), and eating between meals (p = 0.002). Year 3 students were most likely to consume junk food as snacks and report larger portions. Lunch source also varied, with Year 1 and Year 3 students more often reporting cafeteria meals, while Year 5 students reported restaurant lunches (Table 4).
Multiple linear regression was conducted to identify predictors of body mass index (BMI) among participants. Age, gender, self-rated health, and portion size of junk food emerged as significant predictors (Table 5). Specifically, BMI increased with age (B = 0.322, p < 0.0001) and larger portion sizes (B = 0.909, p < 0.0001). In contrast, female gender (B = −2.074, p < 0.0001) and better self-rated health (B = −0.793, p < 0.0001) were associated with lower BMI. These findings suggest that both demographic and behavioral factors contribute meaningfully to variations in BMI among health sciences students.
Discussion
4
This study sheds light on socio-demographic factors influencing junk food consumption among health professional students in the United Arab Emirates. Although awareness of the health risks associated with junk food was high, moderate levels of intake persisted, particularly in the form of beverages such as tea, coffee, and soft drinks. This disconnect between knowledge and practice highlights the broader challenge of converting awareness into healthier eating behaviors. Gender differences were notable: female students reported both greater awareness and higher consumption scores. Comparable findings have been observed in other UAE university cohorts, where stress, academic demands, and lifestyle pressures contributed to unhealthy eating habits (20). These results suggest that interventions should be tailored to gender-specific needs, addressing both social influences and environmental constraints. Patterns related to year of study and spending also emerged as significant. Students in their second and third years reported higher consumption, likely reflecting heavier academic workloads, stress, and reliance on inexpensive, quick meals. Unsurprisingly, students who allocated more money to junk food consumed it more frequently, underscoring the role of affordability and accessibility. The increasing use of online food delivery platforms has further normalized junk food consumption, with convenience and cost acting as major drivers (21).
Regression analysis revealed that age, gender, self-rated health, and portion size were significant predictors of BMI. Students who rated their health more positively tended to have lower BMI, suggesting that self-perception may align with healthier dietary practices. Comparable studies reinforce these findings: Algamdi (22) reported that gender and self-esteem strongly influenced BMI among Saudi university students. Rojo-Ramos et al. (23) found similar gender-based differences in body image and BMI among Spanish cohorts. Wang et al. (24) demonstrated that higher BMI was associated with poorer self-rated health in Chinese adults and Joshi et al. (25) highlighted that Indian adolescents with higher BMI reported lower self-esteem.
Within the UAE, Al Sabbah et al. and earlier studies in Ajman and Dubai confirmed that dietary behaviors, reliance on food delivery, and lifestyle factors significantly shaped BMI outcomes among female students (26–28). Together, these studies validate that age, gender, and self-perception are consistent predictors of BMI across diverse contexts, underscoring the importance of integrating behavioral counseling and self-awareness into health promotion strategies. Placing these results within the UAE’s public health context is essential. Non-communicable diseases account for 55% of deaths nationally and impose an economic burden of nearly AED 40 billion annually, equivalent to 2.7% of GDP (29). Dietary risks are a major contributor, and health professional students as future providers represent a critical group whose personal habits may influence both their own health and their ability to counsel patients. Addressing junk food consumption among this population is therefore both a matter of individual well-being and professional responsibility. The Ministry of Health and Prevention’s 2023–2026 strategy and the 2024 National Plan to Combat Noncommunicable Diseases emphasize promoting healthier lifestyles and reducing diet-related risks (30, 31). Overall, the findings highlight that awareness alone is insufficient. Structural measures — such as improving access to affordable healthy food options on campuses, embedding nutrition education into curricula, and designing culturally sensitive campaigns—are necessary to shift behaviors. By situating these findings within the UAE’s socio-economic and cultural context, this study provides evidence to inform both policy and practice aimed at reducing the burden of diet-related NCDs.
Limitations
4.1
In the present study, which has a cross-sectional design, inferences on the causal links between sociodemographic factors and junk food consumption cannot be assured. A longitudinal design is thus desirable to track temporal changes in eating behavior and their influence on health outcome measures. Second, self-reported measures may lead to bias owing to social desirability. Also, although the questionnaire included items assessing general awareness of junk food and a set of ten questions related to health hazards, it did not comprehensively evaluate students’ detailed understanding of the specific harmful health effects associated with the consumption of individual junk food products. As such, while overall awareness was captured, the tool may not fully reflect the depth or breadth of participants’ knowledge regarding the medical and physiological consequences of junk food intake. This limitation may have led to a partial underestimation of true knowledge levels.
Conclusion
5
This study provides clear evidence that while health professional students in the UAE demonstrate high levels of awareness regarding junk food and its health risks, the awareness is not necessarily converted into healthier eating habits. Socio-demographic differences were notable: females demonstrated higher awareness and consumption scores, while students in their second and third academic years showed significantly higher consumption, especially between meals. Consumption patterns were highly correlated with weekly expenditure, emphasizing the role of affordability and accessibility. More interestingly, the regression model revealed that age, gender, self-rated health, and portion size were the significant predictors for BMI, indicating the cumulative effects of demographic and behavioral factors on the nutritional status of students.
These findings have several practical implications for university health promotion strategies. The interventions need to be advanced beyond knowledge-based approaches by including behavioral, environmental, and structural elements, such as increasing the healthy food availability on campus, banning aggressive marketing of unhealthful foods, and incorporating nutrition counselling into the health sciences curriculum. From a policy perspective, universities can clearly support the UAE’s national NCD prevention agenda by implementing campus-wide wellness policies that include portion control and promote culturally tailored dietary advice.
For future research, longitudinal studies are needed to clarify causal pathways between awareness, behavior, and BMI, as well as to evaluate targeted interventions that address gender-specific needs, spending habits, and stress-related eating patterns. Qualitative studies may also provide an explanation of why knowledge does not always translate into healthier choices. Overall, this study emphasizes the need for multi-level, evidence-based interventions aimed at reducing junk food consumption and promoting healthier lifestyles among prospective health professionals.
The reference list from the paper itself. Each links out to its DOI / PubMed record.
- 1Kerkadi A Sadig AH Bawadi H Al Thani AAM Al Chetachi W Akram H . The relationship between lifestyle factors and obesity indices among adolescents in Qatar. Int J Environ Res Public Health. (2019) 16:4428. doi: 10.3390/ijerph 16224428, 31766192 PMC 6888352 · doi ↗ · pubmed ↗
- 2Al-Hazzaa HM Abahussain NA Al-Sobayel HI Qahwaji DM Musaiger AO. Lifestyle factors associated with overweight and obesity among Saudi adolescents. BMC Public Health. (2012) 12:354. doi: 10.1186/1471-2458-12-354, 22591544 PMC 3433359 · doi ↗ · pubmed ↗
- 3Nelson MC Story M Larson NI Neumark-Sztainer D Lytle LA. Emerging adulthood and college-aged youth: an overlooked age for weight-related behavior change. Obesity (Silver Spring). (2008) 16:2205–11. doi: 10.1038/oby.2008.365., 18719665 · doi ↗ · pubmed ↗
- 4Monteiro CA Moubarac JC Cannon G Ng SW Popkin B. Ultra-processed products are becoming dominant in the global food system. Obes Rev. (2013) 14 Suppl 2:21–8. doi: 10.1111/obr.12107., 24102801 · doi ↗ · pubmed ↗
- 5Innes-Hughes C Hardy LL Venugopal K King LA Wolfenden L Rangan A. Children's consumption of energy-dense nutrient-poor foods, fruit and vegetables: are they related? An analysis of data from a cross sectional survey. Health Promot J Austr. (2011) 22:210–6. doi: 10.1071/he 11210., 22497065 · doi ↗ · pubmed ↗
- 6Moodie R Stuckler D Monteiro C Sheron N Neal B Thamarangsi T . Profits and pandemics: prevention of harmful effects of tobacco, alcohol, and ultra-processed food and drink industries. Lancet. (2013) 381:670–9. doi: 10.1016/S 0140-6736(12)62089-3, 23410611 · doi ↗ · pubmed ↗
- 7Rousham EK Goudet S Markey O Griffiths P Boxer B Carroll C . Unhealthy food and beverage consumption in children and risk of overweight and obesity: a systematic review and Meta-analysis. Adv Nutr. (2022) 13:1669–96. doi: 10.1093/advances/nmac 032, 35362512 PMC 9526862 · doi ↗ · pubmed ↗
- 8Lonati E Cazzaniga E Adorni R Zanatta F Belingheri M Colleoni M . Health-related lifestyles among university students: focusing on eating habits and physical activity. Int J Environ Res Public Health. (2024) 21:626. doi: 10.3390/ijerph 21050626, 38791840 PMC 11120768 · doi ↗ · pubmed ↗