Reducing Educational Bias in Cognitive Assessment via Dynamic Support Vector Machine Weighting: Validation Study on an Education-Stratified Dataset
Qing Liu, Chi Ma, Mengyuan Liu, Suhui Chen, Mengting Yu, Lijuan Xia, Qi Zhang, Ming Wu

TL;DR
This study improves the fairness of a common cognitive test by adjusting it for different education levels using a machine learning method.
Contribution
A novel education-adaptive weighting strategy using support vector machines to reduce bias in cognitive assessments.
Findings
Dynamic weighting improved accuracy most in illiterate individuals (Δ=7.25%) and primary school groups (Δ=3.12%).
Education-specific subitem contributions were identified, such as spatial orientation for illiterate groups and executive functions for university-educated individuals.
External validation confirmed the generalizability of the education-stratified weighting approach.
Abstract
The Mini-Mental State Examination (MMSE) remains widely used for cognitive screening, yet its performance varies substantially across educational backgrounds. Linear education corrections fail to capture the nonlinear interference patterns among subitems. This study aimed to analyze how educational level shapes MMSE subitem contributions and to develop an education-adaptive optimization strategy using support vector machine–based weighting. MMSE data from 812 participants were stratified into 4 education groups. Subitem deletion experiments quantified each subitem’s contribution (Δ). Education-specific support vector machine models were then constructed to derive dynamic weighting coefficients. Performance improvements were assessed before and after weighting. The illiterate group relied heavily on spatial orientation and memory, whereas university-educated individuals depended more…
Genes, proteins, chemicals, diseases, species, mutations and cell lines named across the full text — each resolved to its canonical identifier and authoritative record.
Click any figure to enlarge with its caption.
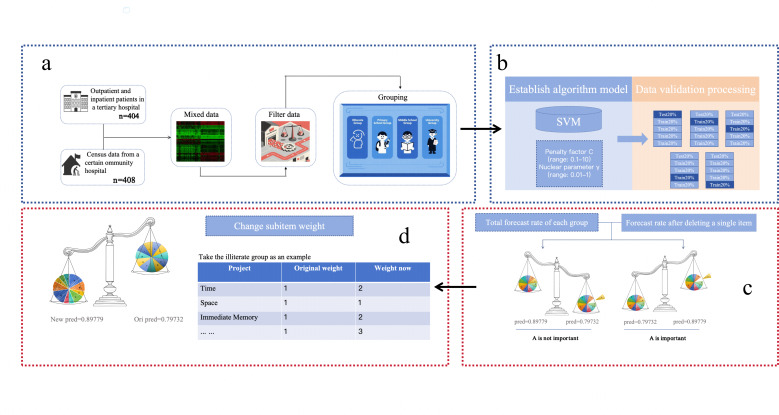 Figure 1
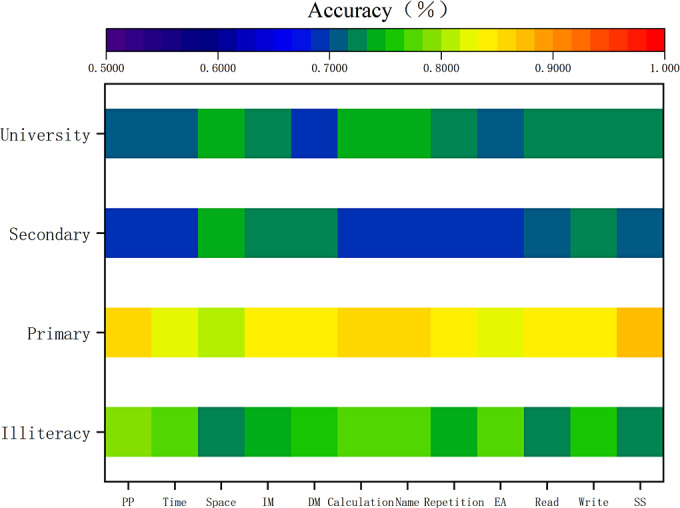 Figure 2
| Source | Number (n) | Inclusion criteria | Exclusion criteria | Data assessment requirements |
|---|---|---|---|---|
| Clinical dataset | 404 |
Outpatients and inpatients with clinically confirmed cognitive impairment Complete clinical and assessment records |
Patients who underwent surgery or died during hospitalization Missing MMSE |
For clinical data: All MMSE assessors completed a standardized 12-h training program and passed certification. Postcollection, automated missing value detection and manual verification were performed. |
| Community dataset | 408 |
Community residents with no medical consultation for cognitive complaints within the past 12 mo Intact consciousness and ability to complete cognitive assessments |
Individuals with diagnosed mild cognitive impairment or suspected cognitive decline Individuals with incomplete assessment procedures or severe organic neurological conditions |
For community data: Assessments followed standardized community screening procedures. Assessments were administered following standardized community screening procedures with verification of data completeness and adherence to protocol. |
| Characteristic | Illiterate (n=108) | Primary school (n=105) | Secondary school (n=364) | University (n=235) | |
|---|---|---|---|---|---|
| Age, mean (SD) | 59.02 (8.5) | 58.55 (7.8) | 58.62 (8.1) | 56.7 (7.4) | .05 |
| Gender, n (%) | .37 | ||||
| Male | 67 (62.0) | 60 (57.1) | 219 (60.2) | 140 (59.6) | |
| Female | 41 (38.0) | 45 (42.9) | 145 (39.8) | 95 (40.4) | |
| Data source, n (%) | |||||
| Clinical | 60 (55.6) | 53 (50.5) | 185 (50.8) | 106 (45.1) | |
| Community | 48 (44.4) | 52 (49.5) | 179 (49.2) | 129 (54.9) |
| Group | Prediction accuracy before weighting | Prediction accuracy after weighting | Orientation (time) | Orientation (space) | Memory (immediate) | Memory (delayed) | Attention and calculation |
|---|---|---|---|---|---|---|---|
| Illiterate (%) | 79.83 | 86.08 | 1 | 3 | 2 | 2 | 1 |
| Primary school (%) | 85.71 | 88.16 | 2 | 3 | 2 | 2 | 1 |
| Secondary school (%) | 69.78 | 69.83 | 2 | 3 | 2 | 1 | 2 |
| University (%) | 71.49 | 73.62 | 1 | 3 | 2 | 2 | 2 |
| Group | Naming | Repetition | Execution ability | Reading | Writing | Spatial structure |
|---|---|---|---|---|---|---|
| Illiterate (%) | 3 | 3 | 2 | 3 | 2 | 3 |
| Primary school (%) | 1 | 2 | 3 | 2 | 2 | 1 |
| Secondary school (%) | 2 | 2 | 2 | 1 | 1 | 1 |
| University (%) | 2 | 3 | 1 | 1 | 2 | 2 |
| Education group and metric | Before weighting | After weighting | Improvement (Δ) | |
|---|---|---|---|---|
| Illiterate | 7.25% | .06 | ||
| Accuracy (%) | 78.83 | 86.08 | ||
| Sensitivity (%) | 81.45 | 84.92 | ||
| Specificity (%) | 76.21 | 87.24 | ||
| AUC | 0.835 | 0.912 | ||
| Primary school | 2.45% | .03 | ||
| Accuracy (%) | 85.71 | 88.16 | ||
| Sensitivity (%) | 86.10 | 88.54 | ||
| Specificity (%) | 85.32 | 87.78 | ||
| AUC | 0.894 | 0.928 | ||
| Secondary school | 0.05% | .46 | ||
| Accuracy (%) | 69.78 | 69.83 | ||
| Sensitivity (%) | 70.25 | 70.31 | ||
| Specificity (%) | 69.31 | 69.35 | ||
| AUC | 0.752 | 0.753 | ||
| University | 2.13% | .18 | ||
| Accuracy (%) | 71.49 | 73.62 | ||
| Sensitivity (%) | 72.15 | 74.88 | ||
| Specificity (%) | 70.83 | 72.36 | ||
| AUC | 0.768 | 0.795 |
| Optimization strategy | Key methodology | Data requirements | Advantages | Limitations |
|---|---|---|---|---|
| Traditional linear correction (eg, MMSE | Linear regression and fixed point addition | MMSE scores+demographics | Simple calculation and clinically familiar | Ignored nonlinear “cognitive interference” and low precision |
| Standard machine learning (eg, RF | Black box classification using raw scores | MMSE subitems or total scores | High classification accuracy | Low interpretability (“black box”) and hard to explain to clinicians |
| Multimodal fusion models | Deep learning (CNN | MRI | Highest accuracy (>90%) and comprehensive pathology mapping | High cost, low accessibility in primary care, and complex deployment |
| This study (dynamic weighted SVM) | Nonlinear dynamic weighting via SVM | MMSE subitems only (low cost) | High interpretability (visible weights), education adaptive, and high accessibility | Accuracy is lower than multimodal models (feature limitation) |
Peer Reviews
No public reviews on file for this paper yet. If you reviewed it on a platform where reviews are public (OpenReview, ICLR, NeurIPS, ICML), you can paste yours below so the community can read it here.
Videos
No videos yet. Explain this paper in a talk, walkthrough, or lecture? Add one.
Taxonomy
TopicsPsychometric Methodologies and Testing · Cognitive Abilities and Testing · Functional Brain Connectivity Studies
Introduction
The Mini-Mental State Examination (MMSE) is one of the most widely used cognitive screening tools in clinical and community settings, designed for the rapid detection of cognitive impairment [1]. Since its development by Folstein et al in 1975 [2], the MMSE has become a core instrument for assessing five cognitive domains—orientation, immediate recall, attention or calculation, language, and visuospatial ability—and can typically be completed within 10 to 15 minutes [3]. Its broad adoption reflects its operational simplicity and solid psychometric performance, with reported sensitivity of 80% to 85% and specificity of 75% to 80% for dementia screening [4].
Alzheimer disease is characterized by progressive neurodegeneration, including amyloid-β deposition and structural decline. As Alzheimer disease progresses in a relatively predictable neuroanatomical sequence, MMSE subdomains provide clinically meaningful stage markers: orientation and memory deficits often correspond to early hippocampal involvement, while language and visuospatial impairments reflect later temporoparietal degeneration [56]. This multidimensional structure allows the MMSE to map aspects of the disease trajectory beyond a single total score.
Nevertheless, the diagnostic performance of the MMSE varies considerably across educational levels [78]. Individuals with higher education often exhibit false-negative results due to two well-recognized mechanisms: compensatory neuroplasticity that delays the manifestation of cognitive symptoms [9] and the use of test-taking strategies that allow them to maintain near-normal scores despite underlying pathology [1011]. In contrast, individuals with limited formal education show substantially higher false-positive rates, particularly on education-dependent items, such as literacy tasks and object naming, with error rates increasing by approximately 30% to 35% compared with education-neutral instruments [12-15]. As a result, the MMSE demonstrates reduced sensitivity (68%‐72%) and specificity (65%‐70%) when a conventional cutoff score of 24 points is applied across heterogeneous educational backgrounds [16-18]. Current clinical guidelines therefore emphasize the need to incorporate educational history into cognitive assessment to minimize diagnostic inaccuracies [1920].
Machine learning (ML) has emerged as a transformative approach in medical diagnostics, with particular relevance to cognitive assessment optimization. Support Vector Machines (SVMs) offer several advantages for psychometric refinement, including (1) robust performance in limited-sample settings (typically n<1000) [2122], (2) effective handling and interpretability of high-dimensional feature spaces [2324], and (3) strong compatibility with multimodal data integration frameworks that combine neuropsychological assessments with imaging- or biomarker-derived measures [25-28]. Earlier ML classifiers trained solely on MMSE total scores or subitems—most commonly logistic regression, SVM, or random forest—have demonstrated moderate diagnostic performance, with reported accuracies of 72% to 85% and area under the curve (AUC) values of 0.75 to 0.85 [29]. In contrast, multimodal models integrating magnetic resonance imaging (MRI) radiomics, positron emission tomography (PET) signatures, or speech biomarkers consistently achieve accuracies exceeding 90% to 95% [3031]. This performance gap highlights the need for methodological innovations that enhance unimodal MMSE-based classifiers while preserving their scalability and low implementation cost.
This study introduces an education-sensitive adaptation of the MMSE based on an SVM-guided dynamic weighting framework. We analyzed cognitive screening data (n=812) collected from Chinese tertiary hospitals and community health centers and stratified participants into four educational cohorts: illiterate (0 y), primary (≤6 y), secondary (7‐12 y), and tertiary (≥13 y). The model uses systematic item-response analysis combined with SVM-guided weighting to adjust the relative contribution of each MMSE subitem in an education-specific manner.
This work provides 2 methodological innovations. First, it moves beyond conventional linear education corrections by using nonlinear SVM modeling to identify “cognitive interference” patterns unique to each education level. Second, it introduces a dynamic weighting strategy specifically designed to mitigate the disproportionate false-positive burden experienced by low-literacy populations. Together, these innovations aim to deliver a more equitable and clinically practical adaptation of the MMSE, particularly relevant for resource-limited settings.
Although unimodal or condensed classifiers derived solely from MMSE subitems are highly accessible, they are inherently constrained by limited feature richness and therefore tend to exhibit moderate predictive performance. In contrast, multimodal diagnostic systems—such as those leveraging MRI, PET, radiomics, or speech biomarkers—achieve substantially higher accuracies but remain impractical for widespread screening due to cost, technical requirements, and limited availability in primary care. Thus, methodological advances that enhance the diagnostic utility of unimodal MMSE-based approaches, while maintaining their affordability and scalability, are urgently needed. This study addresses this gap by proposing an education-stratified dynamic weighting method designed to improve predictive performance within the intrinsic limitations of unimodal cognitive classifiers.
Methods
Ethical Considerations
This study followed the principles of the Declaration of Helsinki and was approved by the Ethics Committee of the First Affiliated Hospital of the University of Science and Technology of China (approval number 2024-RE-431). All clinical and community datasets were obtained with authorization from the original data custodians. During data processing, only anonymized records were used, and no personally identifiable information (eg, names, addresses) was accessed, ensuring compliance with the Declaration of Helsinki.
Sample
Cognitive assessment data were obtained from two sources: the Rehabilitation Medicine Department of a tertiary hospital and a community-based cognitive screening program. A total of 812 valid records were included. Among these, 404 samples were collected from outpatients and inpatients with clinically diagnosed cognitive impairment. The inclusion and exclusion criteria are summarized in Table 1.
Scale Selection and Scoring Criteria
The MMSE was used as the primary cognitive assessment tool. The scale comprises five cognitive domains: orientation, memory, attention and calculation, language, and visuospatial construction. Education-adjusted cutoff scores were based on Chinese normative standards [3]: illiterate group: ≤17, primary school group: ≤20, secondary school group: ≤22, and university group: ≤23.
Data Processing and Grouping
Overview
A total of 1000 assessments were collected initially. After quality control, 188 (18.8%) records were excluded due to missing data (n=107, 10.7%), nonstandardized test administration (n=35, 3.5%), or unqualified assessors (n=46, 4.6%). Before merging the hospital and community datasets, baseline demographic comparability was examined using an independent-samples t test (age) and chi-square test (gender) to minimize potential selection bias.
The final dataset (N=812) was stratified by educational attainment as follows: illiterate (n=108, 13.3%), primary school (n=105, 12.9%), secondary school (n=364, 44.8%), and university (n=235, 28.9%). Within each group, patient and control counts were recorded as illiterate (patients: n=60, 7.4%; and controls: n=48, 5.9%), primary (patients: n=53, 6.5%; and controls: n=52, 6.4%), secondary (patients: n=185, 22.8%; and controls: n=179, 22.0%), and university (patients: n=106, 13.1%; and controls: n=129, 15.9%). This preprocessing ensured a standardized data foundation for subsequent ML procedures.
Model Selection
A SVM classifier with a Radial Basis Function kernel was selected due to its suitability for medium-sized datasets and its capacity to model nonlinear decision boundaries. A stratified 5-fold cross-validation scheme was used to maximize data utilization while preserving the original case-control ratio within each educational group.
Hyperparameter Optimization
Hyperparameters were optimized through a grid search embedded within the cross-validation framework. The search grid included penalty parameter C: {0.1, 1, 5, 10, 100} and kernel coefficient γ: {0.001, 0.01, 0.1, 1}.
For each parameter pair, the model was trained on 4 folds and evaluated on the remaining fold, and the average accuracy across all 5 folds was used to identify the optimal configuration. Education-specific models were then retrained on the full dataset using the selected hyperparameters to ensure maximal predictive performance while avoiding information leakage.
Experimental Design
The overall experimental workflow is presented in Figure 1.
Contribution of individual Mini-Mental State Examination (MMSE)j items across educational strata. Feature importance was quantified using the percentage change in cross-validated accuracy (Δi) after deleting each subitem. We operationally defined critical factors as items whose removal caused a performance decrease of Δ<−1.0 and interference factors as items whose removal increased accuracy by Δ>+0.5. SVM: support vector machine.
The process began with data fusion and initial grouping: clinical and community data were merged to construct the initial dataset (n=812), and participants were stratified into 4 educational groups (ie, illiterate, primary school, secondary school, and university) to ensure subsequent analyses reflected education-specific cognitive characteristics. Next, a Support Vector Machine classifier with a radial basis function kernel was trained using a stratified 5-fold cross-validation scheme, preserving the original case-control ratio within each group. To quantify the contribution of each MMSE subitem, a systematic ablation procedure was performed. For each educational group, each subitem was removed in turn, and an SVM model was retrained. The feature contribution was quantified using the cross-validated change in prediction accuracy (Δ), calculated as:
A negative Δ indicates a positive contribution (performance dropped when the item was removed), while a positive Δ suggests the item acted as noise. Finally, based on the subitem contribution profiles, an education-specific dynamic weighting scheme was constructed to adjust the relative importance of MMSE subitems before classification.
Other Statistical Techniques
Routine statistical analyses were performed using SPSS version 24.0 (IBM Corp), and ML model construction and evaluation were conducted using Python (version 3.10.10; Python Software Foundation)
For categorical variables, chi-square or Fisher exact tests were applied depending on expected frequencies. Continuous variables with a normal distribution were expressed as mean (SD) and compared using independent-samples t tests. Variables not following a normal distribution were summarized using median (IQR) and analyzed using nonparametric tests.
A 2-tailed P<.05 was considered statistically significant.
Results
Demographic Comparison
Following data cleansing, demographic characteristics of the clinical and community datasets were compared to verify baseline homogeneity before integration. As presented in Table 2, differences in age and gender distributions were not statistically significant (P>.05).
Item-Wise Contribution Analysis
To assess the contribution of individual MMSE items across educational groups, we conducted an item deletion experiment. The change in cross-validated accuracy (Δi) after removing each subitem was used to quantify its importance. A negative Δi (< -1.0) indicated a critical item whose removal impaired performance, while a positive Δi (> +0.5) indicated an interference item whose removal improved accuracy. The results of this analysis are visualized in Figure 2.
Heatmap visualization of feature contribution analysis. The color spectrum reflects prediction accuracy after item deletion. Cooler colors (blue and green) denote "critical features" (accuracy drop), while warmer colors (yellow and red) denote "neutral/interfering features" (accuracy stable/increase). The y-axis represents educational groups with the following sample sizes (N_patient/N_control): illiterate (60/48), primary school (53/52), secondary school (185/179), and university (106/129). DM: delayed memory; EA: execution ability; IM: immediate memory; PP: penmanship and praxis; SS: spatial structure.
Illiterate Group
In the illiterate cohort (baseline accuracy=78.83%), all subitems demonstrated positive contributions. The most influential items were spatial orientation (Δ=−6.58% postremoval), immediate memory (Δ=−3.85%), and writing (Δ=−2.86%). No interference items were identified.
Primary School Group
In the primary school group (baseline accuracy=85.71%), spatial construction functioned as an interference factor (Δ =+0.95%), while calculation showed a negligible effect (Δ=0). Removal of immediate memory, delayed recall, reading, or writing reduced accuracy to 83.81% (Δ=−1.90%).
Secondary School Group
In the secondary school group (baseline accuracy=69.78%), multiple interference factors were observed: spatial orientation (Δ=+3.57%), delayed recall (Δ=+3.02%), executive function (Δ=+2.19%), reading (Δ=+1.64%), immediate memory (Δ=+2.47%), writing (Δ=+0.20%), and spatial construction (Δ=+1.10%). Only temporal orientation (Δ=−0.83%) and calculation ability (Δ=−0.80%) demonstrated positive contributions.
University Group
In the university group (baseline accuracy=71.49%), five interference items were identified: spatial orientation (Δ=+2.98%), calculation (Δ=+2.98%), immediate memory (Δ=+1.70%), naming (Δ=+1.70%), and delayed recall (Δ=+1.42%). Repetition (Δ=−0.57%) and reading (Δ=−0.30%) showed small positive contributions.
Item Weight Analysis
On the basis of these contribution patterns, education-specific weighted coefficients were calculated for all MMSE subitems. The weighted diagnostic score was defined as follows:
where S is the final weighted diagnostic score, v_i_ is the raw score of the i-th MMSE subitem, and w_i_ is the dynamic weighting coefficient assigned to the i-th subitem.
Classification was determined by comparing S to a group-specific classification threshold (T): S<T indicated cognitive impairment, and S≥T indicated normal cognition.
After normalization, the maximum possible weighted score was 60. Education-specific diagnostic thresholds were defined as follows: illiterate (t=30), primary (t=31), secondary (t=32), and university (t=33). As presented in Tables34, accuracy improved across all educational strata after weight calibration.
Table 5 summarizes the diagnostic performance before and after dynamic weighting, including accuracy, sensitivity, specificity, AUC, and the statistical significance of performance changes. The largest improvement occurred in the illiterate group (Δ=+7.25%), whereas the secondary school group showed the smallest improvement (Δ=+0.05%).
Weight distributions differed across education levels. For basic cognitive domains, spatial orientation weights were uniformly set to 3 across all groups, and immediate memory weights remained at 2. In the illiterate group, naming, repetition, and spatial construction received the highest weights (all=3). In the primary school group, temporal orientation was weighted at 2 and spatial construction was weighted at 1. In the secondary school group, executive function and calculation were weighted at 2, while spatial construction remained at 1. In the university group, executive function received the highest weight (3), calculation was weighted at 2, and spatial construction, reading, and writing each received a weight of 1.
Discussion
Principal Findings
This study developed an education-sensitive optimization framework for the MMSE using a dynamic SVM-based weighting strategy. Across 812 education-stratified participants, the model demonstrated that cognitive subitems contribute differently to diagnostic prediction depending on years of formal education. Dynamic weighting enhanced the performance of unimodal MMSE classifiers, particularly in low-literacy groups, and reduced education-related diagnostic bias. These findings refine the diagnostic utility of condensed cognitive screening tools and support their broader applicability in resource-limited settings.
Comparison With Prior Work
ML has been widely applied to cognitive assessment [32-35], yet existing studies typically use MMSE scores as features or labels without addressing education-driven measurement bias [3637]. Prior condensed MMSE-only classifiers generally achieve accuracies of 72% to 85%, whereas multimodal MRI-, PET-, and biomarker-based models often exceed 90% [3233]. Although our model remains unimodal, the dynamic weighting mechanism improved prediction by amplifying high-value signals and attenuating education-dependent interference, partially narrowing the performance gap with multimodal systems while sustaining low cost and operational simplicity.
Traditional MMSE optimization approaches—such as linear education corrections or standard ML models—lack the capacity to capture nonlinear, education-specific feature interactions [38]. In contrast, our framework integrates item deletion experiments with SVM-informed dynamic weighting to generate transparent, subgroup-adaptive coefficients. This approach offers an interpretable alternative to black box ensemble models and provides an effective mechanism for addressing item-level educational bias in cognitive assessment. A comprehensive comparison between the proposed dynamic weighted SVM model and existing cognitive assessment optimization strategies is presented in Table 6.
Interpretation of Education-Specific Patterns
Education-stratified analyses revealed distinct, cognitive reliance patterns. The illiterate group depended heavily on orientation and immediate memory, consistent with basic functional domains commonly preserved in low-literacy populations. The primary school group demonstrated changes in weighting for temporal orientation, whereas secondary school participants exhibited varied interference across multiple domains and minimal model improvement (Δ=0.05), suggesting high within-group heterogeneity. University-educated participants showed stronger reliance on executive functioning and calculation. These patterns align with prior evidence that cognitive performance becomes increasingly distributed and strategy dependent with higher educational attainment [3940].
The dynamic weighting strategy provided incremental accuracy improvements across all educational cohorts while reducing false-positive rates in lower-education groups. Subitem deletion further allowed visualization of feature importance (Figure 2), conceptually analogous to Shapley Additive Explanations–based explainability, thereby enhancing the transparency of SVM decision processes. Clinical validation by senior rehabilitation physicians confirmed that weight distributions reflected plausible neurocognitive patterns.
External validation using an independent community dataset (n=314) demonstrated stable performance (overall accuracy: 82.48% and AUC: 0.88), with the highest accuracy observed in the illiterate group (88.89%). These results support the generalizability and robustness of the proposed dynamic weighting model and mitigate concerns about overfitting.
Limitations
This study has several limitations. First, the sample was derived from a single geographic region, leading to educational imbalance across subgroups and potentially limiting generalizability. Broader multicenter sampling is needed. Second, demographic confounders beyond age and gender—such as socioeconomic status, occupational complexity, and urban-rural residence—were not available in the dataset, restricting the ability to fully disentangle education effects from related social determinants. Third, although the MMSE provides valuable screening utility, ceiling effects in highly educated individuals limit sensitivity to early cognitive decline. Integrating additional modalities, such as the Montreal Cognitive Assessment or imaging markers, may complement the proposed model. Finally, the SVM model relied on grid-search hyperparameter tuning; future research may explore AutoML-based optimization to improve efficiency and predictive performance.
Conclusions
This study proposes a dynamic SVM-based weighting framework that enhances the diagnostic fairness of MMSE-based cognitive screening across diverse educational backgrounds. By quantifying item-level contributions and adapting subitem weights for each education group, the method addresses a longstanding source of measurement bias in cognitive assessment. The approach retains the accessibility and scalability of condensed cognitive screening tools while improving prediction accuracy and interpretability. These findings provide a practical foundation for developing equitable cognitive assessment strategies, particularly in resource-limited regions.
The reference list from the paper itself. Each links out to its DOI / PubMed record.
- 1Chun CT Seward K Patterson A Melton A Mac Donald-Wicks L Evaluation of available cognitive tools used to measure mild cognitive decline: a scoping review Nutrients Nov 8202113113974 doi 10.3390/nu 13113974 Medline 34836228 PMC 8623828 · doi ↗ · pubmed ↗
- 2Folstein MF Folstein SE Mc Hugh PR “Mini-mental state”. A practical method for grading the cognitive state of patients for the clinician J Psychiatr Res Nov 1975123189198 doi 10.1016/0022-3956(75)90026-6Medline 1202204 · doi ↗ · pubmed ↗
- 3Jia X Wang Z Huang F et al A comparison of the Mini‑Mental State Examination (MMSE) with the Montreal Cognitive Assessment (Mo CA) for mild cognitive impairment screening in Chinese middle‑aged and older population: a cross‑sectional study BMC Psychiatry Oct 42021211485 doi 10.1186/s 12888-021-03495-6Medline 34607584 PMC 8489046 · doi ↗ · pubmed ↗
- 4Patnode CD Perdue LA Rossom RC et al Screening for cognitive impairment in older adults: updated evidence report and systematic review for the US Preventive Services Task Force JAMA Feb 2520203238764785 doi 10.1001/jama.2019.22258 Medline 32096857 PMC 13174748 · doi ↗ · pubmed ↗
- 5Scheltens P De Strooper B Kivipelto M et al Alzheimer’s disease Lancet Apr 2420213971028415771590 doi 10.1016/S 0140-6736(20)32205-4Medline 33667416 PMC 8354300 · doi ↗ · pubmed ↗
- 6Yin TT Cao MH Yu JC et al T 1‑weighted imaging‑based hippocampal radiomics in the diagnosis of Alzheimer’s disease Acad Radiol Dec 2024311251835192 doi 10.1016/j.acra.2024.06.012Medline 38902110 · doi ↗ · pubmed ↗
- 7Cardoso S Barros R Marôco J de Mendonça A Guerreiro M Different MMSE domains are associated to cognitive decline and education Appl Neuropsychol Adult 2024314533539 doi 10.1080/23279095.2022.2041018 Medline 35234096 · doi ↗ · pubmed ↗
- 8Bird HR Canino G Stipec MR Shrout P Use of the Mini‑Mental State Examination in a probability sample of a Hispanic population J Nerv Ment Dis Dec 198717512731737 doi 10.1097/00005053-198712000-00005 Medline 3500273 · doi ↗ · pubmed ↗