Spinal Cord Stimulation Improves Deceleration Phase Control during Targeted Reaching Post-Stroke
Omar Refy, Luigi Borda, Jacob Hsu, Erick Carranza, Nikhil Verma, Roberto de Freitas, Erynn Sorensen, Amy Boos, Marc Powell, Lee Fisher, Peter Gerszten, Elvira Pirodini, John W. Krakauer, George F. Wittenberg, Hartmut Geyer, Marco Capogrosso, Douglas J. Weber

TL;DR
Spinal cord stimulation helps stroke patients control arm movements better, especially during the deceleration phase when reaching for a target.
Contribution
A PD control model is used to show that SCS normalizes velocity-dependent control during reaching in stroke patients.
Findings
SCS partially normalizes altered balance of position and velocity-dependent torques in stroke participants.
Velocity-dependent terms showed the most consistent changes with SCS.
Model parameters may serve as biomarkers for optimizing SCS stimulation frequency.
Abstract
Cervical spinal cord stimulation (SCS) improves upper-limb function in individuals with chronic post-stroke hemiparesis, yet how it shapes motor control of arm movement remains unclear. During goal-directed reaching in healthy individuals, movements consist of a coordinated acceleration phase toward the target followed by a deceleration phase that stabilizes the limb near the endpoint. Disruptions in neuromotor control post-stroke can be partially restored by SCS, with prominent improvements occurring in the deceleration phase. To quantitatively characterize these effects, we used a proportional–derivative (PD) control model to fit planar reaching data from 12 healthy and 5 stroke participants. Movements were well described by the model, with proportional gain terms capturing the acceleration phase and derivative gain terms capturing velocity-dependent deceleration. In healthy…
Genes, proteins, chemicals, diseases, species, mutations and cell lines named across the full text — each resolved to its canonical identifier and authoritative record.
Click any figure to enlarge with its caption.
 Extended Data Figure 1
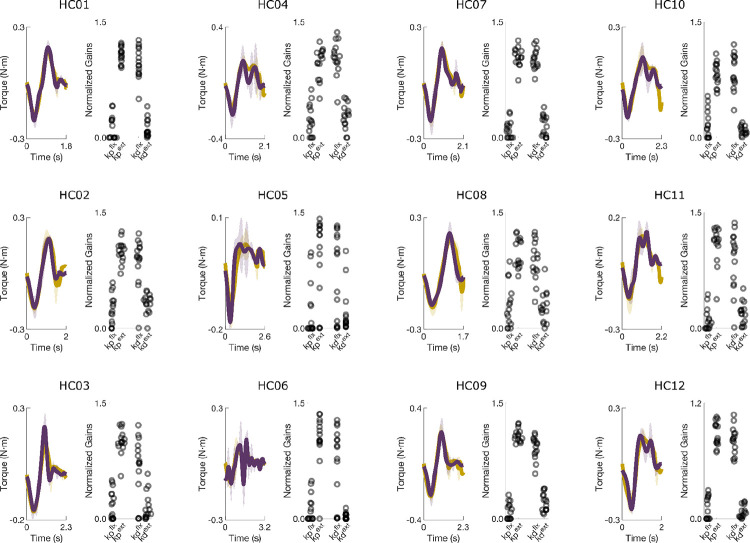 Extended Data Figure 2
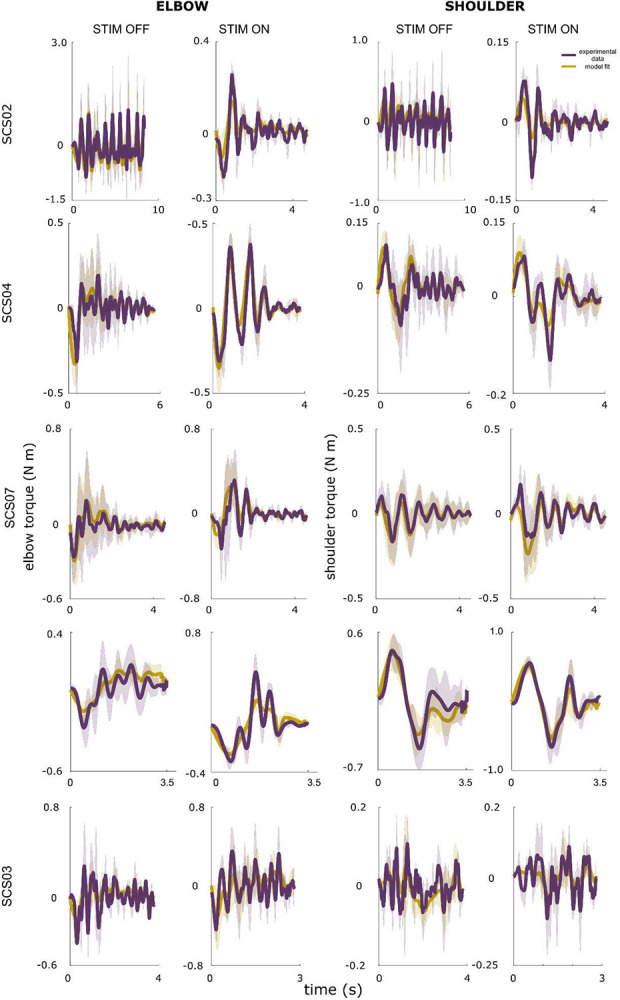 Extended Data Figure 3
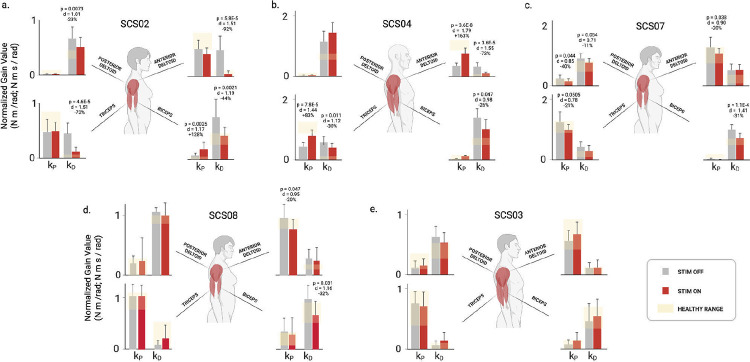 Extended Data Figure 4
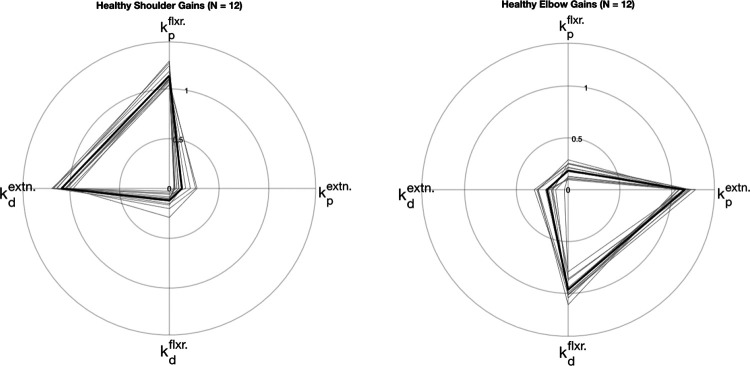 Extended Data Figure 5
| Symbol | Value | Description |
|---|---|---|
| α | 10–6 | Coefficient of hand jerk in the objective function |
| β | 10 | Coefficient of deviation from target term in the objective function |
| LUA | 0.35 m | Length of upper arm segment |
| LLA | 0.35 m | Length of lower arm segment |
| mUA | 2.8 kg | Mass of upper arm segment |
| mLA | 2.1 kg | Mass of lower arm segment |
| c | 1.5 N*m/(rad/s) | Joint damping coefficient |
| Subject | Baseline FM-UEA [0–66] | Baseline Success Rate (%) | Path Efficiency | Reach Time | Elbow Velocity Peaks |
|---|---|---|---|---|---|
|
| 15 | 20 (80) | 160.00% | 56.3% | 140.00% |
|
| 28 | 0 (100) | 1.25% (n.s.) | 6.6% (n.s.) | 6.98% (n.s.) |
|
| 23 | 5 (83) | 25.93% | 29.4% (n.s.) | 75.00% |
|
| 34 | 0 (100) | 4.48% (n.s.) | 23.6% | 11.54% (n.s.) |
|
| 32 | 0 (100) | −0.69% (n.s.) | 9.4% (n.s.) | 9.4% (n.s.) |
| Participant | Condition | Number of Trials | Reach Time (s) | Path Efficiency | # Elbow Velocity Peaks | Success Rate (%) |
|---|---|---|---|---|---|---|
| HC01 | Healthy | 3 | 1.86 (0.22) | 0.99 (0.01) | 1.7 (0.6) | 100 |
| HC02 | Healthy | 3 | 1.85 (0.20) | 0.93 (0.01) | 2.3 (0.6) | 100 |
| HC03 | Healthy | 3 | 2.10 (0.37) | 0.95 (0.03) | 1.7 (0.6) | 100 |
| HC04 | Healthy | 3 | 2.08 (0.16) | 0.96 (0.00) | 3.3 (0.6) | 100 |
| HC05 | Healthy | 3 | 2.44 (0.28) | 0.98 (0.01) | 3.0 (1.0) | 100 |
| HC06 | Healthy | 3 | 2.95 (0.34) | 0.98 (0.01) | 5.3 (2.1) | 100 |
| HC07 | Healthy | 3 | 2.05 (0.20) | 0.97 (0.01) | 2.0 (1.0) | 100 |
| HC08 | Healthy | 3 | 1.76 (0.07) | 0.92 (0.01) | 2.0 (0.0) | 100 |
| HC09 | Healthy | 3 | 2.10 (0.42) | 0.96 (0.02) | 3.0 (1.0) | 100 |
| HC10 | Healthy | 3 | 2.15 (0.23) | 0.97 (0.01) | 1.7 (0.6) | 100 |
| HC11 | Healthy | 3 | 2.00 (0.07) | 0.97 (0.02) | 2.3 (0.6) | 100 |
| HC12 | Healthy | 3 | 2.32 (0.08) | 0.96 (0.01) | 2.3 (0.6) | 100 |
| SCS02 | STIM OFF | 30 | 7.05 (4.70) | 0.20 (0.21) | 11.6 (10.7) | 80 |
| SCS02 | STIM ON | 30 | 4.51 (4.42) | 0.52 (0.23) | 5.1 (7.9) | 100 |
| SCS03 | STIM OFF | 30 | 3.22 (1.10) | 0.80 (0.09) | 4.6 (2.7) | 100 |
| SCS03 | STIM ON | 30 | 3.02 (1.20) | 0.81 (0.09) | 4.3 (2.8) | 100 |
| SCS03 | Non-paretic limb | 14 | 1.46 (0.44) | 0.90 (0.05) | 3.3 (1.7) | 100 |
| SCS04 | STIM OFF | 24 | 4.17 (2.00) | 0.54 (0.19) | 6.5 (3.7) | 83 |
| SCS04 | STIM ON | 18 | 3.23 (2.00) | 0.68 (0.12) | 3.7 (1.3) | 88 |
| SCS04 | Non-paretic limb | 15 | 1.42 (0.42) | 0.91 (0.05) | 5.2 (1.2) | 100 |
| SCS07 | STIM OFF | 60 | 2.04 (0.84) | 0.65 (0.10) | 2.9 (1.6) | 100 |
| SCS07 | STIM ON | 45 | 1.65 (0.64) | 0.68 (0.14) | 2.6 (1.6) | 100 |
| SCS07 | Non-paretic limb | 15 | 1.20 (0.37) | 0.90 (0.07) | 2.4 (1.4) | 100 |
| SCS08 | STIM OFF | 30 | 2.26 (1.22) | 0.74 (0.10) | 5.2 (3.3) | 100 |
| SCS08 | STIM ON | 18 | 2.04 (0.78) | 0.74 (0.14) | 4.8 (2.4) | 100 |
| SCS08 | Non-paretic limb | 90 | 1.03 (0.31) | 0.95 (0.03) | 1.6 (0.5) | 100 |
| Participant ID | Shoulder NRMSE (%) | Shoulder SNE (%) | Elbow NRMSE (%) | Elbow SNE (%) | Number of Trials |
|---|---|---|---|---|---|
| HC01 | 6.9 | −0.7 | 7.3 | 0.7 | 3 |
| HC02 | 7.4 | −2.6 | 10.4 | 0.6 | 3 |
| HC03 | 8.9 | −5.1 | 12.0 | −1.4 | 3 |
| HC04 | 11.5 | −3.2 | 13.1 | 4.2 | 3 |
| HC05 | 12.3 | −2.3 | 15.0 | −0.7 | 3 |
| HC06 | 10.8 | −2.4 | 19.5 | 1.3 | 3 |
| HC07 | 8.1 | −3.8 | 8.8 | 1.8 | 3 |
| HC08 | 8.3 | −4.0 | 12.5 | 1.3 | 3 |
| HC09 | 7.1 | −1.7 | 10.6 | −1.9 | 3 |
| HC10 | 11.5 | −4.8 | 11.3 | 5.5 | 3 |
| HC11 | 10.4 | −3.6 | 12.1 | −1.8 | 3 |
| HC12 | 11.5 | −2.0 | 10.6 | 3.4 | 3 |
| SCS07 – STIM OFF | 10.6 | 2.8 | 20.9 | −7.2 | 10 |
| SCS07 – STIM ON | 15.1 | −1.4 | 22.4 | −4.7 | 10 |
| SCS04 – STIM OFF | 19.8 | 3.9 | 25.7 | −4.7 | 3 |
| SCS04 – STIM ON | 20.3 | −4.7 | 24.3 | −6.2 | 3 |
| SCS03 – STIM OFF | 20.2 | −0.8 | 22.9 | −2.5 | 5 |
| SCS03 – STIM ON | 15.2 | 1.6 | 23.8 | −0.8 | 5 |
| SCS02 – STIM OFF | 20.0 | 4.6 | 18.3 | −4.3 | 3 |
| SCS02 – STIM ON | 16.7 | 3.6 | 19.1 | −6.8 | 3 |
| SCS08 – STIM OFF | 14.2 | −3.5 | 16.4 | 5.0 | 5 |
| SCS08 – STIM ON | 8.6 | 0.9 | 13.1 | 0.9 | 3 |
Peer Reviews
No public reviews on file for this paper yet. If you reviewed it on a platform where reviews are public (OpenReview, ICLR, NeurIPS, ICML), you can paste yours below so the community can read it here.
Videos
No videos yet. Explain this paper in a talk, walkthrough, or lecture? Add one.
Taxonomy
TopicsSpinal Cord Injury Research · Pain Management and Treatment · Stroke Rehabilitation and Recovery
Introduction
Stroke is among the leading causes of disability worldwide^1^. As of 2019, stroke has a global prevalence of over 100 million people and has created a formidable health and economic burden, estimated at $2 trillion annually (~1.7% of global GDP)^2,3^. In addition to the immense magnitude of this global problem, approximately 50% of stroke survivors experience permanent deficits in arm and hand function due to disruption of motor control circuits in the brain^4^.
Recent studies demonstrate that neuromodulation of sensorimotor pathways in the spinal cord and brain may be effective for promoting recovery of motor function in individuals with chronic hemiparesis, even several years after stroke^5–7^. By directly targeting neural circuits in the central nervous system (CNS), neuromodulation alters the dynamics of the neural circuits underlying the feedback control of movement. Thus, CNS neuromodulation directly promotes changes in the motor output of the CNS, which differs from traditional approaches that compensate for muscle weakness using robotic exoskeletons or functional electrical stimulation (FES) to assist movement (Fig. 1c). However, the direct effects of CNS neuromodulation in altering the dynamics of CNS motor control have yet to be examined.
Neuromotor control is achieved through a distributed network of feedforward and feedback circuits that span the brain and the spinal cord (Fig. 1a). Feedback control is a dominant mode of control for all types of motor behaviors, and there is strong evidence supporting a theory that feedback gains are optimized to generate movements that are smooth, energetically efficient, and stable in the presence of disturbances^8–10^. Moreover, stroke is known to disrupt feedback control circuits, such as the stretch reflex, leading to excessive co-contraction of antagonistic muscles during reaching^11,12^. Indeed, Borda et al.^13^ demonstrated recently that tonic SCS targeting elbow extensor muscles produced concurrent inhibition of reflex gains and motor unit activity in the elbow flexors. These changes were associated with improvements in reaching kinematics.
To understand the effects of SCS on the control of agonist-anatagonist muscle interactions during reaching, we created a computational model to simulate the mechanics and feedback control of joint torques at the shoulder and elbow. The arm was modeled as a two-link chain with pairs of uniarticular flexor and extensor muscles at the shoulder and elbow (see Fig. 1d). The activation of each muscle was modeled as an independent proportional-derivative (PD) controller with gain parameters (proportional gain: , derivative gain: ) that were tuned to match the kinematics and torque profiles of human subjects performing planar, point-to-point reaching movements. Reaching data was collected from neurotypical (n=12) and hemiparetic participants (n=5) performing targeted reaching movements in a robotic exoskeleton (KINARM, Kingston, Ontario, Canada).
We found that the feedback gain parameters for neurotypical participants (n=12) were similar and matched those obtained by optimizing feedback gains to maximize trajectory smoothness in a dynamic simulation. The gain parameters differed significantly for reaching movements performed by people with stroke, with the largest differences appearing as increased derivative gains for the antagonistic muscles, which produce velocity-dependent torque that decelerates the joint during the terminal phase of reaching^14^. However, when SCS was applied, the controller gains changed to approximate those found for the healthy participants and optimal control simulations. The main effect of SCS was a strong and consistent reduction in the derivative gains across the arm joints, indicating improved control of velocity-dependent torque production at the terminal phase of the movement^15^. Lastly, we found that the effects of SCS on controller gains varied with the SCS pulse-frequency, providing a mapping function that can be used to select SCS parameters that optimize the feedback control behavior of the CNS.
The experimental data and modeling results presented here imply that, rather than boosting motor drive at early phases of movement, SCS primarily enhances control of the deceleration and stabilization phase. In other words, the SCS-mediated improvements in reaching performance observed in this planar reaching task were due to a reduction in motor drive during the terminal phase of the movement, rather than an increase in motor drive during the acceleration phase. While these results do not diminish the importance of the SCS-mediated enhancements in agonist muscle activation, they reveal that SCS primarily enhances the neural controller performance, especially at the late phases of the movement. The model presented here provides a means to quantify changes in the arm control structure induced by SCS post-stroke, and can be used generally to understand the effect of neuromodulation therapies on different neurological diseases.
Results
We start by quantifying the effects of SCS on reaching performance in five stroke survivors. We then present a PD controller model and show that it can simulate reaching behavior of both neurotypical and paretic arms. We show that in neurotypical participants, the PD controller gains exhibit a stereotypical structure, and that the controller gains for the paretic arm deviate from that pattern in a subject-specific fashion. Under SCS, the feedback controller gains are changed to become closer to neurotypical ranges in a stimulation-parameter dependent manner. Finally, we use optimal feedback control simulations to show that controller gains that are optimized to produce smooth point-to-point reaching movements match those found for neurotypical participants, suggesting that SCS tunes neural feedback controller gains towards optimal values.
SCS Improves Planar Reaching of the Paretic Arm
We quantified the effects of cervical SCS on planar reaching in five individuals with chronic post-stroke hemiparesis. Participants performed a center-out planar reaching task under stimulation-off (STIM OFF) and stimulation-on (STIM ON) conditions. Performance was assessed using success rate, reach time, path efficiency, and smoothness quantified by the number of elbow-velocity peaks (Fig. 2; see Methods).
Across participants, SCS improved reaching kinematics, particularly in those with greater baseline impairment (Extended Data Table 1). The most impaired participant (SCS02) showed significant gains (p < 0.05) in all performance metrics. SCS04 exhibited significant improvements in path efficiency and smoothness, whereas SCS07 showed shorter reach times (p < 0.001). SCS03, who had mild impairment, showed no significant changes. Group-level averages (Fig. 2b–e) demonstrate consistent enhancements in success rate and path efficiency, reduced reach time, and fewer velocity peaks under SCS. These findings indicate that cervical SCS enhances movement fluency and stability during reaching, with effects that scale with baseline motor impairment.
Feedback Control Model Reproduces Healthy and Paretic Reaching Behavior
To examine how SCS alters feedback control, we developed a proportional–derivative (PD) controller model that simulated joint torque control at the shoulder and elbow (Fig. 3; see Methods). The arm was modeled as a two-link chain, with flexor and extensor muscle controllers acting independently at each joint. Joint position and velocity feedback were delayed by 30 ms to represent afferent conduction, and controller outputs were delayed by 30 ms to simulate efferent transmission latencies. Muscle torque generation was modeled as a first-order process with a 50 ms time constant. Controller gains were tuned using Gaussian-process Bayesian optimization to minimize the error between simulated and experimental torques for individual trials.
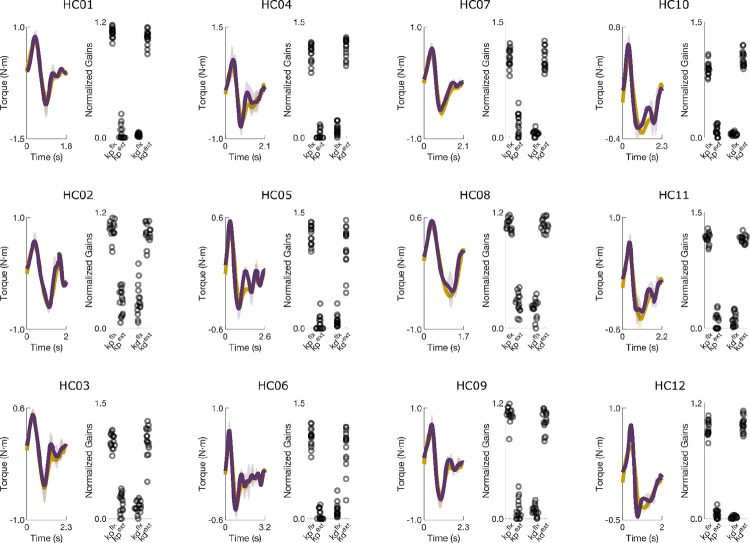
In healthy participants, the model reproduced measured joint torques with high accuracy (average NRMSE = 10.7 ± 2.8%, SNE = −1.0 ± 2.8%). Torque traces and fitted gains showed characteristic U-shaped and inverted-U gain structures for the elbow and shoulder, respectively (Fig. 3a,b).
For the stroke group (n = 5; SCS02, SCS03, SCS04, SCS07, SCS08), the model also captured behavior across STIM OFF and STIM ON conditions with comparable accuracy (NRMSE = 18.9 ± 4.3% and 17.9 ± 5.1%; SNE = −0.7 ± 4.4% and −1.8 ± 3.6%, respectively; p > 0.3 for all comparisons). NRMSE was significantly lower for healthy participants (p < 0.001), reflecting greater trial-to-trial variability after stroke. Overall, the PD controller reproduced torque profiles with ≈ 86% accuracy across all participants and conditions, validating it as an effective model of feedback control of muscle activation in this point-to-point planar reaching task.
PD controller gains
We next examined how feedback controller gains contribute to joint torque production during reaching. During extension movements, the proportional gain for the agonist ( ) and the derivative gain for the antagonist ( ) regulate the joint torques that accelerate and decelerate the joint, respectively during the initial and terminal phases of the reach (Fig. 4a; Supplementary Video 1). The remaining gains ( ) contribute only small torques to stabilize the joint near the target. The fitted gains for the elbow muscles (Fig. 4b) form a consistent inverted-U pattern across all healthy control participants, reflecting the balance between movement initiation (“ballistic gains”) and termination (“stabilization gains”).
In stroke participants, this gain structure was disrupted. For example, in SCS02 under the STIM OFF condition, large alternating flexion and extension torques prevented successful reaching (Fig. 4c; Supplementary Video 2). The model revealed abnormally high derivative gains for both flexors and extensors, producing excessive velocity-dependent torques that obstructed movement (Fig. 4d). With SCS, reaching performance improved (Fig. 4e; Supplementary Video 3), and derivative gains decreased toward healthy ranges (Fig. 4f), reducing abnormal oscillatory torques. Across participants (n = 5), SCS consistently shifted gain structures toward neurotypical patterns. These results suggest that the effects of stroke on neuromotor control are dominated by elevated derivative gains, resulting in excessive velocity-dependent torques, and these effects are mitigated by SCS to restore a more typical feedback control regime.
Feedback Controller Gains Shift Toward Neurotypical Levels Under SCS
We next quantified how SCS affected the feedback controller gains obtained from model fits in each stroke participant (n = 5; Fig. 5). For brevity, we focus on the elbow joint during reaching to the central target; shoulder results are provided in the Supplementary Material. The bar plots show average values for the proportional and derivative gains for the flexor and extensor controllers under STIM OFF (grey) and STIM ON (red) conditions. The yellow shaded regions indicate the range of gain values found for each participant’s nonparetic limb performing the same reaching task.
The most impaired participant (SCS02), showed the strongest tuning effects as the flexor derivative gain decreased by 44% ( ) and extensor derivative gain decreased by 73% ( ), both shifting toward healthy ranges. Interestingly, the extensor proportional gain was unchanged by stimulation, indicating that SCS did not increase the elbow extension torque even though stimulation was targeting the triceps muscle. SCS04 also exhibited significant reductions in derivative gains (−26% and −30%, ). Unlike SCS02, these were accompanied by an 83% increase in the extensor proportional gain ( ), reflecting the direct effect of SCS targeting the triceps to boost voluntary recruitment. SCS07 showed a 31% reduction in flexor derivative gain ( ) and a 21% decrease in extensor proportional gain ( ). SCS08 exhibited a 32% reduction in the flexor derivative gain ( ), bringing it into the range observed for their nonparetic arm. SCS03 displayed no significant changes, likely because their baseline reaching performance and controller gains were already within range of their nonparetic limb.
Across participants, the most consistent effect of SCS was a reduction in excessive derivative gains ( ), reflecting normalization of the level of velocity-dependent torque produced to slow the joint during the terminal phase of the reaching movement. Surprisingly, we observed only one case where the proportional gain ( ) for the extensor muscle increased significantly. Indeed, SCS04 was the only participant that exhibited a low proportional gain in the extensor muscle at baseline, and SCS boosted the gain to a level just below the nonparetic range. This pattern of changes contradicts the idea that SCS enhances voluntary recruitment of targeted muscles, such as triceps in the present analysis. Instead, these results suggest the dominant effect of SCS, used here to target triceps, is actually more effective in suppressing velocity-dependent torques generated by the biceps.
Tuning of Model Gains Varies with Stimulation Frequency
When used clinically, SCS and nearly all other neuromodulation devices are tuned manually, often without a clear biomarker for measuring a therapeutic effect^16^. Since the patient’s response to neuromodulation depends critically on the choice of stimulation parameters, we used the feedback controller model to examine how the proportional and derivative gains change as stimulation frequency is adjusted to optimize reaching performance in two participants (Fig. 6). For SCS02, increasing SCS frequency from 0 Hz to 100 Hz progressively improved movement quality (Fig. 6a–e). Reach trajectories became straighter and smoother, exhibiting incremental improvements with each step in SCS frequency ( ). Fitted controller gains revealed that both flexor and extensor derivative gains declined with frequency, driving the overall gain structure toward the healthy pattern (Fig. 6b,e). These results demonstrate a stimulation-frequency dependent effect in reducing the flexor derivative gain at the elbow.
A different trend was observed with SCS04 (Fig. 6f–j). The best performance occurred with an SCS frequency of 40 Hz, where reaches were smoothest and closest to healthy behavior. Path efficiency decreased from 0.66 at 40 Hz to 0.55 ( ) and 0.39 ( ) at 60 Hz and 80 Hz, respectively, while the number of velocity peaks increased from 2.6 to 4.2 and 7.4 ( ). At 80 Hz, both metrics were worse than baseline (STIM OFF; ). Correspondingly, derivative gains diverged from healthy ranges as frequency increased (Fig. 6g,j).
Together, these results demonstrate that stimulation frequency strongly modulates reaching performance and the feedback controller model identified consistent reductions in the flexor derivative gain as a key contributor to the improvement in reaching behavior. While optimal tuning (e.g., 100 Hz for SCS02, 40 Hz for SCS04) enhances smooth, stable reaching, suboptimal frequencies can degrade performance, underscoring the need for individualized parameter optimization.
Optimal Feedback Control Model Explains Gain Tuning
Because healthy participants exhibited a stereotypical U-shaped gain structure, we hypothesized that these feedback gains are tuned to optimize movement smoothness during targeted reaching. To test this, we simulated a two-link arm controlled by unidirectional flexor and extensor torque generators at the shoulder and elbow (Fig. 7; see Methods). Bayesian optimization was used to identify the proportional and derivative gain values that maximized trajectory smoothness while reaching a target within a specified duration (2 s).
Optimization consistently yielded the same gain organization observed experimentally: a U-shaped pattern at the elbow and an inverted U-shape at the shoulder (Fig. 7a; Supplementary Video 4). The extensor proportional and flexor derivative gains dominated torque production at the elbow, while the flexor proportional and extensor derivative gains dominated at the shoulder, matching the empirical findings in healthy participants.
Simulations using these optimal gains produced straight hand paths, bell-shaped velocity profiles, and smooth joint trajectories (Fig. 7b–d). Increasing the elbow flexor derivative gain alone induced mild oscillations in hand velocity (Fig. 7e–g; Supplementary Video 5), whereas simultaneously increasing both flexor and extensor derivative gains produced large, alternating flexion–extension torques (Fig. 7h–j), resembling behaviors observed in stroke participants such as SCS02 and SCS04.
These results demonstrate that the stereotypical gain structure observed in healthy participants corresponds to an optimal feedback control policy for generating smooth, stable reaching. Deviations from this structure result in clear and characteristic motor deficits, reinforcing that post-stroke impairments—and their restoration by SCS—can be understood as shifts in the multidimensional space of feedback control gains.
Discussion
For decades, spinal cord stimulation (SCS) has been an established treatment for chronic pain. More recently, its potential to promote motor recovery after spinal cord injury^17–19^ and stroke^20^ has emerged as a major new application of neuromodulation. With ongoing efforts to translate SCS into neurorehabilitation practice, it is crucial to understand its mechanisms of action^21^, articulate its effect on motor control of voluntary movement, and develop principled approaches for programming stimulation parameters to maximize functional benefit.
When SCS is applied near the dorsal root entry zone, it primarily activates large-diameter afferent neurons, particularly Ia muscle afferents^22^. These afferents project directly and indirectly to spinal motor neurons, but also to many sensorimotor areas of the nervous system. At higher amplitudes, SCS can evoke trans-synaptic activation of motor neurons, evoking the posterior root muscle (PRM) reflex^23^. In neuromotor rehabilitation, however, SCS is applied below the motor threshold and delivered continuously at a fixed frequency, modulating excitability rather than directly eliciting contractions. Continuous activation of Ia afferents can thus increase motoneuron responsiveness to descending inputs^24,25^, potentially compensating for reduced corticospinal drive after stroke. In this context, SCS does not directly generate movement but modifies the input–output properties of the spinal (and CNS) circuitry, effectively tuning feedback gains within corticospinal control loops.
Here, we tested the hypothesis that SCS improves motor control by boosting motor drive during the acceleration (i.e. ballistic) phase of movement. We used a neuromechanical model to parse out position and velocity-dependent components of the torques generated at the shoulder and elbow during the acceleration and deceleration phases of reaching, respectively. In neurotypical (i.e. healthy) participants, we found that these component torques and associated controller gains exhibit stereotypical patterns (Figs. 3–4, Extended Data Figs. 1–2, 5) that are optimal for smooth, stable point-to-point reaching (Fig. 7). Stroke disrupted this gain structure (Figs. 4–5, Extended Data Figs. 3–4), but SCS partially restored it in a frequency-dependent manner (Fig. 6). We found that, rather than simply boosting agonist muscle drive, SCS suppresses velocity-dependent torques generated by antagonistic muscles during the deceleration phase of reaching. Thus, SCS enhances control of muscle activation more globally to achieve efficient regulation of joint torques throughout all phases of movement.
By decomposing joint torques into position- and velocity-dependent components, the model reveals how different feedback elements contribute to impaired movement and recovery. When SCS was active, the derivative gains, which generate velocity-dependent torques, decreased by 26–44% (Extended Data Fig. 3). The effect of SCS on proportional gains, while present in some participants, was far less consistent. However, the planar reaching task used here did not reveal clear deficits during the acceleration phase, which is when the position-dependent torques are dominant. Indeed, more challenging tasks, such as unsupported 3D reaching^5^, are more likely to reveal improvements in the proportional gains with SCS.
As shown in Fig. 6, optimal frequencies varied across participants and electrodes: in SCS02, higher frequencies (100 Hz) improved trajectory smoothness and gain normalization, whereas in SCS04, optimal performance occurred at lower frequencies (40 Hz). At suboptimal frequencies, performance deteriorated, emphasizing that SCS can both enhance or impair control depending on tuning. These results underscore the need for personalized optimization of stimulation parameters and suggest that models such as ours could help guide parameter selection by targeting specific gain profiles.
Like all models, ours has several limitations. It is important to note that our model attempts only to describe the behavior of the CNS in controlling joint torques during goal-directed reaching, and it is not intended to implicate specific neural circuits. The model captures only 86% of NRMSE variance, which leaves room for improvement, perhaps by including unmodeled factors such as changes in feedforward drive or multi-joint coordination deficits. Furthermore, the reaching behavior studied here is restricted to planar reaching without the influence of gravity.
Despite its simplicity, the model presented here provides an objective, quantitative method to assess changes in control at different phases of the movement induced by SCS. Through this approach, it becomes evident that healthy reaching is generated via optimal gain patterns that are optimal for smooth, stable movements, that stroke disrupts this pattern, and that SCS can partially restore it primarily by normalizing derivative gains that stabilize motion rather than by amplifying proportional gains that drive it. In other words, SCS enables the CNS to solve the control problem of reaching more efficiently. These findings bridge motor control theory and neurorehabilitation, offering a principled foundation for developing individualized, model-based interventions to restore movement after neurological injury.
Methods
Participants
This study was conducted as a substudy under the Spinal Cord Stimulation for Restoration of Arm and Hand Function in People With Subcortical Stroke (NCT04512690) trial aimed at evaluating the effects of spinal cord stimulation for restoring arm and hand function post-stroke. A total of seven participants completed the parent study, and five of the seven were selected for the experiments presented here. A group of 12 neurologically intact participants were tested (healthy controls, HC group). The five stroke participants (2M/3F) were 3–10 years post-stroke and whose impairment levels spanned a representative range of Fugl-Meyer scores. Participants were implanted with epidural spinal cord stimulation (SCS) electrodes for 29 days, which were removed following completion of the study. All experiments reported in this work were performed during the implant period. Participants in the stroke groups are referred to as SCSXX and are numbered based on their study enrollment order. Participant numbering is consistent with Powell et al.^20^ In addition, twelve healthy control participants (referred to as HCXX) with no underlying neurological disorders relevant to the upper extremity were recruited. Participant details are provided in Table 1. All experiments were approved by the University of Pittsburgh Institutional Review Board, and were conducted in accordance with the Declaration of Helsinki. All participants provided written informed consent.
Implant and Intraoperative Testing
Stroke participants were implanted with two linear, 8-channel SCS leads (referred to as rostral and caudal, or R and C throughout this study) that were inserted into the epidural space of the cervical spinal cord to target the dorsal root entry zone at the spinal segments innervating the upper limb. Implant procedure details are described in Powell et al.^20^
Recruitment curves were measured intraoperatively and on the first day of testing to measure muscle activation thresholds for each SCS electrode. Briefly, stimulation pulses were applied at a low repetition rate (0.5–2 Hz), and evoked responses were measured in major muscle groups of the arm while stimulation amplitude was increased incrementally. The peak-to-peak amplitude of the compound action potential evoked in each muscle was used to quantify the strength of recruitment for each of the SCS electrodes, which were distributed along the rostro-caudal axis.
The recruitment thresholds for each muscle were used to guide the selection of stimulation parameters for targeting specific muscles. During the reaching experiments studied here, stimulation was applied at a fixed amplitude and frequency on one or more SCS electrodes, with parameters adjusted manually to optimize task performance. The stimulation amplitude was set to a level below the motor threshold found during the recruitment curve measurements, and the stimulation frequency was set to a level between 40 and 100 Hz. The parameter configurations used in the experiments reported in this study are summarized in Table 2.
2D reaching tasks and data collection
During the 29 day implant period, the participants performed a variety of tasks such as 2D and 3D reaching tasks, and other functional assessments such as the Fugl-Meyer Upper Extremity Assessment (FM-UEA). Here, we focus only on the planar reaching task, which was performed using the Kinarm robotic exoskeleton (BKIN Technologies, Ltd., Kingston, Ontario, Canada) that supported the arm against gravity and measured kinematics at the shoulder and elbow at a 1000 Hz sampling rate. Joint torques were calculated using measured joint kinematics (see subsequent subsections for more details).
Participants were prompted to reach forward from a proximal starting position, near the chest, to targets positioned ~8–40 cm away. The target locations were tailored to each participantchest, t of motion and impairment level. The task was modified for participant SCS02, as they were unable to perform targeted reaching. Instead, SCS02 was instructed to reach from a point close to their chest and to the furthest of 3 lines that they could reach. This task was only used in the frequency optimization experiment for SCS02.
Biomechanical arm simulation and feedback controller design
The PD controller
We modeled the neural control of torque generation at each joint as a pair of proportional-derivative (PD) controllers that regulate activation of the flexor and extensor muscle groups. Angular displacement is positive in the extensor direction. The input to each PD controller is the error state vector, which represents the difference between the current and target angular position and velocity states. The target positions were set to the joint angles recorded when a target was reached, and the angular position error ( ) is the difference between the target joint angle ( ) and the actual angle ( ) at time . Since the target angular velocity is 0, the angular velocity error is simply the actual angular velocity ( ). The control policy for regulating activation of each muscle group is represented by the following equations:
Where is the muscle activation signal at time for the extensor ( ) or flexor ( ) muscle group at joint (shoulder or elbow). The proportional ( ) and derivative ( ) gain terms are tuned for each actuator. The saturation functions ensure that the flexor/extensor torques are nonzero only when the actuator is engaged to generate torque in its respective direction. For example, is 0 when is positive, and is 0 when is negative.
The muscle activation signal is converted into torque through a first order transfer function (see Figure 1e for a schematic), and the flexor and extensor torques are summed for each joint to produce the total joint torque.
Feedback Controller Optimization
The feedback controller gains were determined by Bayesian optimization with a Gaussian prior. Bayesian optimization entailed searching for the controller gains that produced torque profiles that are the closest to experimental values based on the joint angles and angular velocities measured during the experiments. Below we describe the gain search algorithm.
Gain Search Algorithm
Joint kinematics were measured using the Kinarm while participants performed planar reaching movements. Joint kinematics were used to estimate joint torques as described in a later subsection. The gain parameters for the PD controller model were fit using Bayesian Optimization to find a set of PD controller gains that minimized the error between the measured and simulated joint torques, as described in the following loss function:
where controls the the penalty for selecting larger gain values, T is the duration of the trial, and are the individual gain values, where denotes proportional/derivative flexor/extensor gains. The loss is dominated by the absolute error of the model relative to the experimental data normalized to the duration of the trial, with an additional component to penalize higher gains, ensuring that the model fits the data with the minimum value possible for each gain. The parameter was set to 0.001 for all model fittings reported in this paper. Gain values are initiated at random values (typically within a range of 0–10 N-m/rad and N-m-s/rad). Every new iteration, the gains were updated by adding a random number with standard deviation equal to 50% of the gain range (i.e. 5 in the case of [0, 10] range). Every time the model made an improvement, the gain search was narrowed by halving the gaussian noise. The optimization was stopped when a desired loss was met. This optimization loop was then repeated a predetermined number of times (5 unless otherwise stated) and the best gains were averaged over these iterations to account for the stochastic nature of the search. Desired loss was adjusted manually between targets and participants as to best fit each torque curve. The gain search was implemented as a custom-written script in Matlab, and is provided in the Source Code section.
Gain Normalization
To assess the individual torque contributions of different controller gains, we normalized the gains using the ratio of their time-integrated torque generated to the total torque produced. That is, the normalized gains, , are related to the unnormalized gains, , through the equation:
where is the respective joint (shoulder or elbow), denotes proportional and derivative gains for the flexor and extensor directions indicated by , is the component torque for each unidirectional actuator, denotes the total joint torque applied at time at joint , and is the duration of the reaching trial. Unlike , the normalized gain values, are more indicative of the relative contribution of each feedback gain to the total torque produced.
Experimental Torque Calculation
In the cases where torque was not recorded by the Kinarm system during the experiment, torque was instead calculated using the recorded joint angles, velocities and accelerations by using a two link manipulator as a model. By finding the theoretical kinetic energy ( ) at any given time step and assuming potential energy ( ) was negligible, we find that the lagrangian ( ) is simply the kinetic energy at any given time, and joint torques ( ) can be calculated through the Euler-Lagrange equation such that:
yielding:
where and denote the masses and lengths of each arm segment, respectively (1 referring to the upper arm, while 2 refers to the forearm), and denote the angle and angular velocity of an arm segment relative to the horizontal, and and denote and respectively. Segment masses and lengths were estimated based on^14^. For simplicity, each segment was treated as a thin rod with moment of inertia where and denote the segment mass and length, respectively. We did not include damping in the torque calculations for two reasons. First, reaching speeds were slow, making damping effects negligible. Second, a damping term would shift the absolute values of the derivative gain estimates but would not affect the difference in derivative gains between STIM OFF and STIM ON. Because these torque estimates were used solely to compare experimental control gains (and not to match the arm simulation torques), omitting damping is justified. Since minor changes in inertial properties will not affect the qualitative structure of the controller gains, we used the same inertial properties for all participants when torque was estimated (see table below for parameters).
Model Performance Assessment
The following metrics were used to assess the model’s fitted torque profiles in comparison to experimental values:
- Normalized RMSE (NRMSE): RMSE measures the quadratic residuals of the calculated (i.e. model) from the reference (i.e. experimental) signal . This metric is normalized to the peak-to-peak amplitude of to accommodate for the widely different ranges of torque profile amplitudes during reaching across participants, targets, and stimulation parameters. This metric was used to assess how the model deviated, on average, from the experimental values.
- Signed Normalized Error (SNE): We defined Signed Error as the average error between and across the duration of the trial, which was likewise normalized to the peak-to-peak amplitude of . This metric was used to assess how well the model’s predicted torque tracked the average experimental torque profiles.
Two-link biomechanical model
We built a two-link biomechanical model in Matlab Simulink (MathWorks) to simulate reaching behavior under conditions where the feedback controller gains are optimized to produce smooth reaching trajectories. The arm was modeled as a two-link arm, with segments representing the upper and lower arms. The inertial and geometric parameters of the two-link model were identical to those used in experimental torque calculations (see earlier). Joints were modeled as damped revolute joints where the shoulder was fixed while the elbow could move freely in the 2D plane^26,27^. The parameters used in the model are summarized in the table below, and the model simulation files are included in the Source Code section. We used the same optimization model to search for gain structures that are optimal for 2D reaching using the two-link model. The class of objective functions used is represented by
Where and represent the final position of the hand and the target in 2D plane during the last, respectively. and are free parameters to assign different weights for reaching the target and generating smooth trajectories, respectively. T denotes the total simulation time, set typically to 5 seconds. Adjusting T forces the model to choose gains that result in faster reaching times. denotes the jerk vector of the hand, or . Jerk is a measurement of how smooth trajectories are; lower jerk indicates smooth reaching.
**: **
Performance metrics for planar reaching task
To assess performance at the kinematics level, we used multiple metrics in this work:
Reach Time: The time it takes to reach the designated target after receiving a ‘go’ cue from the KinArm system.
Path Efficiency: The performance of each reaching path in comparison to the ideal path such that:
where T denotes the total reach time, x and y denote hand positions, dx/dt and dy/dt denote the hand velocities measured during reaching, and D denotes the straight line distance from start to target. This measure is used as it scales between 0 and 1 and can be interpreted as a percentage of the participant’s performance relative to the best possible performance (100% being a straight line).
Number of Elbow Velocity Peaks: The number of peaks in the speed profile of the elbow during the reaching phase of the task. Fewer peaks is associated with smoother trajectories.
Reaching Success Rate: The total number of successful trials (i.e. where the participant made it to the target in under 20 seconds) divided by the total number of trials. Success rates were calculated using all experimental trials included for each participant
Figure Generation
Plots were generated in either Matlab (MathWorks) or Python, and were then styled and exported into vector graphics format using InkScape and BioRender.
Statistics
We used paired t-tests to compare performance metrics and model fit gains for STIM OFF versus STIM ON for the same participant, and unpaired t-tests for other comparisons (e.g. comparisons between different participants, etc.). All samples were tested using the Shapiro-Wilk test prior to using t-test to confirm the normality of sample distributions. When appropriate, for multiple t-tests of groups of conditions related to one another, we used multiple t-test corrections using the Benjamini Hochberg method for false discovery rate correction. We further used Cohen’s d-values to assess differences between samples when appropriate. We used a cutoff level for statistical significance of 0.05 throughout the study.
Extended Data
**Extended Data
**Extended Data
Measured and simulated torque profiles for the shoulder during planar reaching performed by healthy control participants.The scatterplots show the normalized controller gains for the PD controller simulations that were fit to the data. The controller gains exhibit similar U-shape and inverted U-shape patterns across subjects for the elbow and shoulder, respectively. Corresponding NRMSE and SNE values are reported in Extended Data Table 2.
Measured and simulated torque profiles for the elbow during planar reaching performed by healthy control participants.Values represent normalized gains. Data are of the same trials as Extended Data Figure 1. Corresponding NRMSE and SNE scores are reported in Extended Data Table 2.
Measured and simulated torque profiles for the shoulder and elbow during planar reaching performed by five participants in the stroke group.The model produced good fits for both elbow and shoulder for all participants under both STIM OFF and STIM ON conditions. Corresponding NRMSE and SNE scores are reported in Extended Data Table 2.
Controller gains for the shoulder and elbow for the five participants in the stroke group. The controller gains are the result of fitting the PD controller simulation to the reaching data for the center-out task presented in Extended Data Figure 2.SCS02 (panel a) showed the greatest improvements in reaching performance metrics (Table 1) in the STIM ON condition, and the underlying changes in control gains provide insights into why. Looking at the elbow joint, we observed that the derivative gains of both elbow flexors and extensors were significantly reduced under STIM ON. In particular, the elbow flexor derivative derivative gain was reduced by 44% (p = 0.0021, d = 1.19), and the extensor derivative gain was reduced by 73% (p < 0.001, d = 1.51). Both derivative gains of the shoulder were also reduced. The derivative gains of the shoulder flexor and extensor were reduced by 92% (p < 0.001, d = 1.51) and 23% (p = 0.007, d = 1.01), respectively. Notice that all gains are tuned towards healthy ranges, with the exception of the flexor proportional gain, which increased with STIM ON.SCS04 (panel b) also showed significant reduction in 3 out of 4 derivative gains (albeit less drastic due to a better baseline compared to SCS02). In particular, the derivative gains of the elbow flexor and extensor were reduced by 26% (p = 0.047, d = 0.98) and 30% (p = 0.01, d = 1.12), respectively, while that of the shoulder flexor was reduced by 73% (p < 0.001, d = 1.55). In addition, the proportional gains of both the elbow extensor and the shoulder flexor (i.e. the two proportional ballistic gains, which act to drive the joints towards the target during the ballistic phase) increased by 83% (p < 0.001, d = 1.44) and 163% (p < 0.001, d = 1.79, respectively. Similar to SCS02, tuning of the control gains in SCS04 were towards healthy ranges, but spanned both proportional and derivative gains.SCS07 (panel c) showed changes that were less pronounced compared to both SCS04 and SCS02. Two out of 4 derivative gains showed decrease closer to healthy ranges, namely the shoulder extensor and the elbow flexor. The shoulder extensor derivative gain showed a trend of 11% reduction (p = 0.054, d = 0.71), while the elbow flexor showed a significant 31% reduction (p < 0.001, d = 1.41). Contrary to SCS04 who had proportional ballistic gains lower than healthy ranges, SCS07 had higher baseline compared to healthy ranges, which was reduced by SCS. In particular, the elbow extensor proportional gain showed a trend of 21% reduction (p = 0.051, d = 0.78), and the shoulder flexor showed a significant 20% reduction (p = 0.038, d = 0.90). Overall, SCS07 showed the same trend of control gains tuned closer to healthy control ranges (albeit in a slightly different way compared to SCS04 and SCS02), as summarized in panel c. SCS03 showed no significant difference between all gains, which is consistent with his close to healthy baseline reaching, and hence the minimal effects of SCS.Overall, 3 out of 4 participants showed control gain tuning closer to healthy ranges (with the exception of SCS03 (panel d) who had baseline close to healthy to begin with). Notably, while different participants showed gain tuning closer to healthy in different ways. SCS02 showed overall reduction in derivative gains, SCS04 showed reduction in derivative gains and increase in proportional gains, while SCS07 showed reduction in derivative gains and proportional gains alike. The tuning of the gains was individualized, and depended on the participants’ baseline gains. This highlights both that gain tuning is not arbitrary, and the individualized nature of the effects of neuromodulation on the neural controller of the arm.
Average gain fits for all healthy participants (N = 12 participants; n = 3 trials each, 5 model fits for each trial) for elbow and shoulder joint during forward reaching. Individual participant values are shown in thin gray and group average is shown in thicker black lines.
**Extended Data
Supplementary Material
1
The reference list from the paper itself. Each links out to its DOI / PubMed record.
- 1Feigin V. L. Global, regional, and national burden of stroke and its risk factors, 1990–2019: a systematic analysis for the Global Burden of Disease Study 2019. Lancet Neurol. 20, 795–820 (2021).34487721 10.1016/S 1474-4422(21)00252-0PMC 8443449 · doi ↗ · pubmed ↗
- 2Gerstl J. V. E. Global, Regional, and National Economic Consequences of Stroke. Stroke 54, 2380–2389 (2023).37497672 10.1161/STROKEAHA.123.043131 PMC 7614992 · doi ↗ · pubmed ↗
- 3Pu L. Projected Global Trends in Ischemic Stroke Incidence, Deaths and Disability-Adjusted Life Years From 2020 to 2030. Stroke 54, 1330–1339 (2023).37094034 10.1161/STROKEAHA.122.040073 · doi ↗ · pubmed ↗
- 4King E. C., Pedi E., Stoykov M. E., Corcos D. M. & Urday S. Combining high dose therapy, bilateral motor priming, and vagus nerve stimulation to treat the hemiparetic upper limb in chronic stroke survivors: a perspective on enhancing recovery. Front. Neurol. 14, (2023).
- 5Powell M. P. Epidural stimulation of the cervical spinal cord for post-stroke upper-limb paresis. Nat. Med. 29, 689–699 (2023).36807682 10.1038/s 41591-022-02202-6PMC 10291889 · doi ↗ · pubmed ↗
- 6Baker K. B. Cerebellar deep brain stimulation for chronic post-stroke motor rehabilitation: a phase I trial. Nat. Med. 1–9 (2023).36694061 10.1038/s 41591-022-02186-3 · doi ↗ · pubmed ↗
- 7Ting J. Novel invasive methods to promote recovery after cerebral lesions. Brain Stimul. Basic Transl. Clin. Res. Neuromodulation 18, 291–292 (2025).
- 8Todorov E. & Jordan M. I. Optimal feedback control as a theory of motor coordination. Nat. Neurosci. 5, 1226–1235 (2002).12404008 10.1038/nn 963 · doi ↗ · pubmed ↗