Strain amplitude sweep testing of oscillatory shear of transient networks with controlled network structures
Ren Sato, Yoshifumi Yamagata, Moe Araida, Taisuke Sato, Mitsuru Naito, Hiroshi Sekiguchi, Keishi Akada, Ung-Il Chung, Takuya Katashima

TL;DR
This study investigates how transient networks behave under stress using controlled models, revealing how their structure affects nonlinear elasticity.
Contribution
The paper introduces a well-defined model system to clarify the onset of nonlinear viscoelasticity in transient networks.
Findings
Rheo-polarization imaging shows homogeneous deformation and scaling changes at nonlinear onset.
Rheo-SAXS confirms no nanoscale structural changes during nonlinear deformation.
Elastic contribution scales with the Weissenberg number squared, indicating a balance between relaxation and deformation.
Abstract
The origin of nonlinear stress behaviors in transient networks during oscillatory shear measurements is investigated in this study via two-dimensional rheo-optics observations of a systematically controlled model system comprising tetra-armed polyethylene glycols (Tetra-PEG slime). Transient networks are characterized by their temporary crosslinks. However, the strain scale at which nonlinear viscoelastic responses begin to emerge under strain amplitude sweep in oscillatory shear deformations remains poorly characterized. The uncertainty of nonlinear onset can be attributed, at least in part, to the heterogeneous structures inherent to conventional transient networks, as well as to the limited availability of detailed experimental evaluations. We overcome these limitations by employing Tetra-PEG slime, which possesses a well-defined network structures with uniform strand lengths and…
Genes, proteins, chemicals, diseases, species, mutations and cell lines named across the full text — each resolved to its canonical identifier and authoritative record.
Click any figure to enlarge with its caption.
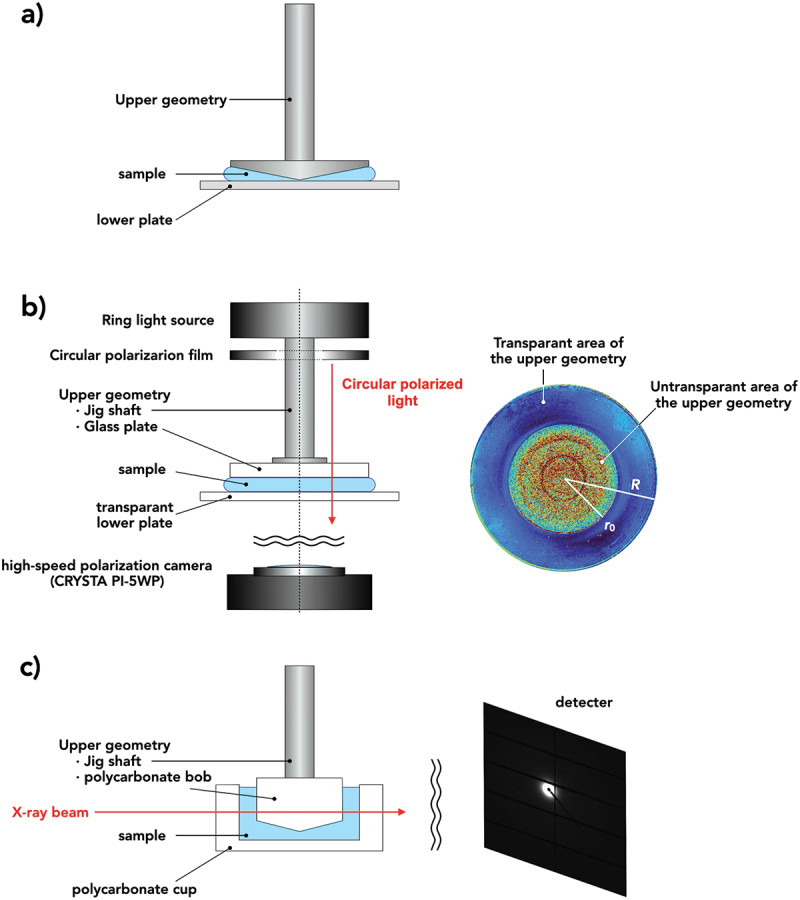 Figure 1
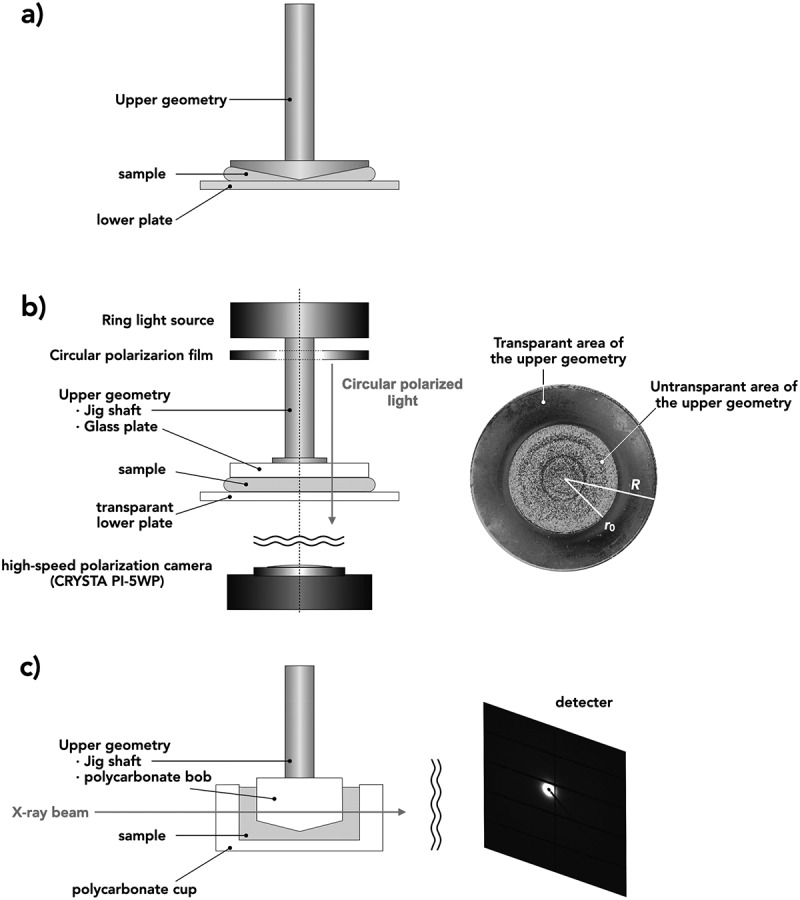 Figure 2
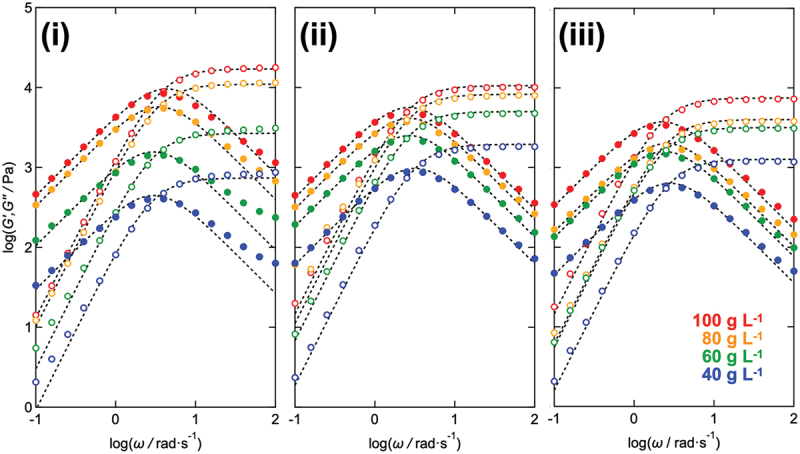 Figure 3
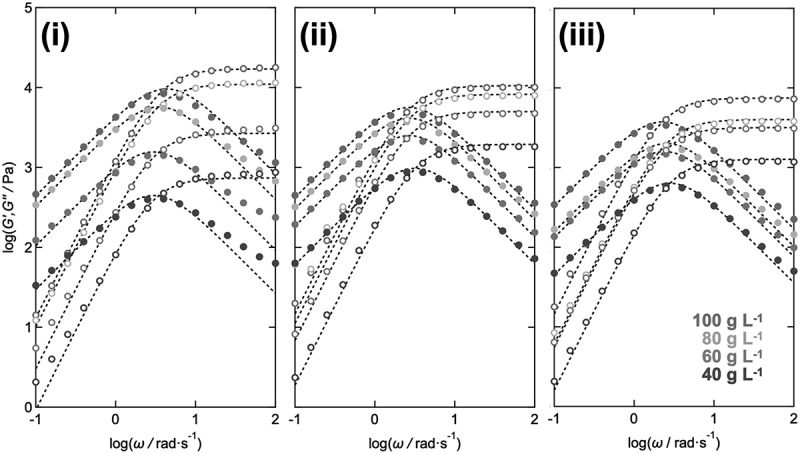 Figure 4
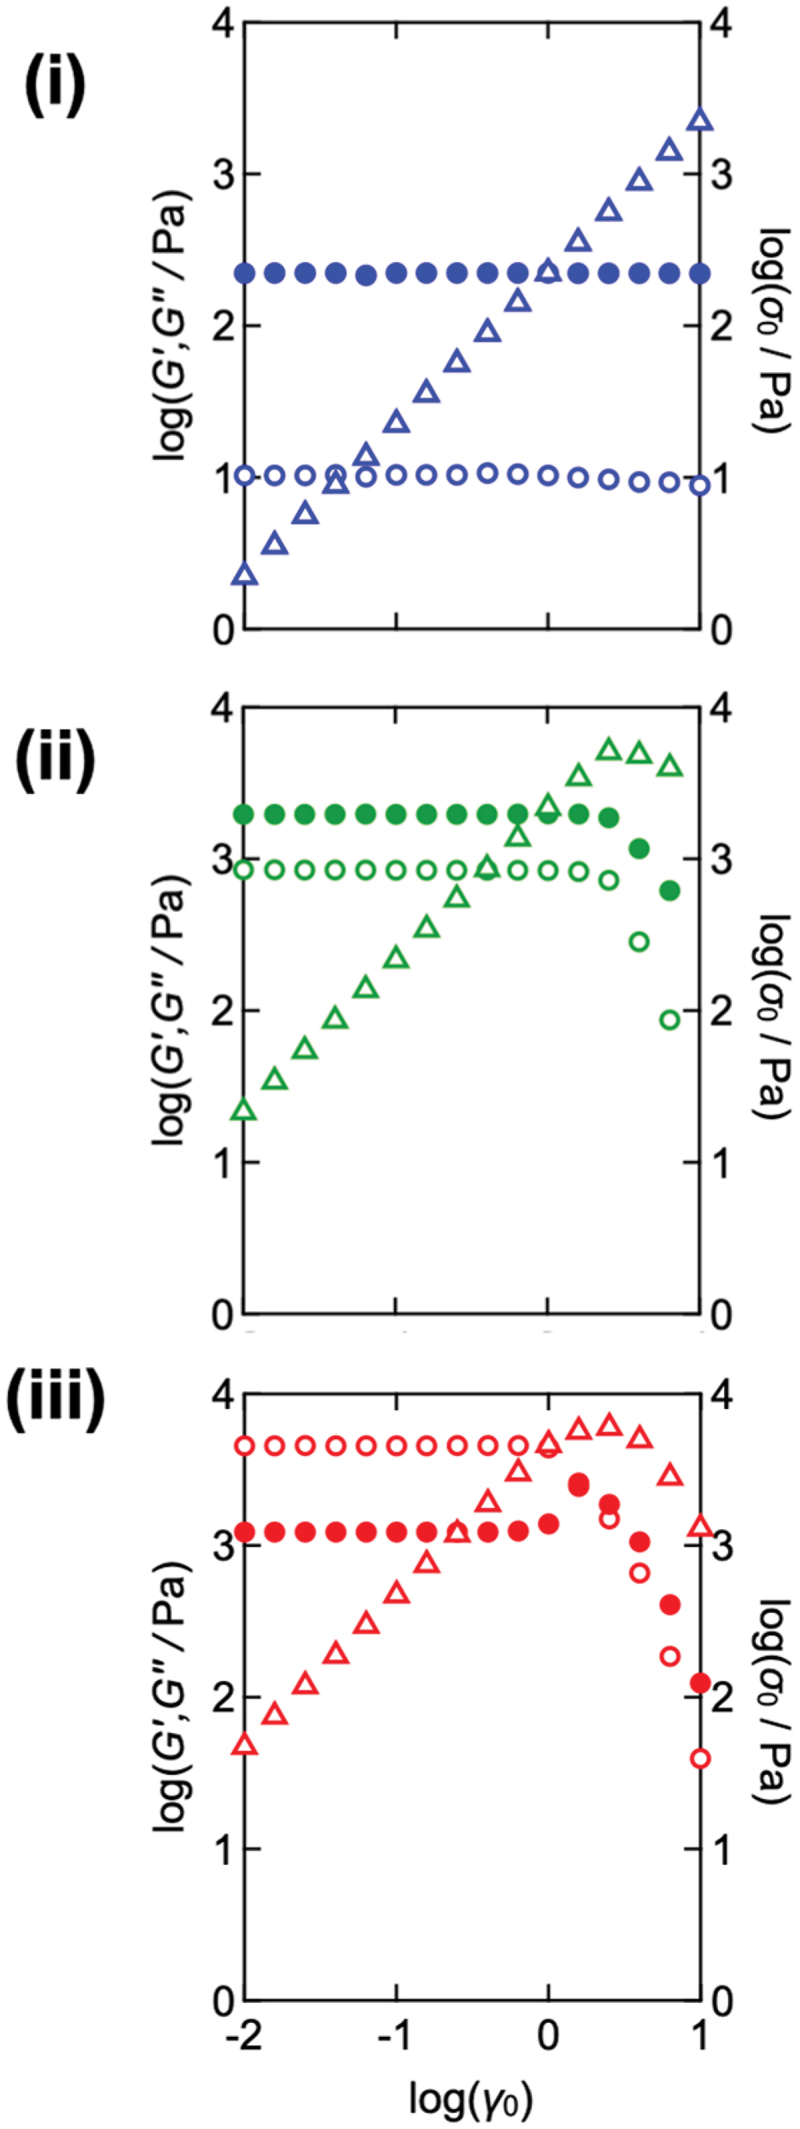 Figure 5
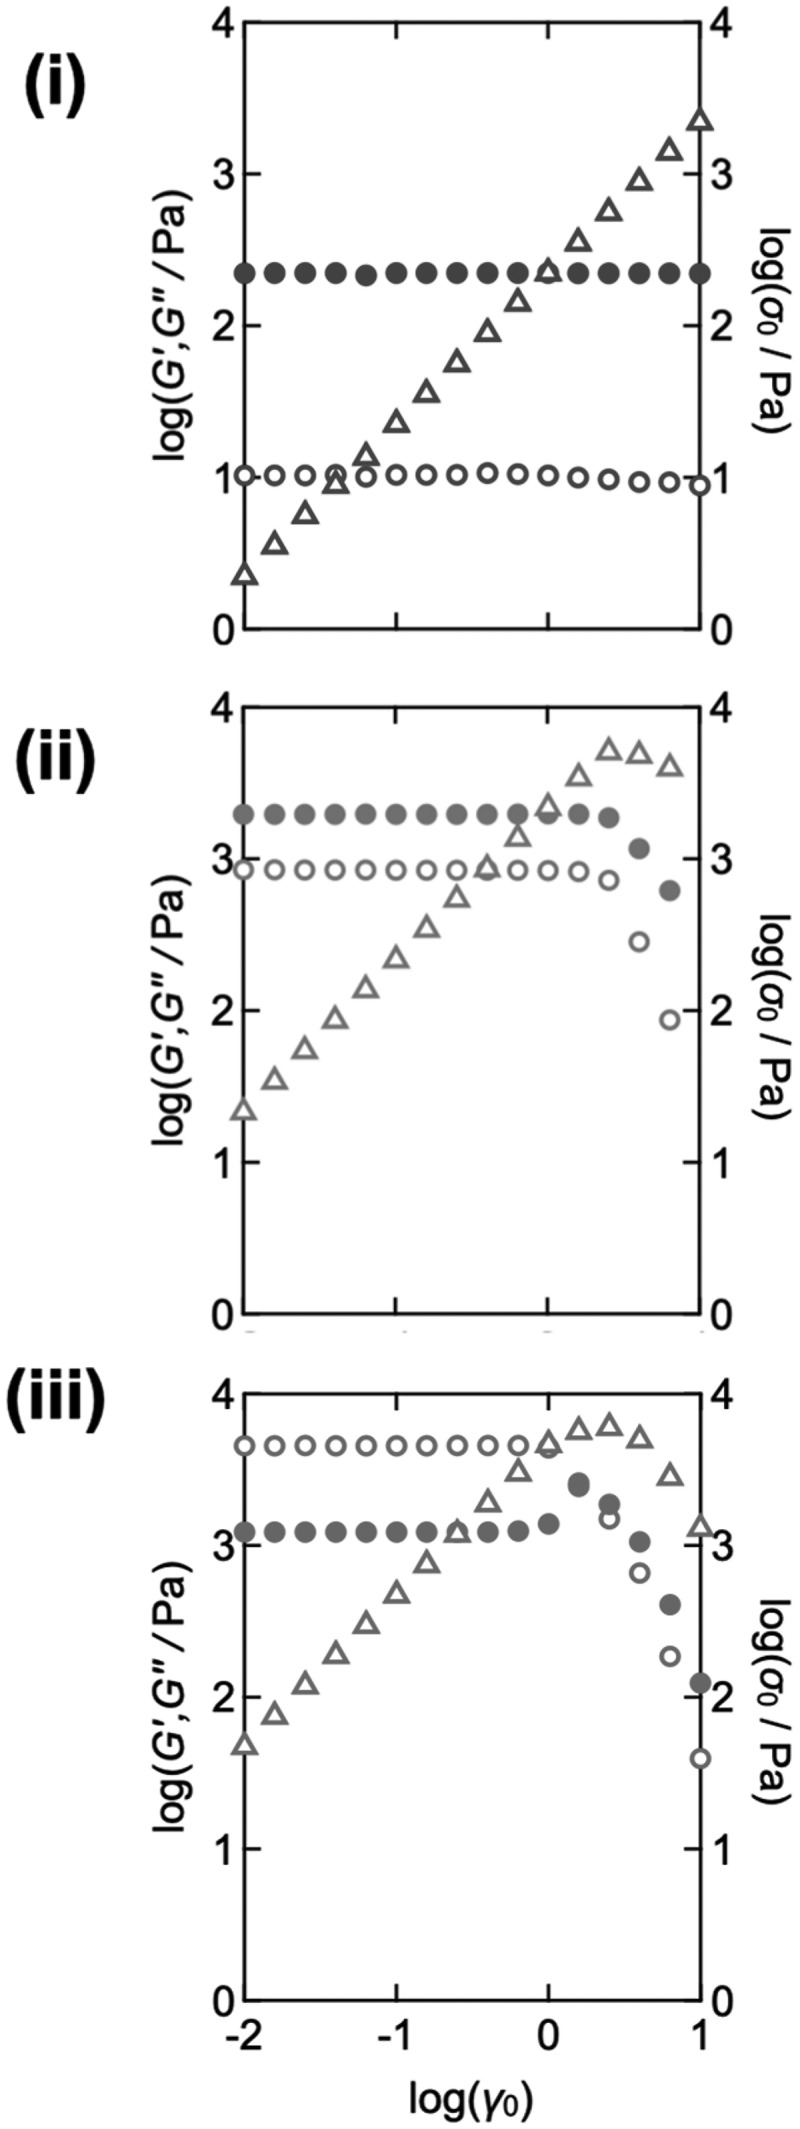 Figure 6
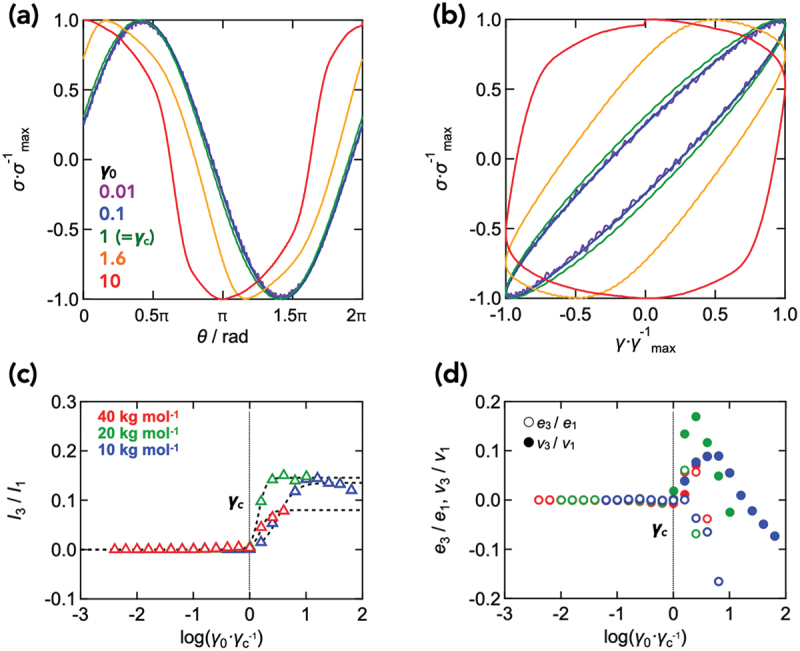 Figure 7
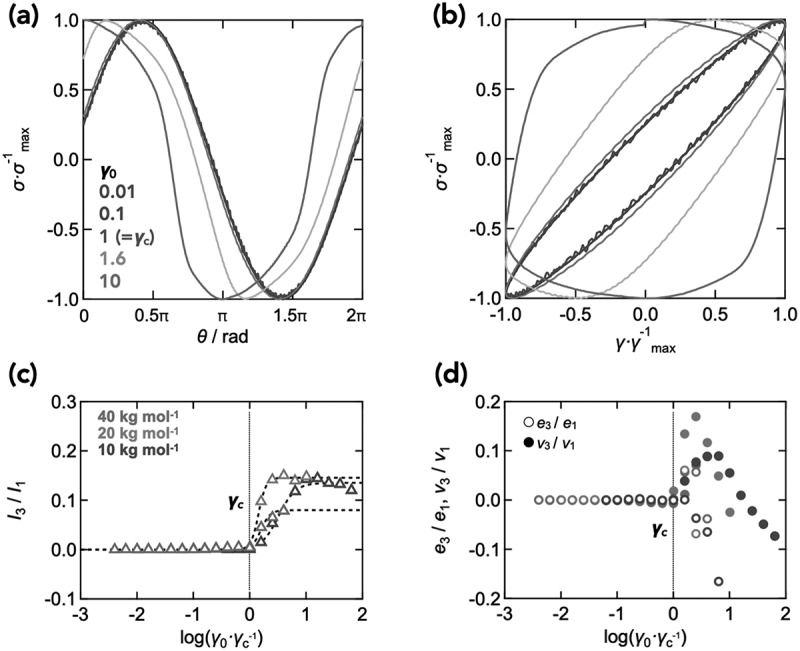 Figure 8
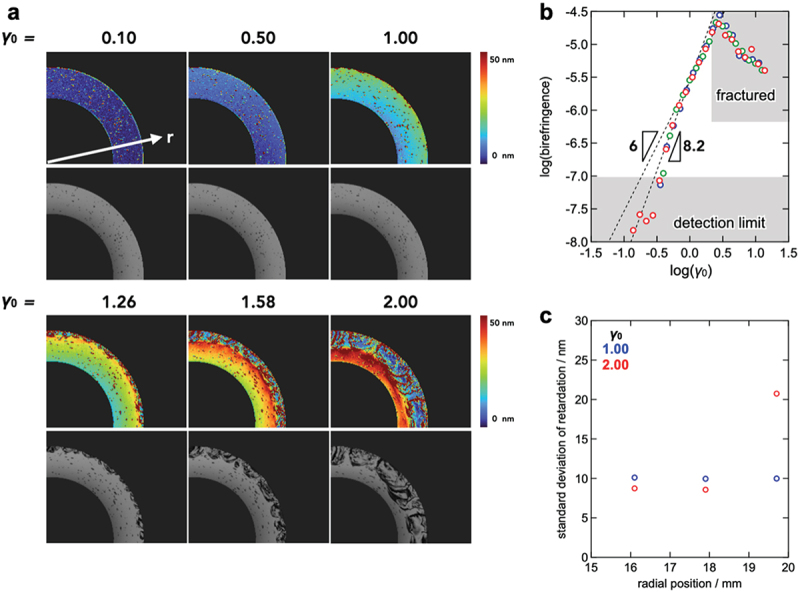 Figure 9
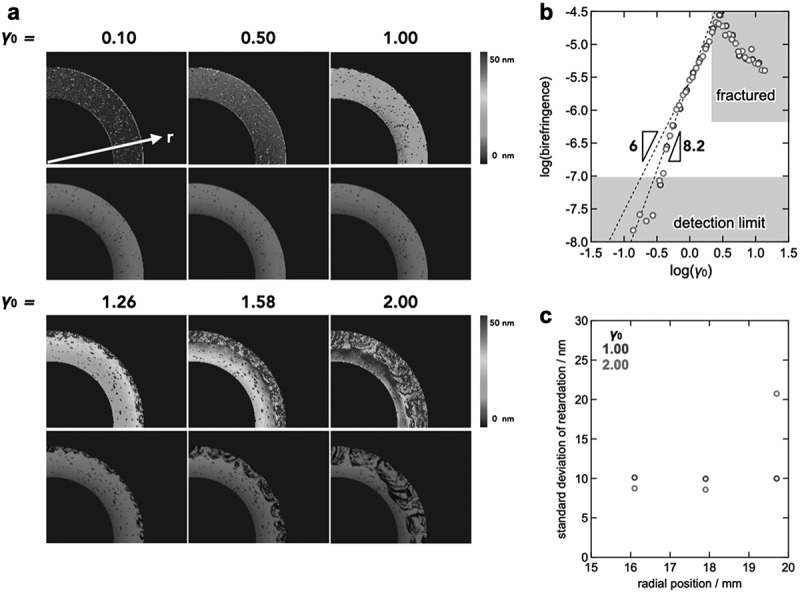 Figure 10
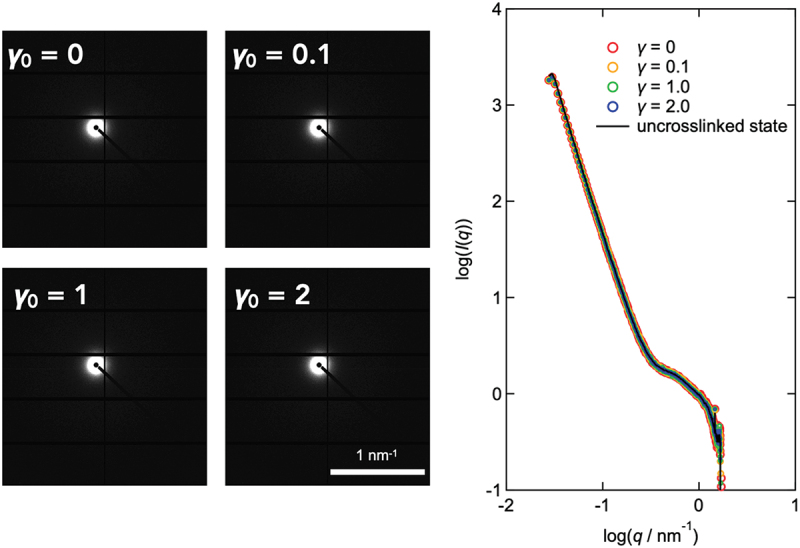 Figure 11
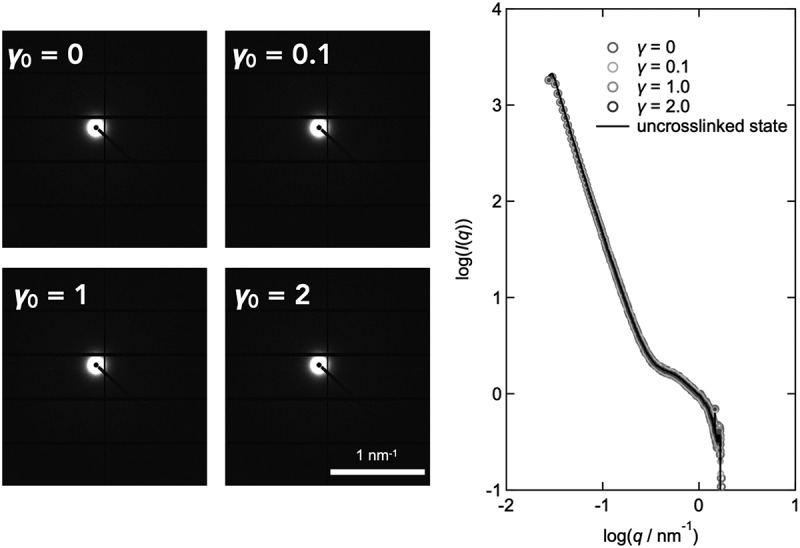 Figure 12
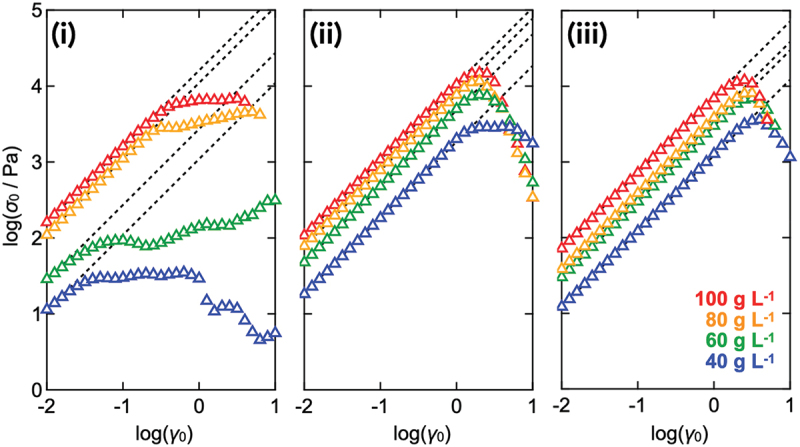 Figure 13
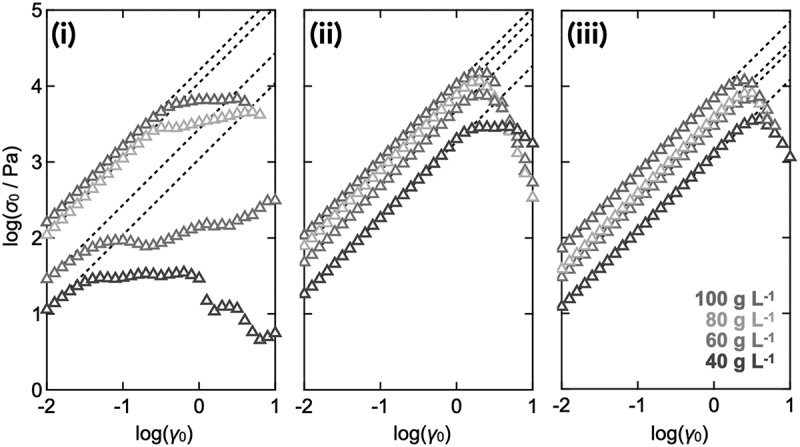 Figure 14
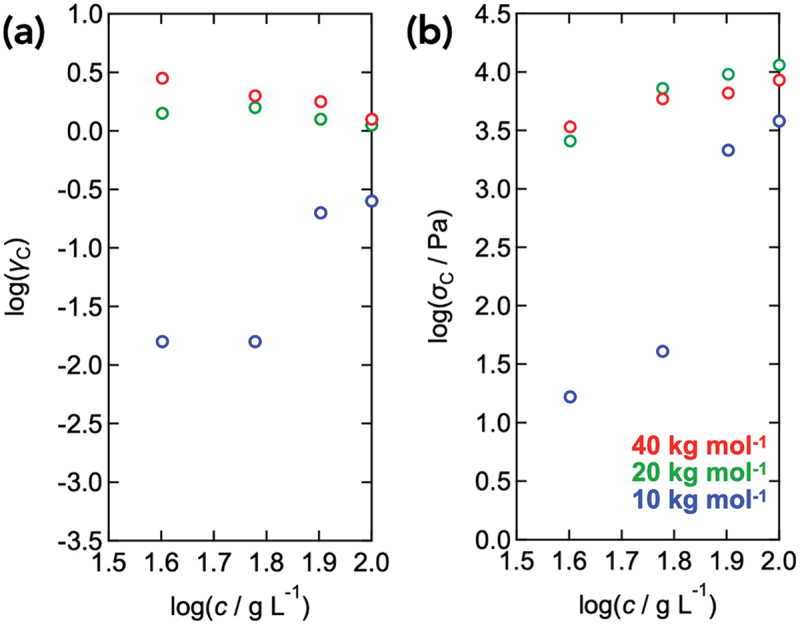 Figure 15
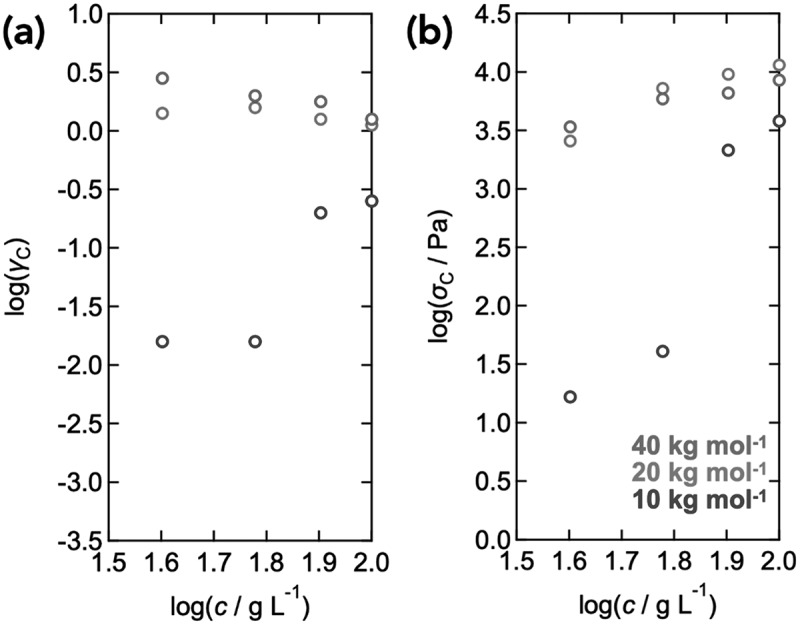 Figure 16
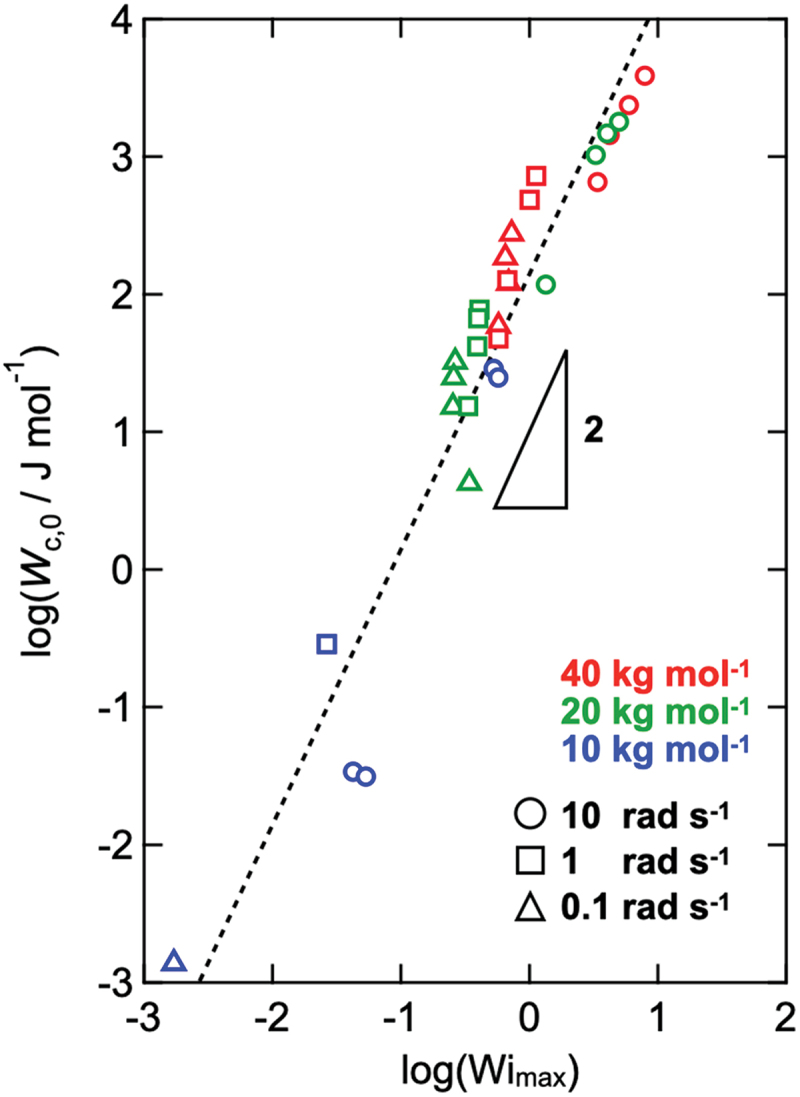 Figure 17
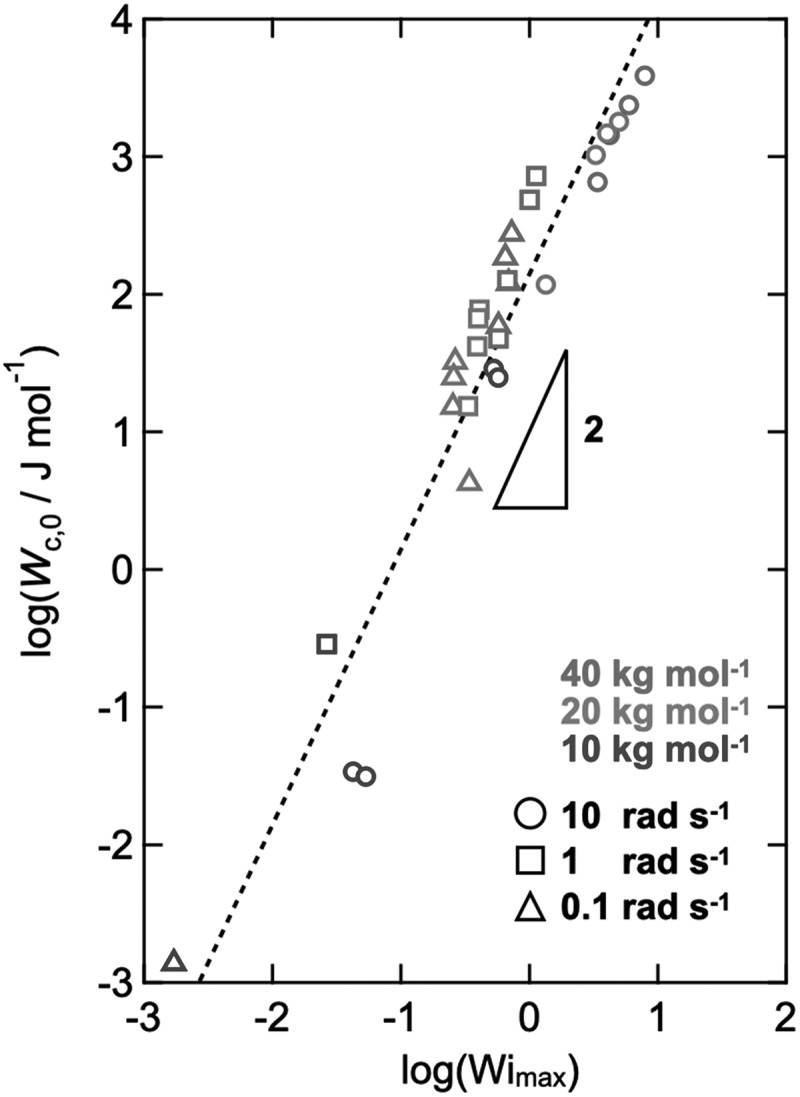 Figure 18
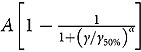 Figure 19
 Figure 20
 Figure 21
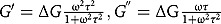 Figure 22
 Figure 23
 Figure 24
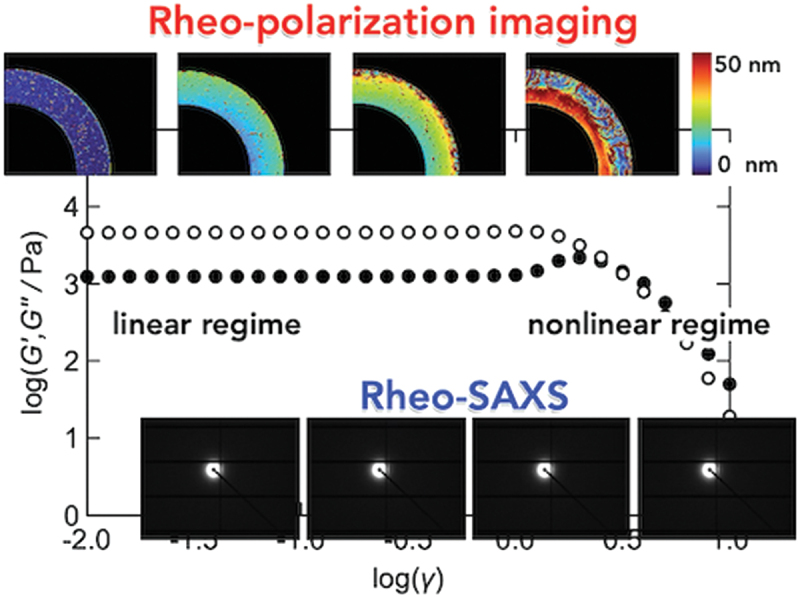 Figure 25
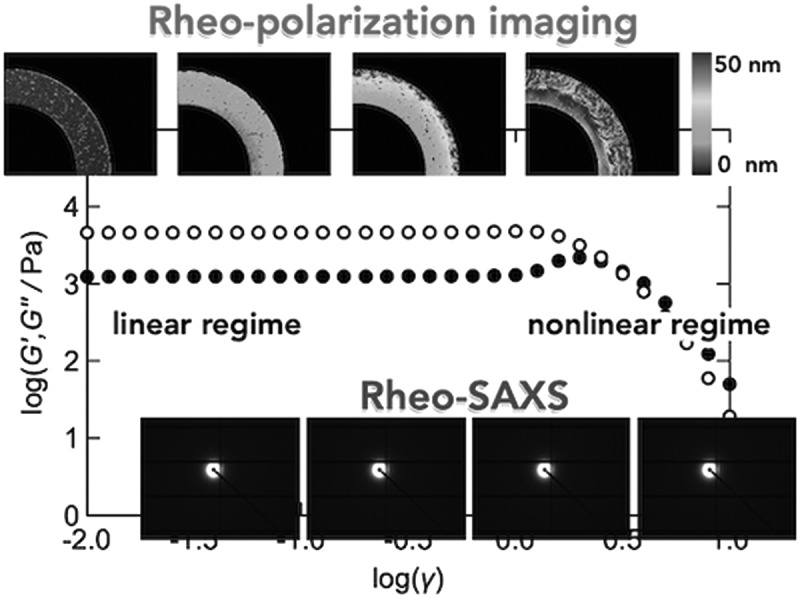 Figure 26
 Figure 27
- —Japan Society for the Promotion of Science10.13039/501100001691
- —Japan Science and Technology Agency10.13039/501100002241
- —Fusion Oriented REsearch for disruptive Science and Technology
- —Environment Research and Technology Development Fund
- —Ministry of the Environment10.13039/501100002981
- —UTEC-UTokyo FSI Research Grant Program
- —New Energy and Industrial Technology Development Organization (NEDO)
Peer Reviews
No public reviews on file for this paper yet. If you reviewed it on a platform where reviews are public (OpenReview, ICLR, NeurIPS, ICML), you can paste yours below so the community can read it here.
Videos
No videos yet. Explain this paper in a talk, walkthrough, or lecture? Add one.
Taxonomy
TopicsAdvanced Materials and Mechanics · Nonlinear Optical Materials Studies · Cellular Mechanics and Interactions
Introduction
Transient networks such as threadlike micelles [1–4] or associative polymers [5–9] are a class of viscoelastic liquid materials with three-dimensional network structures formed through reversible interactions (i.e., coordination, hydrogen, and dynamic covalent bonds). The viscoelasticity of these materials is effectively characterized using small-amplitude oscillatory shear (SAOS). In SAOS measurements, a sinusoidal strain γ(t) = γ0 sin(ωt) is applied to the sample, where γ0 and ω are the strain amplitude and the angular frequency, respectively, while t represents the time. The corresponding stress response is given by σ(t) = σ0 sin(ωt +δ), where δ is the loss phase angle and σ0 represents the stress amplitude. In this framework, the strain and stress are treated as the imposed input and measured output, respectively.
When the strain amplitude is small, σ0 is proportional to γ0, exhibiting linear viscoelasticity, which reflects the molecular dynamics and structures at the equilibrium state. According to previous studies, the SAOS behavior of transient networks is often described by the Maxwell model, which indicates that stress relaxation is governed by a single relaxation mode [1,6,10]. As γ0 increases beyond a certain threshold, σ0 deviates from a proportional relationship with γ0, suggesting the onset of nonlinear viscoelastic behavior. We treat the onset strain phenomenologically as an experimental indicator of nonlinearity. These nonlinear features are interpreted as the complex interplay between bond dissociation – reformation dynamics and polymer chain deformation [11,12].
Thus far, steady shear flow measurements have been employed to probe such nonlinear rheological behavior, providing information on the viscosity and stress response as a function of deformation rate under steady-state conditions. However, when deformation is imposed on a time scale shorter than the terminal relaxation time of the material, the system may not reach a steady state. Further, steady shear tests provide limited insight into microstructural evolution or relaxation timescales because the measurements reflect time-averaged responses [13–15]. Nonlinear responses in complex fluids, however, are governed by both the magnitude of the imposed strain and the strain rate, which cannot be varied independently in conventional steady or transient shear protocols. In contrast, large-amplitude oscillatory shear (LAOS) allows independent control of the strain amplitude (γ0) and angular frequency (ω) [16–20], providing a framework to identify and map the onset of the nonlinear regime under time-dependent deformation. In addition, LAOS provides access to rich harmonic information regarding the stress signal, which can be analyzed using Fourier-transform rheology [19,21–24] or Chebyshev polynomial decomposition [25–28] to quantify distinct elastic and viscous nonlinearities. For an arbitrary γ0, the stress response can be expressed as a harmonic series,
A convenient scalar measure of the emergence of nonlinearity in Fourier-transform rheology is the normalized third-harmonic intensity, I3/I1 (often equivalently reported as ∣σ3∣/∣σ1∣), which is approximately zero in the linear regime and increases as higher harmonics develop with increasing γ0. In the Chebyshev framework, the stress is decomposed into elastic and viscous contributions parameterized by the normalized strain and strain rate, and expanded in orthogonal Chebyshev polynomials of the first kind T_n_(⋅) as
The normalized third-order elastic and viscous nonlinearities are commonly reported as e3/e1 and v3/v1, which quantify intra-cycle elastic and viscous distortions relative to the fundamental Chebyshev modes, respectively. Therefore, nonlinear contributions evolve continuously with γ0 and do not imply a mathematically sharp critical strain or stress. For practical comparison across conditions, we therefore introduce an operational characteristic strain and stress (γc, σc), defined phenomenologically.
Combined with optical methods such as birefringence or scattering, strain amplitude sweep experiments can correlate macroscopic stress responses with microstructural and molecular orientation dynamics [29–34]. However, a complete understanding of the nonlinear viscoelastic response of transient networks has been difficult to achieve, partly because the structural and dynamic heterogeneities of conventional systems make it challenging to establish quantitative correlations between microscopic structure and macroscopic rheology.
Conventional transient networks possess structural heterogeneities arising from both static and dynamic origins [35–38]. Static heterogeneity refers to structural defects at the equilibrium state, such as dangling chains, loop defects, and the polydispersity of strand lengths and crosslinking functionalities. In contrast, dynamic heterogeneity arises from the coexistence of slow and fast relaxation modes, which reflects complex interactions among network chains, unimers, and micellar aggregates. These hierarchical and uncontrolled structures lead to complex relaxation processes, which obscure the direct correlation between molecular dynamics and macroscopic stress responses under nonlinear deformation. Consequently, a molecular-level understanding of rheological behavior in transient networks has remained elusive because of the intrinsic difficulty in controlling or quantitatively assessing these heterogeneities.
To address these challenges, we recently developed a model transient network system with a well-controlled structure referred to as Tetra-PEG slime [39–41]. This system includes two tetra-armed polyethylene glycol (PEG) precursors end-functionalized with phenylboronic acid and diol groups, which form dynamic covalent bonds through reversible boronate ester linkages. The narrow molecular weight distribution and symmetric network architecture ensure uniform strand lengths and mobilities, effectively minimizing static and dynamic heterogeneities. This molecular precision eliminates uncontrolled hierarchical structures, directly investigating the correlation between reversible bond dynamics and nonlinear mechanical responses under deformation. It should be noted that, even when molecular weight and polymer concentration are systematically varied in conventional systems, quantitative control over network connectivity and the strand-length distribution is generally nontrivial. Establishing a controlled network is therefore an essential first step toward identifying potential molecular-level origins of the onset of nonlinearity in transient networks, while keeping the discussion anchored to experimentally accessible observables.
Nonlinear viscoelastic responses evolve continuously with increasing strain amplitude, and thus the ‘onset of nonlinearity’ does not correspond to a mathematically sharp transition. However, when comparing materials or compositions, an operational onset scale – defined through reproducible experimental criteria – is essential to distinguish the strain range wherein linear viscoelasticity begins to break down. In this study, we focus on identifying and comparing such onset strain scales across structurally controlled transient networks, rather than characterizing the fully developed nonlinear regimes. This framing enables us to correlate the emergence of nonlinear elastic behavior with molecular relaxation processes while avoiding ambiguities associated with strongly nonlinear flow instabilities. To discuss the molecular background, we utilized rheo-polarization imaging (PI) [42,43] and rheo-small-angle X-ray scattering (SAXS) [44–50]. These results offer valuable insights into the onset of nonlinear behavior under oscillatory strain sweep in transient networks.
Materials and methods
Sample preparation
Tetra-armed polyethylene glycol (tetra-PEG) whose end groups were modified with 4-carboxy-3-fluorophenylboronic acid (FPBA) (tetra-PEG-FPBA, Mw = 10, 20, and 40 kg mol^−1^) or glucono-δ-lactone (GDL) (tetra-PEG-GDL, Mw = 10, 20, and 40 kg mol^−1^) were purchased from XIAMEN SINOPEG BIOTECH Co., Ltd. (China). Tetra-PEG-FPBA and tetra-PEG-GDL were dissolved separately in a phosphate buffer (pH 7.4, 200 mM) at mass concentrations of 40, 60, 80, and 100 g L^−1^. These solutions were then mixed at equal volume to obtain the Tetra-PEG slime.
Oscillatory shear measurement
Oscillatory shear measurements were conducted at 25°C using a stress-controlled rheometer (MCR302, Anton Paar, Austria) equipped with a cone-plate fixture, in which a sinusoidal strain was imposed by feedback control of the applied stress. The cone had a diameter of 25 mm and cone angle of 4°. For small amplitude oscillatory shear (SAOS) measurements, the angular frequency dependences (0.01–10 rad s^−1^) of the storage (G') and loss (G'') moduli were measured at a strain amplitude of 0.01, which was confirmed to be within linear viscoelasticity. For strain amplitude sweep measurements, the strain amplitude dependences (0.01–10) of the storage (G') and loss (G'') moduli were measured at angular frequencies of 0.1, 1.0, and 10 rad s^−1^. The schematic illustration of the experimental setup is shown in Figure 1(a). Figure 1.Schematic illustration of experimental setups for small-amplitude oscillatory shear (SAOS) and strain amplitude strain measurements (a), Rheo-polarization imaging measurements (b), and Rheo-SAXS measurements (c). R ( = 21.5 mm) indicates the radius of the upper glass plate and r0 ( = 14.5 mm) is the radius of the non-transparent area of the upper geometry.
Rheo-polarization imaging measurement
The same rheometer equipped with a transparent glass parallel plates (diameter: 43 mm) as the upper geometry was used for PI during the strain amplitude sweep measurements. The sample thickness was fixed at 2 mm for all measurements. The rheometer head featured a lighting system that comprised a ring white LED and circular polarizing film to project circularly polarized light onto the sample. A high-speed polarization camera (CRYSTA PI-5WP; Photonic Lattice Inc., Japan) was positioned beneath the lower plate, and a band-pass filter with a transmission spectrum centered at 543 nm was placed in front of the camera. This setup enabled real-time observations of the retardation (birefringence) and orientation axis distributions. This camera captured 12-bit grayscale intensity images (848 × 680 pixels) and detected the light intensity passing through a photonic crystal element that functioned as a rotational linear polarizer. Four linear polarizers were set at 45° intervals, and their outputs were integrated into four neighboring pixels of the image sensor. The schematic illustration of the experimental setup is shown in Figure 1(b). Although the rheo-polarimetry module is available only with a parallel-plate (PP) fixture, only optical retardation is analyzed to assess spatial deformation, and PP-derived stress data were not used for quantitative comparison. Because the PP geometry intrinsically exhibits a radial strain gradient, retardation was evaluated as a function of the local strain amplitude after correcting for the radial position r. Stress-based comparisons across geometries are restricted to the regime γ0 ≤ γc, wherein flow remains homogeneous, and stress responses agree across geometries.
Rheo-SAXS measurement
Rheo-SAXS measurements under strain amplitude sweep were performed using the same rheometer equipped with a polycarbonate coaxial double-cylinder geometry (bob and cup radii = 19.5 and 20.5 mm, respectively). The rheometer was integrated into a synchrotron SAXS setup at beamline BL40XU (SPring-8, Japan). A monochromatic X-ray beam with a wavelength of 1.24 × 10^−10^ m was used, and the range of the provided scattering vector (q) was 2.76 × 10^−2^–1.70 nm^−1^. Scattering patterns were recorded using the two-dimensional detector PILATUS1M. The strain amplitude sweep experiments were conducted at strain amplitudes of γ0 = 0.01–2 and an angular frequency of 10 rad s^−1^. In our Rheo-SAXS setup, precise synchronization between the oscillatory motion of the rheometer and the detector time-slicing was not available. The X-ray exposure time was 3.142 s, corresponding to five oscillation cycles during which SAXS patterns were collected, so that all phases of the oscillation were averaged while avoiding beam-induced damage to the shearing cell. An X-ray beam passed through the center of the polycarbonate Couette cell, perpendicular to its rotational axis. The schematic illustration of the experimental setup is shown in Figure 1c. We verified that strain amplitude sweep measurements performed with cone-plate (CP) and concentric-cylinder (CC) fixtures yielded consistent stress – strain responses, waveforms, and Lissajous curves within the strain regime below the onset of nonlinearity (γ ≤ γc). Accordingly, all quantitative analyzes in this work are based on CP-derived stress data within γ ≤ γc, and CC-derived stress data are used only in conjunction with Rheo-SAXS under the same strain limitations.
Results and discussion
Figure 2 shows the representative SAOS measurement results for Tetra-PEG slime samples with various molecular weights and polymer concentrations. In the viscoelastic spectrum, the storage modulus G' plateaued at high frequencies, but exhibited terminal relaxation behavior (G' ~ ω^2^ and G'' ~ ω) at low frequencies; within this region, the loss modulus G' formed a roughly symmetric peak around its maximum. These frequency dependences of the storage and loss moduli of the Tetra-PEG slime were quantitatively described well by a Maxwell model, which is expressed as.
Figure 2.Angular frequency (ω) dependence of the storage (G’, open circles) and loss (G”, filled circles) moduli of the Tetra-PEG slimes (i: Mw = 10 kg mol^−1^, ii: Mw = 20 kg mol^−1^, iii: Mw = 40 kg mol^−1^) with various polymer concentrations (c). The dashed curves represent the fitting results obtained using the Maxwell model.
where ΔG and τ represent the shear modulus and relaxation time, respectively. The ΔG and τ values for each sample are summarized in Table 1. As indicated by the dashed fitting lines, the Maxwell-model fit captures these features well over the fitted frequency range. Notably, in the high-frequency regions of the low-polymer-concentration samples, modes associated with the PEG chains were observed. A more detailed molecular interpretation of the relaxation process, which we have discussed previously, is beyond the scope of the present study [40].Table 1.Modulus (ΔG, top) and relaxation time (τ, bottom) of the Tetra-PEG slime with various molecular weight (Mw) and polymer concentration (c), as estimated by the Maxwell model.ΔG /Pa Mw [kg mol^−1^] 102040c [g L^−1^]1001.7 × 10^4^1.1 × 10^4^7.4 × 10^3^ 801.2 × 10^4^7.8 × 10^3^4.0 × 10^3^ 603.1 × 10^3^4.8 × 10^3^3.1 × 10^3^ 408.9 × 10^2^1.9 × 10^3^1.3 × 10^3^τ/s Mw [kg mol^−1^] 102040c [g L^−1^]1002.6 × 10^−1^4.1 × 10^−1^4.5 × 10^−1^ 802.9 × 10^−1^4.0 × 10^−1^4.0 × 10^−1^ 603.4 × 10^−1^3.9 × 10^−1^4.2 × 10^−1^ 403.4 × 10^−1^3.3 × 10^−1^3.6 × 10^−1^
Figure 3 shows the results of strain amplitude sweep measurements conducted under various frequencies (ω) using strain amplitude (γ0) as a variable. The shear stress amplitude (σ0) is also plotted as triangles. At ω = 0.1 rad s^−1^, G' and G'' are independent of the applied strain, and σ0 is linearly proportional to γ0, which suggests the linear viscoelastic regime. At higher frequencies (ω = 1.0 and 10 rad s^−1^), G' dropped when γ0 exceeded the upper limit of the linear regime (γc), and G' and G'' became appreciably dependent on γ0. In principle, it is not possible to determine where the nonlinearity starts to appear. In this paper, γc, also referred to as the critical strain amplitude, was regarded as a reference of the onset, and set as the strain amplitude at the data point immediately preceding that at which the measured stress amplitude deviated by more than 5% from the linear fit to the stress – strain response. The strain dependencies of G' and G'' were observed more clearly at higher frequencies and became detectable at smaller strain amplitudes as the frequency increased. This tendency has been observed across various materials, including suspensions, soft gels, and food products [51–53]. The detailed G' and G'' values as a function of strain for the Tetra-PEG slimes with other concentrations and network strand length are shown in Section 1 of the Supporting Information. Notably, in the nonlinear regime, the quantities G' and G'' obtained under LAOS should be regarded as apparent moduli. In this study, they are used only to identify the onset of nonlinearity, while stress waveforms and Lissajous curves confirm the validity of the sinusoidal response within the relevant strain range in the next discussion. Figure 3.Shear strain (γ0) dependencies of the storage modulus G’ (open circles), loss modulus G” (filled circles), and shear stress σ0 (triangles) of the Tetra-PEG slime (Mw = 20 kg mol^−1^ and c = 60 g L^−1^) at various angular frequencies (ω). (i) ω = 0.1 rad·s^−1^, (ii) ω = 1.0 rad·s^−1^, and (iii) ω = 10 rad·s^−1^.
Figure 4 shows the stress waveform analysis of the Tetra-PEG slime (Mw = 20 kg mol^−1^, c = 60 g L^−1^) under strain amplitude sweep measurements at various strain amplitudes. Up to the critical strain amplitude γc, the Lissajous curves remained nearly perfect ellipses, whereas above γc they became progressively distorted, indicating the onset of nonlinear viscoelasticity. This transition was also evident in the harmonics ratio (I3/I1), elastic (e3/e1) and viscous (v3/v1) Chebyshev coefficients, which remained negligible when γ0 ≤ γc and drastically increased once γ0 exceeded γc. Notably, when the data points for these higher-harmonic measures were subjected to sigmoidal fits, the γ0-axis intercept of the tangent at the 50% point of the sigmoid fit agreed well with the γc. Specifically, γc was defined as the strain amplitude at which σ0 deviates by 5% from the linear scaling (σ0 ∝ γ0), and the onset strain estimated from the maximum-slope tangent of I3/I1 fitted with agree within 10%. Here, A is a scaling constant, γ50% is the strain amplitude at the 50% point, and α controls the sharpness of the transition. This agreement supports the validity of determining γc based on the deviation of σ0 from the expected proportionality to γ0. Figure 4.Stress waveform analysis during strain amplitude sweep measurements under various strain amplitudes at an angular frequency of 10 rad s^−1^. Normalized stress as a function of phase of applied strain (a) and normalized applied strain (b) of Tetra-PEG slime (Mw = 20 kg mol^−1^, c = 60 g L^−1^). Harmonics ratio I3/I1 (c) and elastic (e3/e1) and viscous (v3/v1) Chebyshev coefficients (d) as functions of strain normalized against γc of Tetra-PEG slime (Mw = 10, 20, 40 kg mol^−1^, c = 60 g L^−1^).
We employed rheo-PI to visualize the spatial distribution of birefringence and the structural evolution during the strain-amplitude sweep measurements. Notably, in this study, birefringence was used to assess whether spatially heterogeneous macroscopic orientation develops, and not to perform a full nonlinear optical decomposition under strain-amplitude sweep. Figure 5(a) shows the spatial retardation distribution obtained from the strain-amplitude sweep measurement; here, r represents the radial distance from the center of the parallel-plates fixture. The colored regions in the image correspond to areas of active flow within the sample. The dark regions observed at lower r values are attributed to light obstruction caused by the shaft of the fixture, while those at higher r values indicate regions outside the sample. Figure 5.(a) Spatial distribution of the retardation of the Tetra-PEG slime (Mw = 20 kg mol^−1^, c = 60 g L^−1^) under various shear strain amplitudes (γ0 = 0.10, 0.50, 1.00, 1.26, 1.58, and 2.00). The monochrome images in the lower rows represent the brightness value maps. (b) Birefringence (retardation normalized against thickness) plotted against the strain amplitudes normalized against the radius r (blue: r = 16.1 mm, red: r = 17.9 mm, and green: r = 19.7 mm). (c) Radial position dependence of standard deviation of retardation under different strain amplitudes (blue: γ0 = 1.00, red: γ0 = 2.00).
It should be noted that, while coaxial cylinder and cone-plate geometries are suitable in principle for determining the stress, the parallel-plate geometry does not rigorously provide correct stress values. Therefore, for the Rheo-PI measurements with the parallel- plates geometry, we restricted the analysis to retardation and did not use the parallel-plate data for conducting quantitative stress-based comparisons across geometries. After applying a correction for strain differences caused by variations in r, the retardation was analyzed as a function of the local strain amplitude. The details of this correction are provided in Section 2 of the Supporting Information.
In the linear regime, we evaluated the birefringence by taking the radial average of the retardation at the peak of each oscillation cycle. This peak retardation increased homogeneously with increasing strain (Figure 5(b)). Figure 5(c) shows the radial dependence of the standard deviation of the retardation at the strain maxima for different strain amplitudes. The standard deviation remained small and nearly uniform in the linear regime, but increased markedly near the edges at higher strains, indicating that the sample became increasingly heterogeneous from the outer region. A similar trend was observed in the brightness images. Although the retardation was averaged along the thickness direction, Rheo-PI provided an in-plane spatial map; hence, the radial profiles and the spatial standard deviation of retardation quantified the degree of macroscopic deformation inhomogeneity within the field of view. This implies that the material deformed spatially homogeneously at least up to γc, so that the onset of nonlinear behavior from γc was not accompanied by a detectable macroscopic deformation inhomogeneity in the flow and orientation field within the observation plane. Consistent with this, the retardation – strain relation exhibited a change in scaling behavior at around γc (Figure 5(b)), suggesting that the onset of nonlinearity can be tracked optically even when quantitative stress comparison across geometries is not feasible.
In the Rheo-PI experiment, the incident light propagated along the velocity-gradient direction, perpendicular to the shear plane. The measurement thus probed the path-averaged optical anisotropy in the flow – vorticity plane. Nevertheless, the heterogeneous flow behavior could be accessed.
Rheo-SAXS measurements were performed to discuss the microscopic molecular-level changes caused by a larger deformation. Figure 6 shows the SAXS image obtained during strain-amplitude sweep measurements. The SAXS profiles were virtually identical to those of the uncrosslinked tetra-PEG solution (dashed line) within the accessible q-range and experimental sensitivity. This suggests that there was no excess scattering in the SAXS range. These results confirm that the characteristic length scales and morphological form factors were unchanged under strain-amplitude sweep measurements, and no shear-induced structural differences were observed. It should be noted that owing to the X-ray beam propagating along the velocity-gradient axis, scattering pattern results sampled material properties only in the flow – velocity-gradient plane, leading to anisotropic scattering patterns due to network strand deformation toward the flow direction under macroscopic deformation. In contrast, the experimental results remained unchanged, exhibiting similar behavior to reported tensile SANS measurements of Tetra-PEG gels [54]. These SAXS and PI results suggest that while the orientational anisotropy appeared larger than the submicron order, the nanostructure of the network remained essentially unaltered. It should be noted that the weak submicron-scale chain orientation detected by birefringence is not expected to generate detectable anisotropy in SAXS, as SAXS probes nanometer-scale electron-density contrast, and the polymer concentrations in our samples were too low for such small deformations to be observed. Figure 6.(Left) Rheo-SAXS images of Tetra-PEG slime under various shear strain amplitudes (γ0). (right) SAXS intensity (I) as a function of scattering vector (q). The sample was the Tetra-PEG slime with Mw = 20 kg mol^−1^ and c = 60 g L^−1^. The dashed line represents the SAXS intensity of the sample in the uncrosslinked state.
Thus far, it has been demonstrated that the onset of nonlinear behavior under strain-amplitude sweep is not governed by microscopic structure formation or the emergence of flow heterogeneity. We thus investigated how the onset of the nonlinear response varied with changes in the network structure to gain further insight into its origin. Figure 7 presents the shear stress amplitude (σ0) as a function of the shear strain amplitude (γ0) under strain-amplitude sweep measurements for Tetra-PEG slimes with various molecular weights (Mw = 10, 20, and 40 kg mol^−1^) and polymer concentrations (c = 40–100 g L^−1^). The σ0 was proportional to γ0 in the linear regime, but eventually dropped when γ exceeded the upper limit γc. Further, σ0 increased with both increasing polymer concentration and decreasing molecular weight, that is, with increasing molar concentrations of the precursors. At low concentrations, slimes with a molecular weight of 10 kg mol^−1^ exhibited nonlinear behavior at smaller strain amplitudes compared to those with molecular weights of 20 and 40 kg mol^−1^. Figure 7.Dependence of the shear stress (σ0) on shear strain amplitude (γ0) for Tetra-PEG slimes (i: Mw = 10 kg mol^−1^, ii: Mw = 20 kg mol^−1^, and iii: Mw = 40 kg mol^−1^) with various polymer concentrations, as shown in the legend. The dashed line shows the line-fitting of σ0 in the linear regime.
We define the critical strain (γc) and stress (σc) amplitude as the linear response between σ0 and γ0. Figure 8 represents the values of γc and σc as a function of polymer concentration for each molecular weight (10, 20, and 40 kg mol^−1^). The γc values for the Tetra-PEG slimes with molecular weights of 20 and 40 kg mol^−1^ slightly decreased with increasing c, indicating that dense networks show strong nonlinearity at smaller strains. In contrast, for the Tetra-PEG slimes with a molecular weight of 10 kg mol^−1^, the γc exhibited an increase in γc with c. Meanwhile σc increased with c for all samples. Tetra-PEG slimes with molecular weights of 20 and 40 kg mol^−1^ showed similar absolute values, whereas the 10 kg mol^−1^ samples exhibited slightly lower values. All samples did not show a clear power law. Figure 8.γc (a) and σc (b) against polymer concentration (c). The colors represent molecular weights (red: 40 kg mol^−1^, green: 20 kg mol^−1^, and blue: 10 kg mol^−1^).
Previous studies on various soft materials have shown that the critical strain amplitude γc can be relatively insensitive to polymer concentration, whereas the corresponding characteristic stress exhibits clear polymer concentration dependence. These observations support the view that the onset of nonlinearity is primarily governed by short-range interparticle interactions rather than changes in the internal network elasticity [55–57]. However, our results do not conform to either of these scaling behaviors: neither a concentration-independent γc nor a clear σc ∝ c^2^ relationship was observed. This deviation indicates that the nonlinear response of the Tetra-PEG slimes originates from a distinct mechanism.
For further discussion, we investigated the maximum cycle-integrated elastic contribution per network strand at the critical strain (Wc,0). According to the elastic theory [58,59], Wc,0 can be expressed as
Figure 9 presents the relationship between Wc,0 and the maximum value of the Weissenberg number (Wi_max_), which is the shear strain rate normalized by the terminal relaxation time, obtained via strain-amplitude sweep measurements [44]. Here, the applied strain was expressed as γ = γ0_sin (ωt). Wi_max is expressed as
Figure 9.Maximum cycle-integrated elastic contribution per network strand at the critical strain (Wc,0) against Weissenberg number (Wi_max_). The colors represent molecular weight (red: 40 kg mol^−1^, green: 20 kg mol^−1^, and blue: 10 kg mol^−1^), and the symbols represent the frequency (circle: 10 rad s^−1^, square: 1 rad s^−1^, 0.1 rad s^−1^).
where τ represents the terminal relaxation time obtained from the SAOS measurements. The data for all the Tetra-PEG slimes approximately collapsed onto a master curve showing the relationship Wc,0 ∝ Wi_max_^2^, which indicates that the elastic contribution per network strand at the onset of nonlinearity was governed by the balance between deformation and relaxation, as captured by the Weissenberg number. Because both ΔG and τ differed among samples, normalization against Wc,0 (energy per strand) and Wi_max_ was required to allow meaningful comparison of the onset strain across compositions.
It should be noted that both Wc,0 and Wi_max_ depend on the linear viscoelastic parameters ΔG and τ. In Eq. (4), the storage modulus G'c at the strain amplitude sweep frequency can be expressed using a Maxwell-type description. In Eq. (5), the terminal relaxation time τ was introduced directly through Wi_max_ = γc ωτ. Remarkably, the exponent, that is, the fitted slope, is close to 2 (although some scatter remains), coinciding with the σc ∝ c^2^ relationship reported for cellulose fiber dispersions.
However, we interpret this scaling only as an empirical trend, and note that this comparison is intended only to highlight a similarity in the scaling exponent, not to imply any microscopic or mechanistic correspondence between transient networks and fiber dispersions. Here, both the per-strand energy and Wi_max_ should be viewed as empirical normalization parameters to organize the onset data, not as full descriptors of the nonlinear elastic response. Taken together, these observations indicate that nonlinearity emerges when the elastic contribution per strand reaches a characteristic scale, without implying a universal mechanism or a direct correspondence with fiber-network yielding.
Conclusion
We investigated the effects of network structure on the nonlinear behavior of a model transient network (Tetra-PEG slime) under strain-amplitude sweep measurements. The key findings are summarized as follows: (1) strain-amplitude sweep measurements revealed a distinct transition from linear to nonlinear behavior, accompanied by a reduction in modulus and deviation from proportionality between stress and strain; (2) Rheo-PI confirmed that the Tetra-PEG slime deformed homogeneously in the linear regime, while fracture-like disturbances appeared at its edges under nonlinear conditions; (3) Rheo-SAXS measurements showed no emergence of structural changes at the length scale detectable by SAXS, even in the nonlinear regime; and (4) elastic contribution per network strand at the critical strain collapsed onto a single master curve when plotted against the Weissenberg number, following Wc,0 ∝ Wi_max_^2^. This scaling suggests that the onset of nonlinear behavior is governed by the balance between molecular relaxation and applied deformation, and that nonlinear behavior occurred when the elastic contribution per strand reached a critical threshold determined by short-range strand – strand interactions.
These findings help establish a quantitative framework for understanding nonlinear viscoelasticity in transient networks and provide new insights into the molecular origins of nonlinearity in soft matter.
Supplementary Material
Supplemental Material
The reference list from the paper itself. Each links out to its DOI / PubMed record.
- 1Shikata T, Hirata H, Kotaka T. Micelle formation of detergent molecules in aqueous media. 3. Viscoelastic properties of aqueous cetyltrimethylammonium bromide-salicylic acid solutions. Langmuir. 1989;5(2):398–13. doi: 10.1021/la 00086 a 020 · doi ↗
- 2Shikata T, Hirata H, Kotaka T. Micelle formation of detergent molecules in aqueous media: viscoelastic properties of aqueous cetyltrimethylammonium bromide solutions. Langmuir. 1987;3(6):1081–1086. doi: 10.1021/la 00078 a 035 · doi ↗
- 3Shikata T, Hirata H, Kotaka T. Micelle formation of detergent molecules in aqueous media. 2. Role of free salicylate ions on viscoelastic properties of aqueous cetyltrimethylammonium bromide-sodium salicylate solutions. Langmuir. 1988;4(2):354–359. doi: 10.1021/la 00080 a 019 · doi ↗
- 4Cates ME, Candau SJ. Statics and dynamics of worm-like surfactant micelles. J Phys Condens Matter. 1990;2(33):6869–6892. doi: 10.1088/0953-8984/2/33/001 · doi ↗
- 5Annable T, Buscall R, Ettelaie R. Network formation and its consequences for the physical behaviour of associating polymers in solution. Colloids Surf A Physicochem Eng Asp. 1996;112(2–3):97–116. doi: 10.1016/0927-7757(96)03621-7 · doi ↗
- 6Annable T, Buscall R, Ettelaie R, et al. The rheology of solutions of associating polymers: comparison of experimental behavior with transient network theory. J Rheology. 1993;37(4):695–726. doi: 10.1122/1.550391 · doi ↗
- 7Inoue T, Osaki K. Rheological properties of poly(vinyl alcohol)/sodium borate aqueous solutions. Rheol Acta. 1993;32(6):550–555. doi: 10.1007/BF 00369071 · doi ↗
- 8Narita T, Mayumi K, Ducouret G, et al. Viscoelastic properties of poly(vinyl alcohol) hydrogels having permanent and transient cross-links studied by microrheology, classical rheometry, and dynamic light scattering. Macromolecules. 2013;46(10):4174–4183. doi: 10.1021/ma 400600 f · doi ↗