Defining exposure for estimating the global burden of alcohol consumption: plausibility testing of WHO methodology using ASEAN countries as a case study
Jürgen Rehm, Gianna Gayle H. Amul, Sawitri Assanangkornchai, Surasak Chaiyasong, Daniela Correia, Noran N. Hairi, Enjeline Hanafi, Ahmed S. Hassan, Kyaw Ko Ko Htet, Wah Yun Low, John Robert C. Medina, Jiraluck Nontarak, Sok King Ong, Pol Rovira, Kristiana Siste

TL;DR
This study examines potential biases in WHO's alcohol consumption estimates using data from ASEAN countries and finds implausible values in some regions.
Contribution
The study identifies and analyzes potential biases in WHO's alcohol exposure methodology using ASEAN countries as a case study.
Findings
ASEAN countries Lao PDR, Thailand, and Vietnam showed implausibly high alcohol consumption values.
Thailand's bias may stem from survey responses about alcohol abstention.
Similar but smaller implausible values were found in the EU.
Abstract
Comparative risk assessments (CRAs) provide important information for shaping alcohol control policies. Underlying their CRAs, the WHO uses a standardised methodology to assess and detail the levels of alcohol use for all countries and for various regions. This publication uses a case study approach on the member states of the Association of South East Asian Nations (ASEAN) to examine potential biases resulting from the methodology employed by the WHO in calculating exposure values for their CRAs. Researchers from each of the 10 ASEAN member states identified large population surveys to improve upon the data collected by the WHO monitoring systems to estimate exposure between 2000 and 2022. From these surveys and aggregate data, key indicators were created for each Member State using WHO standardised methodology. Steps were defined to test for implausible values, particularly for the…
Genes, proteins, chemicals, diseases, species, mutations and cell lines named across the full text — each resolved to its canonical identifier and authoritative record.
Click any figure to enlarge with its caption.
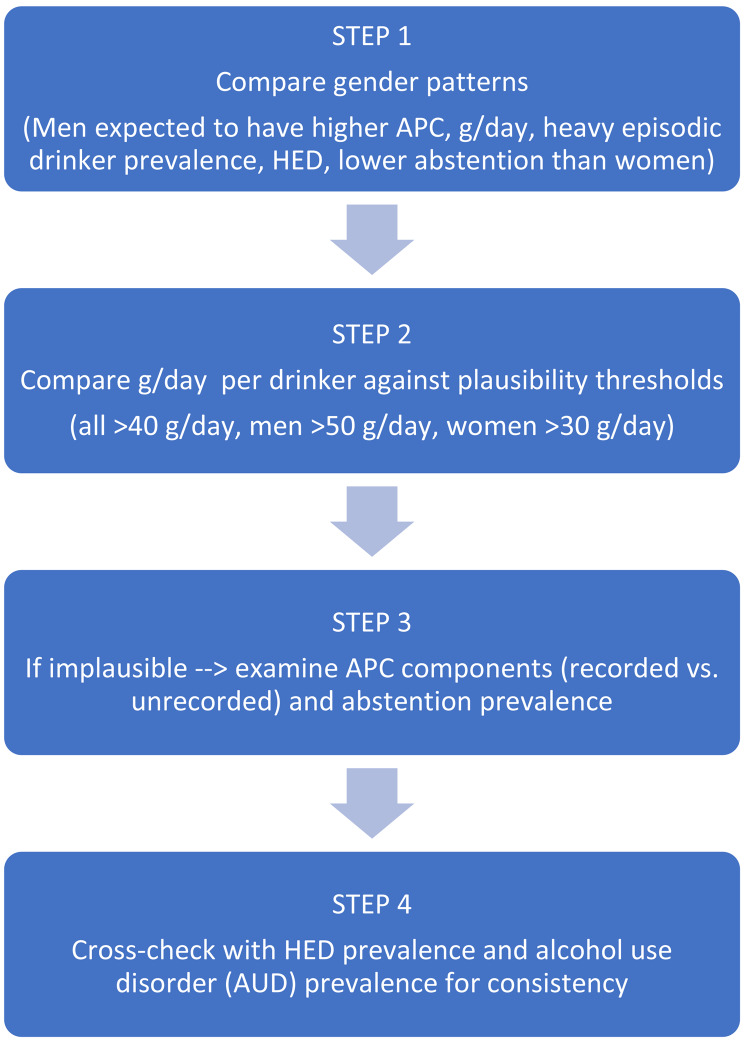 Figure 1
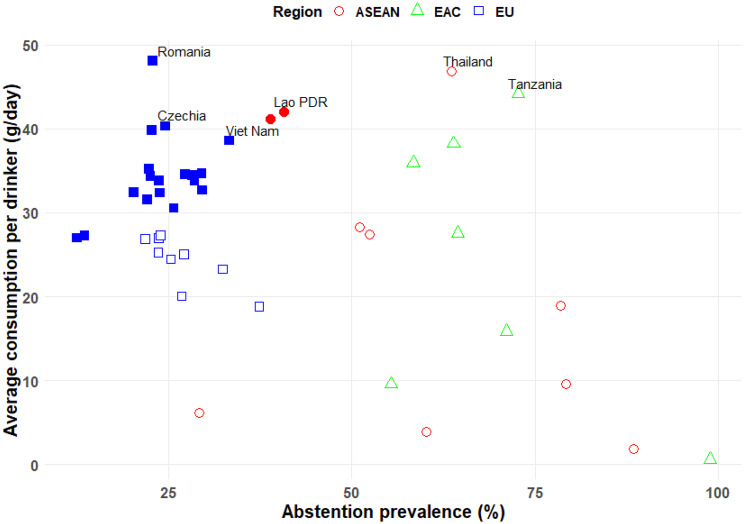 Figure 2
Peer Reviews
No public reviews on file for this paper yet. If you reviewed it on a platform where reviews are public (OpenReview, ICLR, NeurIPS, ICML), you can paste yours below so the community can read it here.
Videos
No videos yet. Explain this paper in a talk, walkthrough, or lecture? Add one.
Taxonomy
TopicsSubstance Abuse Treatment and Outcomes · Alcohol Consumption and Health Effects · HIV, Drug Use, Sexual Risk
Background
In comparative risk assessments (CRAs), alcohol consumption has been consistently identified by both the Global Burden of Disease (GBD) studies (latest iterations: [1, 2]) and by the World Health Organization (WHO) (latest iteration: [3]) as a major risk factor for global burden of disease and injuries (for a review of earlier iterations, see [4]). However, the underlying methodology between the two traditions varies considerably (for comparisons, see [5, 6]. While both groups use an attributable-fraction framework in the tradition of Levin ([7]; for principles [8]), exposure is defined differently.
GBD uses one dimension—high alcohol consumption—defined as alcohol consumption in excess of an age and regionally dependent theoretical minimum risk exposure level, i.e., the level of alcohol consumption at which all-cause risk of disability adjusted life years lost (DALYs) is minimised [1, 2]. The values for alcohol consumption are derived from surveys. The WHO approach includes two dimensions, average level of consumption and patterns of drinking, the latter operationalised by prevalence of people with heavy drinking occasions [3], compared to lifetime abstention as the theoretical minimum [9]. For the overall population level, the aggregate indicator of adult alcohol per capita consumption (APC) is used, mainly based on recorded consumption—obtained from administrative data such as taxation records, or production, import, and export statistics of alcoholic beverages [10, 11]. Surveys are subsequently used to distribute the aggregate value by sex and age (for principles, see [12, 13]). As surveys underestimate real consumption in most cases (so-called “under-coverage” [14]), triangulation between APC and survey results will lead to an upshifting of survey consumption levels among drinkers, as information about abstainers (combined current and lifetime) is held constant [13]. Both approaches come to different conclusions regarding alcohol consumption and key outcomes (e.g., deaths estimated by [2] vs. [3] for the year 2019, the last year with estimates from both systems: 1.8 million vs. 2.6 million deaths, respectively). Thus, it seems necessary to examine the validity of the underlying methodologies used, and the overarching objective of this publication is to examine the methodology used by the WHO. As we cannot examine this globally, i.e., for all countries, it will be done in depth for just one region, the member states of the Association of South East Asian Nations (ASEAN [15]). This region was selected as it has high variability on economic development, level and patterns of alcohol consumption, and relevant cultural factors such as religion or alcohol policy [16]. An ongoing project on alcohol, alcohol control policy, economic development, and health in ASEAN countries provided the database and the expertise to examine the methodology used by the WHO to identify exposure [17]. This project includes representatives from each ASEAN Member State, which has enabled the collection of additional surveys from the 10 ASEAN countries. These surveys were also transmitted to WHO and were integrated into the next update of the WHO's monitoring system ([18]; for underlying methodology, see [19]). These efforts complemented the routine data collection conducted by country focal points [10]. To increase variability of countries even more, we added two comparison regions based on economic wealth, level and patterns of drinking, and cultural factors that affect alcohol consumption. For inclusion of the two additional regions, we relied on routine data collected by WHO only. What dimensions and variables will be crucial in this examination? Based on the literature, surveys introduce more potential biases than aggregate consumption figures [20, 21], especially, if aggregate consumption is mainly based on recorded consumption. While the problem of under-coverage may be mitigated by triangulation and upshifting, other problems arise from the stigmatisation of alcohol consumption in certain populations. This may lead survey respondents to claim abstinence to avoid admitting to consuming alcohol within populations or countries where there is a strong cultural norm of not consuming alcohol, such as in Muslim-majority countries (Brunei, Indonesia, Malaysia) [22, 23], where such an admission could lead to stigma and social embarrassment [24, 25]. If the prevalence of abstention is overestimated when using the WHO methodology, the level of alcohol consumption among drinkers will be overestimated, and alcohol-attributable harm may also be overestimated. Thus, checking the indicator of level of drinking per drinker can be considered one of the routine checks necessary to assess for potential bias. Based on the above considerations, this study aims to:
- Based on WHO methodology to conduct CRAs for alcohol [3, 19], present key indicators of alcohol exposure for the 10 ASEAN countries for 2022 for the whole adult population and disaggregated by sex.
- Critically examine the plausibility of these indicators, particularly the indicators measuring the level of drinking in people who consume alcohol, and discuss any reasons to question their validity.
- Compare the results with those from two political and economic unions with differing wealth levels and drinking patterns: the European Union (EU) representing, with one exception, high-income countries (Table A1 in Appendix 1; gender-specific results in Table A2), and the East African Community (EAC), comprised of mainly low-income countries (Table A3 in Appendix 1; gender-specific results in Table A4).
Methods
Data sources
The year 2022 was the most recent year for which complete data were available. Economic data for each country were obtained from the World Bank (WB), including the gross domestic product per capita at purchasing power parity (GDP PPP per capita) in current international dollars [26] and the WB's income-level country classification [27]. All alcohol exposure-related data were obtained from the WHO [18] or calculated using WHO methodology: annual APC without tourist consumption, which is not relevant for the considerations here, as it did not exceed +/-0.2 litres for any of the ASEAN countries (Appendix 2); prevalence of abstention (i.e., people who have not consumed at least one standard drink of alcohol in the past 12 months); and prevalence of heavy episodic drinking (HED). To calculate APC per drinker in grams per day (g/day), an alcohol specific weight of 0.793 g/ml was used [28]. All indicator definitions follow WHO standards by excluding those under 15 years of age; HED is defined by consuming at least 60 g of pure alcohol on a single occasion in the past month [10]. This definition for HED was chosen by WHO to facilitate the estimation of alcohol-attributable burden for injuries and ischaemic diseases, which have been shown to be more related to HED than to the average level of alcohol consumption ([29, 30]; see exact WHO definitions of all indicators in [18]).
Plausibility checks within countries
A summary of this stepwise plausibility checking process is given in Fig. 1. First, we explored whether, when compared to women, men consistently show higher values for APC, average daily drinking level among drinkers, and prevalence of HED among drinkers, and lower values for abstainers [31, 32]. While the sex gap is narrowing in some populations [33], these patterns generally reflect traditional drinking behaviours, which prevail in ASEAN countries.Fig. 1. Plausibility check process for alcohol consumption estimates
Second, as indicated above, the key measure for the plausibility checks is the average level of alcohol consumption per drinker. We routinely inspected all values above 40 grams of pure alcohol/day of this indicator for both genders combined, and above 30 and 50 grams of pure alcohol/day among women and men, respectively. The rationale is that, in ASEAN countries, daily or almost-daily alcohol consumption seems relatively rare in the general population; the drinking patterns tend to be intermittent, with occasional heavy drinking occasions, even in higher-consumption countries like the Lao People’s Democratic Republic (Lao PDR), Thailand, or Viet Nam [34–36]. In all three countries, on average people with alcohol consumption tend to drink between every second and every seventh day (e.g., Lao PDR 2020: 47 days/year [34]; Thailand 2012/13: 128 days/year [34]; Thailand 2021: 92 days/year [37]; Viet Nam 2014: 158 days/year [34]; Viet Nam 2014/15: 87 days/year [35]).
Therefore, average daily consumption levels exceeding these thresholds would imply very high amounts consumed per occasion—up to levels that are considered biologically improbable and have not been observed in surveys or any other research.
To help explain this unusually high level of average consumption per drinker at the national level, we examined the validity of the constituent parts of the indicator, i.e., APC, including both recorded and unrecorded consumption, the latter denoting any consumption of alcohol not registered in the country in which it is consumed [38], and prevalence of abstention. In addition, we evaluated the plausibility of these values by comparing them against the prevalence of HED among drinkers and the prevalence of alcohol use disorders (AUD).
Simulations
To explore whether high values of drinking per drinking day among people who consume alcohol could be explained by small subgroups drinking very heavily, such as people with AUD [39–41], we conducted simulations. According to WHO [3] and GBD [42] estimates, the yearly prevalence of AUD in the three countries identified with values above the threshold was between 1 and 17% for the most recent years available (see Table A5 in Appendix 1 for details and confidence intervals). In addition, from recent surveys conducted in these three countries, the following values for 1-year prevalence of AUD were reported: Lao PDR (capital province): 7.5% for 2015 [43]; Thailand; 5.3% and 2.3% for 2013 and 2023, respectively [44, 45]. Based on these data, we simulated the level of use for those who consume alcohol—both with and without AUD—for three prevalences: 3%, 5%, and 10%, assuming either 100 g/day or 150 g/day for people with AUD. The average level of drinking for people with AUD was derived from the NESARC studies [39]; studies in the ASEAN countries indicate that these numbers may be too high for people with AUD in this region [45].
Comparisons to other regions
For comparison, we present the same indicators for two regions with contrasting wealth levels and drinking patterns: the EU, a region composed mainly of high-income countries and very high levels of alcohol consumption [46] (see also Tables A1 and A2 in Appendix 1); and the EAC, a region composed mainly of low-income countries with low overall alcohol consumption but a high proportion of unrecorded consumption (for measurement of unrecorded and the link to wealth of countries, see [47]; see also Tables A3 and A4 in Appendix 1).
Results
Surveys identified
Appendix 3 lists the surveys identified and entered into the WHO monitoring framework (for methodology used, see [19]). A total of 96 key surveys were identified.
Key indicators and plausibility checks
The resulting key indicators for the 10 ASEAN countries are presented in Tables 1 and 2. Across all indicators for all countries, the predicted gaps between men and women were observed.Table 1. Economic and alcohol exposure indicators for ASEAN member states, 2022CountryGDP PPP per capitaWorld Bank income groupAdult per capita consumption (litres)Percentage of unrecordedPercentage of abstainersAverage consumption per day per drinker (g/day)Prevalence of heavy episodic drinkers among drinkersBrunei Darussalam81,802High0.7125%60%3.8534%Indonesia14,285Upper-Middle0.1028%88%1.8332%Cambodia6,919Lower-Middle6.3712%51%28.3240%Lao People’s Democratic Republic8,766Lower-Middle11.4733%41%42.0650%Myanmar5,732Lower-Middle1.879%79%18.8944%Malaysia34,366Upper-Middle0.9218%79%9.6440%Philippines10,131Lower-Middle6.0119%52%27.4637%Singapore143,095High2.008%29%6.1433%Thailand22,243Upper-Middle7.8615%64%46.8849%Viet Nam13,905Lower-Middle11.5568%39%41.1050%**Population-weighted mean15,582-**4.08***28%***69%29.0143%**Legend: GDP per capita, PPP, is given in current international $; WB: World Bank; APC: adult alcohol per capita consumption in litres pure alcohol; Average level per day for drinkers is measured in grams pure alcohol; HED: heavy episodic drinkingEstimated by WHO methodology; the STEPS survey gives higher percentageGrey-highlighted cells indicate values above the thresholds of 50 g/day and 30 g/day for men and women, respectively
All three Muslim-majority countries were well below the threshold of average alcohol consumption per drinker. However, three other ASEAN member states exceeded both the pre-defined thresholds for men and women combined and for men alone: Lao PDR, Thailand, and Viet Nam (Tables 1 and 2). We will first consider Thailand, which had the highest value for both genders combined (almost 47 g/day) and for men (almost 60 g/day, or six drinks per day, assuming a standard drink size of 10 g).Table 2. Economic and alcohol exposure indicators for ASEAN member states by gender, 2022CountryGenderAdult per capita consumption (litres)Percentage of abstainersAverage consumption per day for drinkers (g/day)Prevalence of heavy episodic drinkers among drinkersBrunei DarussalamMen1.1849%5.0235%Women0.3070%2.1432%IndonesiaMen0.1784%2.2234%Women0.0393%0.8524%CambodiaMen9.9541%36.7544%Women2.4962%14.2233%Lao People’s Democratic RepublicMen18.2431%57.7356%Women4.6950%20.4542%MyanmarMen3.1470%23.0948%Women0.5787%9.2835%MalaysiaMen1.6171%12.0744%Women0.3087%4.9033%PhilippinesMen9.5342%35.9241%Women2.4163%14.0631%SingaporeMen3.0922%8.6345%Women0.9936%3.3318%ThailandMen12.8753%59.1854%Women2.5075%21.8539%Viet NamMen18.0530%55.7856%Women4.5649%19.4141%**Population-weighted mean**Men6.6161%37.2847%Population-weighted meanWomen1.5078%14.5335%**Legend: APC: adult alcohol per capita consumption in litres pure alcohol; Average level per day for drinkers is measured in grams pure alcohol; HED: heavy episodic drinking*Estimated by WHO methodology; the STEPS survey gives higher percentageGrey-highlighted cells indicate values above the threshold of 40 g/day
This average level of alcohol consumption among drinkers seems biased in Thailand. If the indicator was unbiased, it would imply that Thai men consuming alcohol have a heavy drinking occasion, as defined by the WHO, almost every day.
In reality, Thai men consuming alcohol, based on a large general population survey conducted in 2021 [48], drank on average twice per week (104 days/year [34, 37]). This would mean that their average drinking per occasion (i.e., drinking day) would represent a very high level, at around 21 drinks for every heavy drinking occasion. Such average high levels of drinking per occasion in Thai men, however, have not been reported in any population survey from Thailand.
For both genders combined, the numbers would be as follows: average level of drinking per person drinking: 47 g/day (Table 1); average consumption per drinking day based on 92 days/year (or about every fourth day) [37]: about 19 drinks on average per Thai drinker.
Simulations
Table 3 gives an overview of the results of the simulation modelling. Overall, the simulations indicate that it would take the more extreme scenarios—i.e., 10% of the general population with AUD and on average 150 g/day combined with at least 183 drinking occasions—to produce numbers that may be considered plausible (see green-highlighted cells in Table 3). However, even under these somewhat unrealistic conditions, the numbers could still be considered to be somewhat on the high side. In other words, we would consider the values of the average level of drinking indicator to still be biased for all three countries.Table 3A comparison between the available data and simulated estimates on drinking per drinking day, 2022Data from WHOSimulated estimates based on the available dataTotal alcohol per capita% unrecorded% abstainer/% drinker last 12 monthsAverage consumption per day for drinkers in g/dayPrevalence of AUD in general populationDrinking for drinkers with AUD in g/dayDrinking for drinkers without AUD in g/dayDrinking per drinking day in grams − 183 daysDrinking per drinking day in grams − 122 daysLao PDR11.473341/5942.13%10039781173%15036731095%10037731105%15032649610%10030619110%150204060Thailand7.861564/3646.93%10042841263%15038751135%10038771155%15030619110%10026537910%15071422Viet Nam11.556839/6141.13%10038761143%15035711065%10036721085%15031639410%10030598910%150203959
Examining underlying indicators
Given this likely bias, we examined the indicator’s constituents. Thailand’s APC is above the global average, but markedly lower than the APC in Lao PDR or Viet Nam. Most of the APC in Thailand is recorded consumption, which is arguably the most reliable part of APC as the data are derived from the taxation system [11, 20]. Thus, the prevalence of abstainers is most likely overestimated in Thai surveys, and is presumably the main source of bias in the indicator for average level of consumption for drinkers. In 2022, the WHO estimated 64% abstainers, 53% among men, and 75% among women (Table 2). However, all major surveys in the past years from Thailand show even higher abstention rates, most often more than 70% [49], indicating that via the WHO methodology, the survey abstainer values were already been corrected downwards by other predictors of the estimation used [19].
For the Lao PDR and Viet Nam, the average alcohol consumption per drinker is similar to that in Thailand (Tables 1 and 2), and the same overall considerations apply. The simulation study also shows similar results, suggesting that the indicators for both Lao PDR and Viet Nam are likely biased upwards, albeit less so than for Thailand. The differences between the three countries are mainly explained by the overall higher APC in the Lao PDR and Viet Nam.
Regarding the constituents, in both the Lao PDR and even more so in Viet Nam, the proportion of unrecorded alcohol constitutes a large share of total consumption, 33% in the Lao PDR and 68% in Viet Nam. These values, mainly derived from the regularly conducted WHO STEPS Surveys [50] (Lao PDR: 2008, 2013, 2020; Viet Nam: 2009, 2015, 2021), are consistent with other survey data (Appendix 3). The STEPS Survey globally is the standard tool for assessing unrecorded consumption [51]. Overall, both the unrecorded estimates and the abstainer prevalence are based on survey data, and both survey questions could be considered to be asking about potentially stigmatised behaviour, so it is harder to decide where we suspect the source of the bias for the Lao PDR and Viet Nam to emanate from, compared to Thailand.
Comparisons to other regions
Three out of 10 ASEAN member states had values for the indicator of average level of alcohol consumption among drinkers that looked potentially biased. What is the situation in the two comparison regions? In the EU, which has 27 member states, there are two countries which surpass the thresholds for both genders: Romania and Czechia (Table A1 in Appendix 1). Both countries fall within the 10 countries globally that have the highest APC: Romania with the highest APC globally, and Czechia ranked as 6^th^. Both countries also have APC values which are at least 20% higher than the highest APC of the ASEAN member states (Romania 48% higher; Czechia 21% higher). Thus, being above the threshold for the level of alcohol consumption among drinkers of 40 g/day in a country like Romania, where the average drinking level among the general population is already 37 g/day (equivalent to 17 l APC), is not implausible (for a graphical representation, see Fig. 2).Fig. 2. Scatterplot of prevalence of 12-month abstention with average level of alcohol consumption among drinkers
Overall, as indicated above, the EU is the region with the highest level of alcohol consumption globally. Given this very high level of drinking, the values for the indicator seem less problematic, including for Czechia, which barely exceeded the threshold. With respect to gender-specific values, the following countries surpassed the threshold for men (Table A2 in Appendix 1 ): Bulgaria, Czechia, Latvia, and Romania, with the following ranks regarding APC (12^th^, 6^th^, 5^th^ and 1^st^, respectively). They are also all in the Eastern part of the EU, characterised by larger differences in drinking levels between women and men.
In sum, while the values for the indicators for the level of alcohol consumption among drinkers pass the threshold set a priori, we cannot exclude the possibility that these values are actually unbiased, given the high overall levels of drinking within the EU.
As for the EAC, there is only one country with levels above the thresholds for both genders and for men (but not for women): Tanzania. Out of all the countries with thresholds set for the indicator average level of drinking among drinkers, the APC of Tanzania is the lowest, at 5.5 l pure alcohol. Approximately 73% of Tanzanian adults are abstainers, in part for religious reasons, as more than one third of the inhabitants of Tanzania are Muslim [52]. As indicated above, this may be one of the reasons for the low value. Another potential reason is the relatively high proportion of unrecorded consumption, which may be overestimated (48%; see Table A3 in Appendix 1 ). The last STEPS survey showed lower proportions of unrecorded consumption and higher rates of abstention [53]. Finally, no part of APC is based on administrative data such as taxation, but rather is estimated from food balance sheets produced by the Food and Agriculture Organization of the United Nations (FAO), which is considered to be potentially much more biased that the former sources [10].
The association between prevalence of abstention and level of alcohol consumption among drinkers in different regions is further illustrated in Fig. 2, which shows a scatterplot of abstention prevalence versus g/day per drinker for ASEAN, EU, and EAC countries, highlighting how a reported low prevalence of current drinking can inflate the per-drinker consumption estimate, especially in countries with an overall lower APC.
Discussion
The WHO current methodology for estimating alcohol exposure in CRAs was tested for plausibility across all ASEAN member states using the latest available indicators. It was found that the indicator on average volume of alcohol consumption among people who consume alcohol showed implausibly high values for three countries. Further simulations based on assumptions regarding the prevalence of people with heavy or very heavy drinking levels further corroborated a likely bias in these values. An examination of its constituents revealed that the problem for Thailand is likely based on survey answers to the question on alcohol abstention, in which a high number of respondents claimed no consumption of alcohol during the past 12 months, but had likely consumed some alcohol during this time period. For the Lao PDR and Viet Nam, the same problem seems to exist, but we cannot exclude the possibility that survey answers to the question regarding unrecorded alcohol may also have contributed. Investigations of two other regions also showed some implausible values.
Before we discuss these findings further, we need to discuss potential limitations of our approach. First, the results of every empirical investigation are only as valid as the underlying empirical data. In our case, the data on alcohol exposure are based on different sources: administrative data, modelling, and surveys. While administrative data is considered to be the most reliable, alcohol sold in a jurisdiction is only an indirect indicator of exposure. Not all alcohol is consumed; there is some waste due to broken or leaky containers, containers not fully emptied, spillage, etc. This is why the Technical Advisory Group for Alcohol and Drug Epidemiology of WHO [54] recommends that only 80% of the total APC should be included in the WHO's burden estimates. It may be advisable to base the APC in the indicator on the average level of alcohol consumed among drinkers on this lower value. All modelling is based on assumptions, and the assumptions to derive APC from food balance sheets are manyfold, leading to relatively high variability of annual estimates by the FAO [55]. However, for many low- and lower-middle income countries in Africa, which are not considered big markets for industry, FAO estimates are the only source for APC data [3]. Finally, while great care was taken to identify all relevant surveys for the countries under investigation, there may still be some systematic errors stemming from surveys themselves, as they are based on self-report with incomplete survey frames [21, 56]. The problem is further complicated as there is a concentration of drinking, where a minority of the drinking population consumes the majority of the alcohol [57], and this minority is often not part of the sampling frame [58]. So, clearly, there is work to be done to explore and correct for the most important biases resulting from surveys.
In sum, the WHO methodology offers advantages for estimating alcohol exposure for CRAs, as it includes two relevant dimensions that have been shown to impact burden [30], and as it is anchored in the overall most reliable and valid indicator: APC [20]. However, care must be taken in the triangulation of this indicator with survey results, especially for the indicator of abstention. The reliability of this indicator seems to vary based on culture and stigmatisation of alcohol consumption. If abstention is markedly overestimated, this will in turn cause an overestimate of the number of people with very high alcohol consumption, potentially resulting in inflated burden estimates [59]. Finally, we used only one threshold value to detect potential problems in the indicator of average level of drinking among drinkers. This level may be too high for Muslim-majority countries, where overall drinking levels have been shown to be low in ASEAN countries. If only a few drinking occasions per year are reported, lower thresholds than 40 g/day should be used. However, the estimated levels of drinking for all three ASEAN Muslim countries were all below 10 g/day, so this consideration is not relevant for this region.
What are the implications of our results for GBD's work on alcohol [1, 60], which is entirely based on survey-derived alcohol estimates? First, the mechanism described, which may lead to claim normative drinking status—i.e., being an abstainer in a culture where abstention is the norm, or claiming to be a drinker in cultures where drinking is the norm—applies to the GBD methodology as well. Second, unique to GBD, their estimate will reflect the survey underestimation of real drinking levels described above. Real drinking levels denote the levels mainly defined based on sold and taxed alcohol [10, 11, 15]. In sum, the GBD methodology will suffer more biases than the WHO methodology and will result in an underestimate of consumption and attributable harm. It has been argued that the risk estimates for disease and mortality outcomes are also based on self-reports and thus underestimated alcohol consumption. However, clinical and other cohorts and the instruments used in such studies have been shown to underestimate the level of consumption less than general population surveys on alcohol ([61]; for a review [62]), and the underestimation of population level is not only caused by the sum of individual underestimation, but also by insufficient sampling frames, leaving out the heavy and very heavy consumers [21, 58] who are responsible for the majority of all alcohol consumed [57]. Thus, the current WHO methodology based on triangulation seems to be the better methodology [62].
What can be done to reduce the potential bias detected in this study? Take Thailand again as an example. The large surveys in this country all show high rates of abstention, often over 70% [49], which seems to be implausible, given the country’s APC. Future research should look into the methodology used in these surveys, and perform cognitive interviews to improve the questions on abstention [63]. It could be that despite the fact that the Thai form of Buddhism does not seem to hinder heavy drinking, there may still be some implicit norms acting and impacting on respondents’ answers. For example, when modern community campaigns reinforced traditional values during the Buddhist Lent period, consumption decreased during these months [64]. Alternatively, respondents may see drinking as something fairly common and acceptable and thus discount the occasional drinking of alcohol, still considering themselves to be abstainers. Only further research, such as performing cognitive interviews, will be able to answer these questions and improve future surveys.
In conclusion, methodological research, which continuously tests the assumptions of currently used monitoring systems such as the WHO monitoring system, is necessary if we want to base policy decisions on the best evidence available.
The reference list from the paper itself. Each links out to its DOI / PubMed record.
- 1GBD. Disease and injury and risk factor Collaborators. Burden of 375 diseases and injuries, risk-attributable burden of 88 risk factors, and healthy life expectancy in 204 countries and territories, including 660 subnational locations, 1990-2023. A systematic analysis for the global burden of Disease study 2023. Lancet. 2025;406(10513):1873–922.10.1016/S 0140-6736(25)01637-XPMC 1253584041092926 · doi ↗ · pubmed ↗
- 2GBD. Risk factors Collaborators. Global burden and strength of evidence for 88 risk factors in 204 countries and 811 subnational locations, 1990-2021. A systematic analysis for the global burden of Disease study 2021. Lancet. 2024;403(10440):2162–203.10.1016/S 0140-6736(24)00933-4PMC 1112020438762324 · doi ↗ · pubmed ↗
- 3World Health Organization. Global status report on alcohol and health and treatment of substance use disorders. 2024 [Available from: https://www.who.int/publications/i/item/9789240096745].. Geneva: WHO.
- 4Association of Southeast Asian Nations (ASEAN). 2025 [Available from: https://asean.org/. Home page Jakarta, Indonesia: The ASEAN Secretariat.
- 5World Health Organization. Global Information System on Alcohol and Health (GISAH). 2025 [Available from: https://www.who.int/data/gho/data/themes/global-information-system-on-alcohol-and-health Geneva, Switzerland: World Health Organization.
- 6Pew Research Center. Chart of the Week: Who really drinks the most? 2014 [Available from: https://www.pewresearch.org/short-reads/2014/05/16/chart-of-the-week-who-really-drinks-the-most/].. Washington, DC: Pew Research Center.
- 7World Bank Group. GDP per capita, PPP (current international $). 2025 [Available from: https://data.worldbank.org/indicator/NY.GDP.PCAP.PP.CD New York: World Bank Group.
- 8World Bank Group. World Bank Country and Lending Groups. 2025 [Available from: https://datahelpdesk.worldbank.org/knowledgebase/articles/906519-world-bank-country-and-lending-groups].. New York: World Bank Group.