Incarceration history and HIV testing among people who inject drugs in the Boston metro area: a pooled cross-sectional study
Benjamin J. Bovell-Ammon, Shauna Onofrey, Simeon D. Kimmel, Alysse G. Wurcel, R. Monina Klevens

TL;DR
This study finds that incarceration is common among people who inject drugs and is linked to higher rates of HIV testing, but more testing is needed to control the HIV epidemic.
Contribution
The study is the first to show how incarceration history is associated with increased HIV testing among people who inject drugs.
Findings
43.5% of participants reported incarceration in the past year, and 23.4% had their last HIV test in a jail or prison.
Past-year incarceration was associated with a 39% higher prevalence of HIV testing in the past year.
Incarceration prior to the past year was also linked to a 19% higher prevalence of recent HIV testing.
Abstract
The persistent incidence of HIV among people who inject drugs (PWID) underscores the urgency for HIV prevention efforts to end the HIV epidemic. Little is known about the role carceral settings play as touchpoints for HIV testing in this population. The objectives of this study were to characterize patterns and sources of HIV testing among PWID and to understand how carceral facilities fit into this population’s HIV testing landscape. Secondary analysis of cross-sectional survey data of PWID in the Boston metro area from the 2015 and 2018 cycles of the National HIV Behavioral Surveillance (NHBS). Among self-reported HIV-negative participants, we examined incarceration and HIV testing histories and used a multivariable modified Poisson regression model to evaluate the association between incarceration history (main exposure) and past-year HIV testing (primary outcome). Among 957…
Genes, proteins, chemicals, diseases, species, mutations and cell lines named across the full text — each resolved to its canonical identifier and authoritative record.
Click any figure to enlarge with its caption.
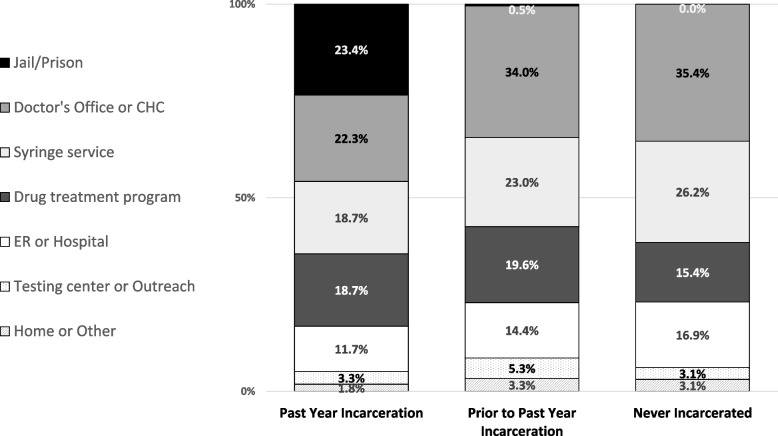 Figure 1
- —https://doi.org/10.13039/100000026National Institute on Drug Abuse
- —https://doi.org/10.13039/100000060National Institute of Allergy and Infectious Diseases
Peer Reviews
No public reviews on file for this paper yet. If you reviewed it on a platform where reviews are public (OpenReview, ICLR, NeurIPS, ICML), you can paste yours below so the community can read it here.
Videos
No videos yet. Explain this paper in a talk, walkthrough, or lecture? Add one.
Taxonomy
TopicsHIV, Drug Use, Sexual Risk · HIV/AIDS Research and Interventions · Criminal Justice and Corrections Analysis
Introduction
While the overall incidence of HIV in the United States (US) has decreased since 2015, the HIV incidence attributed to injection drug use is stable nationally [1, 2] and even increasing in some places [3, 4]. Alongside the rise in opioid use and use disorders in the US, the prevalence of injection drug use has also increased over the past decade to an estimated 3,700,000 (or 1.5% of US adults) in 2018 [2, 5–7]. Moreover, the increasing presence of fentanyl in illicit drug markets has intensified the risks of infectious complications faced by PWID who inject opioids (in addition to precipitating an unprecedented surge in overdose deaths since 2013) [8, 9]. Because of its shorter pharmacologic half-life, fentanyl is injected more frequently and may be associated with greater risk of sharing injection equipment [10, 11]. Several HIV outbreaks have occurred among people who inject drugs (PWID) [12–15], often associated with state, federal or local policies preventing access to harm reduction tools.
Considering their high risk for infection, HIV testing rates among PWID are often inadequate [16, 17]. HIV testing is a core pillar of the US Department of Health and Human Services’ Ending the HIV Epidemic campaign [18]. The US Centers for Disease Control and Prevention (CDC) recommends that PWID get HIV testing at least annually (more often depending on risk behaviors) [19], but in 2018, for example, only 57% of a national sample of PWID from metropolitan areas reported HIV testing within the past year [20]. HIV testing is an opportunity to diagnose the infection, educate about risk reduction, and deliver evidence-based prevention strategies such as pre-exposure prophylaxis, which is underutilized among PWID [21]. PWID face substance use, stigma, high rates of homelessness, and barriers to care—which shape the risk environment for HIV and access to harm reduction services [22–29].
Due to the criminalization of substance use, contact with the criminal-legal system, such as incarceration, continues to be highly prevalent among PWID [30], with one third of a national sample of PWID reporting past-year incarceration in 2018 [16]. A growing literature describes incarceration as a key social-structural determinant of health and health care [31–35], but its relationship with HIV testing utilization in this population has not been well-described. The CDC recommends that all carceral facilities provide voluntary, opt-out HIV testing [19, 36], but many facilities in the US do not provide this, especially jails and less urban jurisdictions [37–40]. On one hand, therefore, incarceration might be a point of contact for some PWID that increases access to testing (and other health services) [41]. On the other hand, incarceration directly disrupts engagement in health services, can lead to increased risk behavior after release, and deteriorates the resources (e.g. income, housing, social support) that are needed to facilitate access to care in the community [42–49]. Although testing should occur in carceral settings, the overlay of stigma, mistrust, lack of resources, low prioritization, and disjointed healthcare systems may prevent access to HIV testing in jails and prisons.
Thus, the objectives of this study were to use population-based survey data collected in the Boston metro area to characterize patterns and sources of HIV testing among PWID and to understand how carceral facilities fit into this population’s HIV testing landscape. With a statewide opioid use disorder (OUD) prevalence of approximately 5% [50], Massachusetts has high rates of opioid-related morbidity and mortality [9, 51–54] as well as increasing incidence of HIV attributable to injection drug use (5% in 2014 to 14% in 2020) [3, 4]. HIV outbreaks in this population in the northeastern part of the state [10, 12, 55] and in Boston highlight the need for improved HIV diagnosis and prevention among PWID [56–58]. Therefore, Massachusetts is a suitable setting to examine HIV testing among PWID and the association of incarceration history with HIV testing.
Methods
Data source and sample selection
We conducted a secondary analysis of a pooled dataset of cross-sectional studies conducted in the Boston area as part of the 2015 and 2018 PWID cycles of the National HIV Behavioral Surveillance (NHBS) system. A multisite project funded by the CDC, NHBS conducts rotating annual cycles of biobehavioral data collection from three specific populations with a high burden of HIV (people who inject drugs, men who have sex with men, and people with high-risk heterosexual behavior) in multiple major cities across the US (20 cities in 2015 and 23 cities in 2018). During PWID cycles, NHBS recruited eligible individuals in the community to participate in an interviewer-administered risk behavior survey and to take an HIV test. NHBS used a respondent-driven sampling (RDS) design, where researchers first recruit a limited number of ‘seed’ participants and then incentivize participants to recruit additional participants through their existing social networks (who in turn can recruit others as well), leading to distinct recruitment ‘chains,’ or clusters [59–61]. Eligibility criteria included being 18 years of age or older, a history of injection drug use within the past 12 months, and ability to complete the survey in either English or Spanish. Participation was anonymous and voluntary. NHBS obtained verbal informed consent before conducting the survey and the HIV test and offered financial incentives for completion of the survey, HIV test, and recruitment of additional participants, respectively. NHBS informed participants of their test results and (if indicated) referred them to treatment or other services, while maintaining their anonymity with respect to NHBS participation [62, 63]. At the Boston site, which was administered by the Massachusetts Department of Public Health (MADPH) with the support of the CDC, NHBS recruited PWID from a five-county sampling area that covered the Boston metropolitan area. Given that participation was anonymous, it is possible yet highly unlikely that the same individual(s) participated in both survey cycles (2015 and 2018), because the two cycles used different interview locations across the city and occurred 3 years apart.
For this secondary analysis of Boston-area NHBS data, we defined the study sample as those who were eligible for HIV testing within the 12 months prior to NHBS participation, which included the following: 1) participants who reported negative or unknown HIV status at the time of participation and 2) those who reported that they had first been diagnosed with HIV within the preceding 12 months (because these individuals were also eligible for HIV testing at some point within the past 12 months). In other words, we only excluded HIV-positive participants from our sample if they reported being diagnosed with HIV more than 12 months prior to participation.
This study was approved by the Institutional Review Board of the MADPH. Reporting in this study followed applicable Strengthening the Reporting of Observational Studies in Epidemiology (STROBE) guidelines for cross-sectional studies.
Measures
The main exposure of interest was incarceration history. Two linked NHBS questions gathered data about incarceration history: (1) "Have you ever been held in a detention center, jail, or prison for more than 24 h?" and, if so, they were then asked (2) whether this had occurred during the past 12 months. Notably, the survey questions did not differentiate between detention (i.e. brief jail stay while awaiting law enforcement or judicial proceedings) and incarceration (i.e. custodial sentence for a crime, served in a jail or prison), yet in this study we use the term "incarceration" to refer to any affirmative response to these survey questions. Based on these two questions, we categorized participants into three mutually exclusive levels of incarceration history: past-year incarceration (any history of incarceration within the past 12 months), incarceration prior to the past 12 months, and no incarceration history.
The primary outcome was self-reported HIV testing in the past 12 months (hereafter, past-year testing), which we analyzed using a regression analysis (described below). To complement the regression analysis, we used additional survey items for descriptive analyses of other aspects of participants' testing histories, including the following: whether they had received an HIV test while incarcerated in the past year; total number of HIV tests in the past 2 years; whether they had used a rapid home HIV test in the past year, and past-year testing for bacterial sexually transmitted infections (STIs; i.e. gonorrhea, chlamydia, or syphilis). Further, those who reported past-year HIV testing were asked about the location of their most recent HIV test, and those who reported no past-year HIV testing were asked the most important reason for not testing.
Statistical analysis
We used cross-tabulations to compare participant characteristics and various aspects of HIV testing history by incarceration history using χ^2^ test for categorical variables, ANOVA for the normally distributed continuous variable (age), and the nonparametric Kruskal–Wallis test for the non-normally distributed continuous variable (total number of HIV tests in past 2 years). We analyzed the association between the primary outcome, past-year HIV testing, and the main exposure, incarceration history, using modified Poisson regression models which accounted for the clustering of observations resulting from the RDS sampling design, i.e. correlations among participants within each recruitment chain [64, 65]. Our multivariable regression model adjusted for various self-reported demographic, social, behavioral, and clinical characteristics that we hypothesized a priori are related to risk of HIV acquisition or access to HIV testing: age, gender, race and ethnicity (provided by NHBS as a joint variable: Hispanic/Latino of any race, non-Hispanic Black, non-Hispanic White, or other), marital status, education, income, homelessness, sexual activity, injection frequency, receptive sharing of injection equipment (i.e. needles, cooker, cotton, or water), stimulant injection, binge drinking, drug treatment program participation, syringe service program utilization, usual source of medical care, NHBS round (2015 vs. 2018), and size of PWID social network (because of its relevance to RDS design effects). For the self-reported gender variable above, NHBS asked participants “Do you consider yourself to be male, female, or transgender?” and we used these three gender categories. We retained the transgender participants in the sample for all descriptive analyses, but we excluded them from the regression analysis due to small numbers (n = 6) that would not have allowed valid statistical inference. We also excluded participants from the regression analysis if they had missing values at one or more of the model variables (variables with missingness are indicated in Table 1). Taken together, these two criteria (transgender and missingness) excluded a total of 19 participants (2.0% of our total study sample) from the regression analysis. We included some additional descriptive variables in Table 1 which we did not use as covariates in the regression analysis for the sake of parsimony, avoiding collinearity, or other reasons: namely, employment (model already included income, education and homelessness as markers of socioeconomic status), insurance coverage (lack of heterogeneity and redundant as a marker of socioeconomic status), non-injection drug use (a priori not a predictor of HIV testing), and prior HCV diagnosis (overly correlated with HIV testing). We used SAS, version 9.4 (SAS Institute Inc.) for all analyses. Two-sided P < 0.05 indicated statistical significance.Table 1. Sample characteristics (N = 957)Incarceration Historyp-value ^a^Past yearPrior to past yearNever(n = 416)(n = 400)(n = 141)Survey Year < 0.01 2015245 (58.9%)190 (47.5%)70 (49.7%) 2018171 (41.1%)210 (52.5%)71 (50.3%)Age, mean (SD)36.4 (9.6)42.7 (11.4)36.0 (11.2) < 0.0001Gender ^b^ Female (cis-gender)99 (23.8%)106 (26.5%)75 (53.2%) < 0.0001 Male (cis-gender)316 (76.0%)290 (72.5%)65 (46.1%) Transgender1 (0.2%)4 (1.0%)1 (0.7%)Race/ethnicity White, non-Hispanic288 (69.4%)260 (65.0%)103 (73.1%)0.17 Black, non-Hispanic29 (7.0%)44 (11.0%)7 (5.0%) Hispanic (any race)66 (15.9%)62 (15.5%)17 (12.1%) Other non-Hispanic*(missing n* = 1)32 (7.7%)34 (8.5%)14 (9.9%)Marital status Married or cohabitating34 (8.2%)49 (12.3%)18 (12.8%) < 0.01 Divorced, separated, or widowed87 (20.9%)118 (29.5%)37 (26.2%) Single295 (70.9%)233 (58.3%)86 (61.0%)High school completion(missing n = 1)323 (77.6%)292 (73.0%)118 (84.3%)0.02Homelessness, current(missing n = 1)297 (71.6%)246 (61.5%)82 (58.2%) < 0.01Employment, current57 (13.7%)49 (12.3%)24 (17.0%)0.36Income below federal poverty level, past year(missing n = 4)300 (72.3%)296 (74.2%)94 (67.6%)0.33Inject more than once per day, past year(missing n = 1)317 (76.2%)275 (68.9%)94 (66.7%)0.02Receptive sharing of injection equipment, past year344 (82.7%)297 (74.3%)108 (76.6%)0.01Opioid injection, past year403 (96.9%)382 (95.5%)137 (97.2%)0.49Stimulant injection, past year327 (78.6%)273 (68.3%)96 (68.1%) < 0.01Non-injection drug use, past year364 (87.5%)345 (86.3%)122 (86.5%)0.86Binge drinking, past 30 days(missing n = 9)178 (42.9%)133 (33.8%)39 (28.1%) < 0.01Sexual activity, past year < 0.01 Any male-to-male60 (14.4%)67 (16.8%)13 (9.2%) Heterosexual only336 (80.8%)290 (72.5%)118 (83.7%) None20 (4.8%)43 (10.8%)10 (7.1%)Transactional sex, past year(missing n = 6)135 (32.5%)113 (28.5%)34 (24.3%)0.15Health insurance, current No Insurance15 (3.6%)18 (4.5%)11 (7.8%)0.22 Private, multiple, or other10 (2.4%)11 (2.8%)6 (4.3%) Public insurance391 (94.0%)371 (92.8%)124 (87.9%)Has a usual source of medical care356 (85.6%)353 (88.3%)116 (82.3%)0.18Syringe service program utilization, past year343 (82.5%)321 (80.3%)108 (76.6%)0.30Drug treatment program participation, past year319 (76.7%)270 (67.5%)87 (61.7%) < 0.001Hepatitis C virus infection, self-reported(missing n = *77)*295 (75.1%)279 (74.8%)63 (55.3%) < 0.0001All values in table are column percentages unless otherwise specified^a^p-values are based on hypothesis testing using χ^2^ for the categorical variables and ANOVA for the continuous variable (age)^b^Gender categories reflect participants’ responses to the following survey question: “Do you consider yourself to be male, female or transgender?”
Results
Of the 957 participants included in our study sample, the average age was 38.9 (SD 11.1) years, 671 (70.1%) were male, 145 (15.2%) were Hispanic (of any race), 80 (8.4%) were non-Hispanic Black, and 651 (68.1%) were non-Hispanic White. Most participants had a history of incarceration at some point, with 416 (43.5%) reporting past-year incarceration and 400 (41.8%) reporting only a history of incarceration prior to the past year, while the remaining 141 (14.7%) had never been incarcerated (Table 1). Participant characteristics were similar between those with incarceration in the past year and prior to the past year, except that those with a less recent incarceration history were older on average and less likely to report recent binge drinking. Compared to the two groups with incarceration histories, those without any history of incarceration were more likely to be female and have a higher education level and less likely to report an HCV diagnosis.
Overall, 93.8% of participants reported ever being tested for HIV, and 58.5% reported past-year HIV testing (Table 2). Those with past-year incarceration were more likely to report past-year HIV testing (74%) compared to the other two groups (incarcerated prior to past year, 62%; never incarcerated, 62%). Among those with past-year incarceration, 30.5% reported receiving an HIV test while incarcerated. Self-testing with rapid HIV tests was rare (1.4% overall). Compared to past-year HIV testing, past-year testing for bacterial STIs was lower overall (45.1%) and in each group, and those with past-year incarceration were slightly more likely than those in the other two groups to report STI testing.Table 2HIV and bacterial STI testing history by incarceration historyOverallIncarceration HistoryPast YearPrior to Past YearNeverp-value^a^(n = 957)**(n = 416)**(n = 400)**(n = 141)HIV Testing, Ever (Lifetime)898 (93.8%)393 (94.5%)378 (94.5%)127 (90.1%)0.13HIV Testing, Past Year(missing n = 5)557 (58.5%)278 (67.0%)212 (53.4%)67 (47.9%) < 0.0001HIV Testing While Incarcerated, Past Yearn/a126 (30.5%)n/an/aTotal No. HIV Tests in Past 2 Years, meanmedian (IQR)2.22 (1,3)2.42 (1,3)2.22 (1,3)1.81 (0,3)0.02Rapid Home HIV Test, Past Year(missing n = 9)13 (1.4%)8 (2.9%)4 (1.9%)1 (1.5%)0.69Bacterial STI Testing, Past Year(missing n = 5)429 (45.1%)208 (50.1%)162 (40.8%)59 (42.1%)0.02Bacterial STI Diagnosis, Past Year(missing n = *2)*48 (5.0%)21 (5.1%)19 (4.8%)8 (5.7%)0.91All values represent column percentages unless otherwise specifiedAbbreviations: STI Sextually transmitted infection, SD Standard deviation, IQR Interquartile range^a^p-values are based on hypothesis testing using χ^2^ for categorical variables and the nonparametric Kruskal–Wallis test for the total number of HIV tests in past 2 years, because it was not normally distributed
Locations of most recent HIV test varied across the three categories of groups (Fig. 1). Among those with past-year incarceration, 'correctional facility' was tied with ‘doctor’s office or community health center’ as their most common response.Fig. 1. Location of last HIV test among those with past-year testing, by incarceration history. Legend: Self-reported locations of participants’ last HIV tests, by incarceration history. Due to incomplete response rates, the number of responses among those with past year incarceration was n = 273; among those with incarceration prior to the past year, n = 209; and for those with no incarceration history, n = 65. All values represent column percentages (column sums may be greater than 100% due to rounding)
Among those without past-year HIV testing, the main reason reported for not getting tested in the past 12 months varied across the incarceration groups (Table 3). Among those with past-year incarceration and those with no incarceration history, the most important reason was 'You were afraid of finding out that you have HIV.' Among those with incarceration prior to the past year, that response was as common as, 'You think you are at low risk for HIV infection.' 'No particular reason' was common among all groups, chosen by more than a third in each group.Table 3. Reasons for not receiving past-year HIV test, by incarceration historyPast Year IncarcerationPrior to Past Year IncarcerationNever incarcerated*(n* = 137)**(n = 185)**(n = *73)*You think you are at low risk for HIV infection?17 (12.4%)45 (24.3%)12 (16.4%)You were afraid of finding out that you had HIV?57 (41.6%)50 (27.0%)22 (30.1%)You didn't have time?12 (8.8%)12 (6.5%)5 (6.9%)Some other reason?4 (2.9%)7 (3.8%)4 (5.5%)No particular reason47 (34.3%)71 (38.4%)30 (41.1%)Among participants that had not received HIV testing within the past year, this table records their responses to the following survey question: “Which of these best describes the most important reason you have not been tested for HIV in the past 12 months?” All values represent column percentages (column sums may be greater than 100% due to rounding)
In the multivariable regression analysis (Table 4), those with past-year incarceration had significantly greater prevalence of past-year HIV testing compared to those with no incarceration history (adjusted prevalence ratio [aPR] 1.39; 95% CI: 1.29, 1.49), and, to a lesser extent, so did those with incarceration prior to the past year (aPR 1.19; 95%CI: 1.02, 1.38). Other statistically significant factors associated with greater prevalence of past-year HIV testing in the multivariable-adjusted analysis were younger age, homelessness, only heterosexual activity (vs. any male-to-male), not binge drinking, drug treatment program participation, syringe service program participation, and having a usual source of medical care.Table 4. Associations with past-year HIV testing using modified poisson regression (N = 938)^a^UnadjustedAdjusted (Multivariable)PR95% CIaPR95% CIIncarceration History Past year1.401.260.541.391.291.49 Prior to past year1.120.961.291.191.021.38 Never(ref.)(ref.)Age (in years)0.990.990.990.990.991.00Male gender (vs. Female) ^b^0.990.911.081.020.941.12Race/Ethnicity White, non-Hispanic(ref.)(ref.) Black, non-Hispanic0.880.741.041.100.851.42 Hispanic of any race0.880.661.190.900.711.15 Other non-Hispanic0.940.821.081.030.881.20Education, completed HS (vs. did not complete HS)1.130.881.451.160.951.41Income at or below FPL (vs. above FPL)1.050.941.171.060.961.16Marital status Single(ref.) Divorced, separated, or widowed0.850.721.020.950.781.15 Married or cohabitating0.960.851.081.050.961.15Currently Homeless1.241.111.381.211.081.36Sexual activity Any male-to-male0.830.730.940.850.790.92 Heterosexual only(ref.)(ref.) None0.930.771.120.960.821.12Inject more than once per day (vs. once per day or less often)1.000.901.120.970.891.05Receptive sharing of injection equipment, past year1.010.901.130.930.861.01Stimulant injection, past year1.161.051.271.080.961.22Binge drinking, past 30 days0.940.841.040.900.820.99Drug treatment program participation, past year1.321.151.521.251.121.40Syringe service program utilization, past year1.281.111.471.231.111.38Has a usual source of medical care1.100.971.251.141.021.27Survey Year 2015 (vs. 2018)1.050.941.161.000.941.06Abbreviations: PR Prevalence ratio, aPR adjusted prevalence ratio, HS High school, FPL Federal poverty level^*^ p < 0.05^a^The regression model excluded n = 19 participants because of missing responses to the model variables and/or because the transgender subgroup was too small to include, as described in the text^b^We excluded transgender individuals from this regression analysis due to very small numbers. Gender categories (female, male, transgender) were based on responses to the following survey question: “Do you consider yourself to be male, female or transgender?”
Discussion
In this secondary analysis of survey data from PWID in the Boston metro area, our findings underscore the role that incarceration plays in HIV testing for this vulnerable group at high risk for HIV. Over 30% of PWID with past-year incarceration had received HIV testing while incarcerated, and this group had higher unadjusted rates of any past-year testing compared to the other two groups (incarcerated prior to the past year and never incarcerated). Also, having any history of incarceration, whether it was within the past year or more remote, was significantly associated with past-year HIV testing. Overall, 58.5% of participants reported receiving an HIV test within the past 12 months, which is similar to the overall testing rate of the national NHBS sample (57–58% in 2015 and 2018) [20, 66]. However, the goal among PWID should be nearly universal coverage, in keeping with the CDC recommendations to test at least annually [19]. Efforts are needed across both carceral and community settings to increase HIV testing among PWID.
The association between incarceration and HIV testing, which has also been seen elsewhere among PWID [67] and other groups in the US [68–71], highlights several challenges in delivering HIV testing to PWID—the fact that substance use and injection drug use are criminalized concentrates this high risk population in jails and prisons. Given the deleterious effects that incarceration can have on health and healthcare, both in terms of HIV and otherwise [31–35, 48, 72, 73], we are not suggesting that incarceration is a beneficial solution to problems of healthcare access in the community. In fact, other scholars and researchers have argued that the overlapping developments with HIV, injection drug use, and mass incarceration over the past two decades in the US represent a syndemic [74], a synergistic interaction between multiple health conditions and social vulnerabilities within a specific population [30, 72, 75, 76]. Nevertheless, we maintain that public health efforts should take advantage of existing touchpoints to offer HIV testing (and other prevention and treatment measures) to PWID [41]. At the same time, our findings also suggest that the HIV testing received in carceral facilities does not fully explain the association between incarceration history and receipt of past-year testing, because those who had only been incarcerated prior to the past year also had higher rates of past-year testing. To the extent that carceral facilities offer HIV education and testing, it is possible that prior incarceration, even if not within the past year, is an experience that familiarizes individuals with HIV testing services or sensitizes them to its importance. Alternatively, incarceration history might merely be a marker of greater risk and, in turn, associated with greater motivation to seek testing.
Furthermore, there are still missed opportunities to engage PWID in testing in carceral settings. Indeed, we still found that over one third of recently incarcerated individuals had no past-year HIV testing, and a substantial proportion of those without past-year testing reported that they were afraid of finding out that they might have HIV (41.6%) – a finding which might suggest particularly high risk in the past-year incarceration group. There are several reasons why participants may not have been tested in carceral settings. In Massachusetts, verbal consent is sufficient for HIV testing (Massachusetts General Laws Ch. 111, Sect. 70 F) [77], yet most jails in the state require written consent. A 2018 study of testing policies across Massachusetts county jails found that none of the jails offered universal opt-out HIV testing at intake, and less than half (46%) of them routinely offered opt-in testing [40]. Some facilities might not offer testing because of the cost of providing medications for identified cases, and thus some may not know that the US government’s Ryan White HIV/AIDS Program can cover HIV treatment in jails and prisons [78]. While CDC guidelines recommend universal opt-out testing in carceral facilities [19, 36], some have raised questions about the best way to offer testing. While one study found better uptake when opt-out testing was offered on the day of admission (compared to the next day or to one week later) [79], another study found better uptake when opt-out testing was integrated with routine phlebotomy and separate from the often chaotic intake process [80]. With the concerns about coercion, confidentiality, and stigma during incarceration [81] and the resulting mistrust that many feel, one study of incarcerated individuals’ perspectives found that most participants preferred the opt-in approach (over the opt-out approach) because it gave them a greater sense of autonomous choice [82]. In terms of the most suitable testing modality to use in carceral settings, one study found, perhaps counterintuitively, that uptake (and the total number who both were tested and received their result) improved when a large urban jail switched from a rapid point-of-care test to a laboratory-based test that required phlebotomy [83]; yet whether this finding holds true among PWID specifically, who often have more difficulties with phlebotomy [84], may warrant further investigation. One other advantage of laboratory-based HIV testing is the relative ease of combining it with other tests at the same time, such as hepatitis C virus, tuberculosis, or syphilis [80, 85].
Among people who received HIV testing, a large percentage of tests occurred outside of mainstream medical settings (despite over 80% of participants reporting a usual source of medical care). In our sample, HIV testing happened approximately just as often in syringe service programs and drug treatment programs as it did in doctor’s offices/community health centers, emergency departments and carceral settings. These patterns of HIV testing sites signal that high-impact testing programs should be offered in locations that PWID already frequent [41, 86, 87]. These findings may reflect that such strategies were already part of the state and local public health policies. Nevertheless, improvements in testing rates in this population are still needed. For example, efforts are needed to strengthen HIV testing services in substance use treatment facilities, which would require, among other things, public health investment and reforms in payment for substance use treatment. Use of rapid home tests, or self tests, was rare in our sample, which may represent an opportunity—MADPH did not provide or fund the distribution of rapid HIV tests at that time. Scholars have noted the importance of on-demand rapid testing for PWID, a modality that could facilitate HIV testing outside of mainstream healthcare settings and which avoids some of the structural barriers and stigma associated with laboratory-based tests that require phlebotomy and subsequent follow-up for results [84, 88].
Future research could explore why homelessness, which was reported by approximately two thirds of respondents, was associated with a greater prevalence of HIV testing—our multivariable regression model adjusted for syringe service program use and incarceration so some other factor(s) may explain this. We also found that bacterial STI testing was much lower than HIV testing in this PWID sample, suggesting that the elevated sexual transmission risk in this population, which is already known, may be relatively overlooked [89]. Furthermore, male-to-male sexual activity, which likely confers an even greater need for testing, was associated with less testing; this could be explained by the compounded stigma that this subgroup might experience.
Our study has limitations. The cross-sectional data source prohibits causal inference, and the summary measures of past-year incarceration and past-year testing did not allow us to identify the relative order in which these had occurred. Moreover, we relied on self-reported information to ascertain HIV testing and incarceration histories which may be subject to recall bias and other response biases, including social desirability bias regarding stigmatized experiences and behaviors (e.g. incarceration, substance use, sexual activity). We also lacked other potentially relevant information about incarceration, such as the specific facility, duration of incarceration, and the reason for incarceration. Because policies and practices vary, it is possible that incarceration in certain facilities would have been associated with more testing while other facilities would not and that longer incarcerations would allow more opportunities for testing within a facility. For location of testing, our data only described the last test location for each individual, which might not be representative of the total amount of testing being utilized from each location. Our findings from a single site, the Boston metro area, might not generalize to other places, as carceral systems and policies and harm reduction services for PWID can vary widely across the US. Also, respondent-driven sampling might not be representative of the entire PWID population.
Conclusion
In this cross-sectional study of Boston-area PWID, contact with carceral facilities was very common and was also a substantial source of HIV testing. However, overall rates of testing need to be improved, which would require more testing in both community and carceral facilities. There should be "no wrong door" for accessing testing, i.e. HIV testing should be available wherever possible for PWID, taking advantage of existing touchpoints.
The reference list from the paper itself. Each links out to its DOI / PubMed record.
- 1Centers for Disease Control and Prevention. Estimated HIV incidence and prevalence in the United States, 2015–2019. HIV Surveillance Supplemental Report. 2021;26(1). Available from: https://www.cdc.gov/hiv/library/reports/hiv-surveillance.html. Cited 2024 Feb 27.
- 2Centers for Disease Control and Prevention. Estimated HIV incidence and prevalence in the United States, 2017–2021. HIV Surveillance Supplemental Report. 2023;28(3). Available from: https://stacks.cdc.gov/view/cdc/149080. Cited 2024 Feb 27.
- 3Brown CM. MDPH Clinical Advisory: Statewide Outbreak of HIV Infection in Persons who Inject Drugs, February 5, 2019. Massachusetts Department of Public Health; 2019 Feb p. 2. Available from: https://www.mass.gov/files/documents/2019/02/07/statewide%20advisory%20hiv%20in%20pwid%202-5-19.docx?_ga=2.182212583.1590938026.1659456172-1778656474.1644510133.
- 4Massachusetts Department of Public Health, Bureau of Infectious Disease and Laboratory Sciences. Massachusetts HIV Epidemiologic Profile: Data as of 1/1/2022, Population Report: Persons Who Inject Drugs. 2023. Available from: https://www.mass.gov/lists/hivaids-epidemiologic-profiles. Cited 2024 Feb 6.
- 5Lansky A, Finlayson T, Johnson C, Holtzman D, Wejnert C, Mitsch A, et al. Estimating the Number of Persons Who Inject Drugs in the United States by Meta-Analysis to Calculate National Rates of HIV and Hepatitis C Virus Infections. PLOS ONE. 2014;9(5):e 97596. Available from: https://journals.plos.org/plosone/article?id=10.1371/journal.pone.0097596. Cited 2022 July 19.10.1371/journal.pone.0097596 PMC 402652424840662 · doi ↗ · pubmed ↗
- 6Bradley H, Hall E, Asher A, Furukawa N, Jones CM, Shealey J, et al. Estimated number of people who inject drugs in the United States. Clinical Infectious Diseases. 2022;ciac 543. 10.1093/cid/ciac 543. Cited 2022 July 19.10.1093/cid/ciac 543PMC 1020243635791261 · doi ↗ · pubmed ↗
- 7Mattson CL. Trends and Geographic patterns in drug and synthetic opioid overdose deaths — United States, 2013–2019. MMWR Morb Mortal Wkly Rep. 2021;70. Available from: https://www.cdc.gov/mmwr/volumes/70/wr/mm 7006 a 4.htm. Cited 2022 July 18.10.15585/mmwr.mm 7006 a 4PMC 787758733571180 · doi ↗ · pubmed ↗
- 8O’Donnell JK. Trends in Deaths Involving Heroin and Synthetic Opioids Excluding Methadone, and Law Enforcement Drug Product Reports, by Census Region — United States, 2006–2015. MMWR Morb Mortal Wkly Rep. 2017;66. Available from: https://www.cdc.gov/mmwr/volumes/66/wr/mm 6634 a 2.htm. Cited 2022 July 19.10.15585/mmwr.mm 6634 a 2PMC 565778628859052 · doi ↗ · pubmed ↗