Evaluation of the safety of high-dose Lactobacillus gasseri CP2305 supplementation in healthy adults: A randomized, double-blind, placebo-controlled study
Hajime Fuchida, Daisuke Sawada, Tatsuhiko Hirota, Hiroki Miyashita, Kazuhiko Takano, Koji Mochizuki

TL;DR
This study shows that taking high doses of Lactobacillus gasseri CP2305 for four weeks is safe in healthy adults.
Contribution
The study confirms the safety of high-dose Lactobacillus gasseri CP2305 intake in a placebo-controlled trial.
Findings
No adverse clinical findings were observed in physical exams, blood tests, or urinalysis.
Subjective symptoms and physician interviews showed no safety concerns.
High-dose L. gasseri CP2305 intake (1.0 × 10¹¹ cells/day) was well-tolerated over four weeks.
Abstract
Lactobacillus gasseri CP2305 (L. gasseri CP2305) has been reported to exert intestinal regulatory, anti-stress, and sleep-improving effects in healthy adults. This study aimed to evaluate the safety of an excessive intake of L. gasseri CP2305 in a randomized, double-blind, placebo-controlled, parallel-group trial. Among 95 participants who provided written informed consent, 44 who met the eligibility criteria were randomly assigned to either the L. gasseri CP2305 group (n = 22) or the placebo group (n = 22). All participants ingested 20 tablets of either L. gasseri CP2305 or placebo daily for 4 weeks. The L. gasseri CP2305 group consumed 1.0 × 10 ¹ ¹ cells of L. gasseri CP2305 cells per day. To assess the safety of CP2305 tablets, physical examinations, hematological and biochemical blood tests, urinalysis, recording of subjective symptoms, and physician interviews were conducted. One…
Genes, proteins, chemicals, diseases, species, mutations and cell lines named across the full text — each resolved to its canonical identifier and authoritative record.
Click any figure to enlarge with its caption.
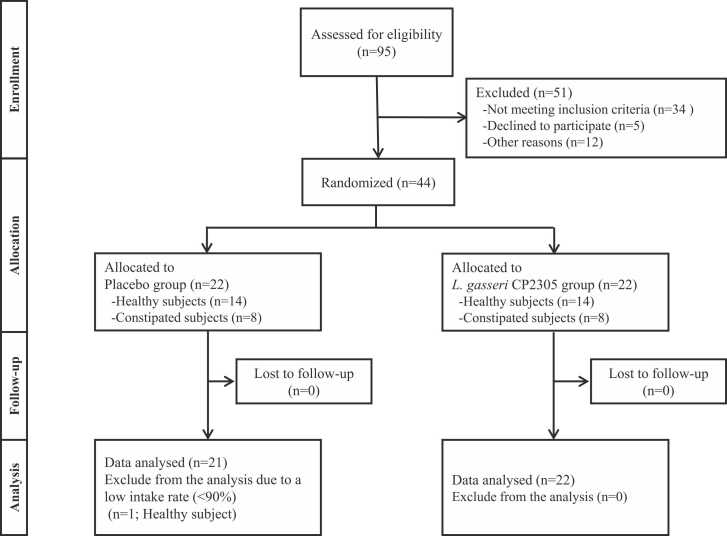 Figure 1
Peer Reviews
No public reviews on file for this paper yet. If you reviewed it on a platform where reviews are public (OpenReview, ICLR, NeurIPS, ICML), you can paste yours below so the community can read it here.
Videos
No videos yet. Explain this paper in a talk, walkthrough, or lecture? Add one.
Taxonomy
TopicsProbiotics and Fermented Foods · Gut microbiota and health · Microbial Metabolites in Food Biotechnology
Introduction
1
Approximately 100 trillion bacteria and other microorganisms reside in the human intestines, forming diverse colonies known as the gut microbiota [1]. The composition and metabolism of the gut microbiota are influenced by dietary habits [2], stress [3], aging [4], and various other factors, and are also affected by several diseases [5], which can reduce quality of life. Therefore, improving the intestinal environment is essential for maintaining and promoting health. Lactobacillus gasseri CP2305, a lactic acid bacterium isolated from a healthy adult, has been the subject of numerous studies. It has been shown to exert intestinal regulatory effects that improve the intestinal environment, as well as anti-stress and sleep-improving effects.
The various effects, including intestinal regulatory effects in healthy individuals [6], improvements in stress and sleep among medical students [7], [8], enhanced quality of life and reduced irritable bowel syndrome (IBS) severity scores in patients with IBS [9], and alleviation of mild menopausal symptoms in women [10] were reported in human studies with this strain. Furthermore, in 2022, a systematic review and meta-analysis reported that daily intake of L. gasseri CP2305 significantly improved sleep quality in adults experiencing mild to moderate stress [11]. However, to date, no published studies have evaluated the safety of overdosing on this strain.
Therefore, the present study aimed to assess the safety of excessive intake of L. gasseri CP2305 through a 4-week intervention in healthy individuals and those prone to constipation, using a tablet-type food containing sterilized powder of the strain and a placebo food without the strain.
Materials and methods
2
Study design
2.1
A randomized, double-blind, placebo-controlled, parallel-group study was conducted at Utsukushigaoka Hospital (Hokubukai Medical Corporation, Sapporo, Japan) to evaluate the safety of excessive intake of Lactobacillus gasseri CP2305. The study protocol was approved by the Ethics Committee of Utsukushigaoka Hospital on February 25, 2016.
This study was conducted in accordance with the ethical principles outlined in the Declaration of Helsinki and the Ethical Guidelines for Medical Research Involving Human Subjects (Ministry of Education, Culture, Sports, Science and Technology, Japan, and Ministry of Health, Labour and Welfare, Japan). The study was performed in compliance with the approved protocol. The protocol was registered in the University Hospital Medical Information Network Clinical Trials Registry (UMIN-CTR) under the identifier UMIN000021511.
Subjects
2.2
The participants in this study were healthy Japanese adults.
Inclusion criteria were as follows:
- (1)untreated Japanese men and women aged 20–70 years at the time of consent.
- (2)individuals whom the principal investigator judged eligible for participation based on the results of a screening test.
- (3)individuals who provided written, voluntary informed consent to participate in the study.
Exclusion criteria were as follows:
- (1)individuals with a serious medical history that would make them unsuitable for participation.
- (2)individuals with a history of digestive tract surgery, such as gastrectomy or intestinal resection (excluding appendectomy).
- (3)individuals using medications for constipation or foods with equivalent effects (including “Food for Specified Health Uses”, “Foods with functional claim”, and dietary supplements).
- (4)individuals with known allergies to lactic acid bacteria, milk, soy, citrus fruits, or related ingredients.
- (5)women who intended to become pregnant during the study period, pregnant women (including those who might be pregnant), or breastfeeding women.
- (6)individuals with excessive alcohol consumption or smoking habits.
- (7)individuals with highly irregular eating habits (e.g., skipping meals three or more times per week).
- (8)individuals engaged in night-shift work extending past midnight.
- (9)individuals currently participating in other clinical trials or monitoring studies (for foods, pharmaceuticals, cosmetics, or topical products), or those planning to participate during the study period.
- (10)individuals otherwise deemed unsuitable for participation by the principal investigator.
Participants were recruited through the clinical trial volunteer organization “Hokuto Unity Club” (operated by Utsukushigaoka Hospital) and Huma Co., Ltd. Before enrollment, all participants received a detailed explanation of the study using an information sheet approved by the Ethics Committee of Utsukushigaoka Hospital, and written informed consent was obtained. The intervention period was conducted from March to May 2016.
Sample size
2.3
The sample size, 22 participants per group, was determined referred to previous studies evaluating the safety of functional foods [12], [13], [14].
Enrollment, randomization, and blinding
2.4
A total of 95 individuals who provided written informed consent underwent screening, and 44 were enrolled in this study. Given that Lactobacillus gasseri CP2305 has been reported to exert a regulatory effect on intestinal function, particularly in individuals with hard stools [6], the study population was stratified into healthy subjects and constipated subjects. The latter group was defined as individuals with a defecation frequency of fewer than four times per week, and included 16 participants
These 44 participants were randomly assigned to two groups by an individual not directly involved in the study. Random numbers were generated using Microsoft Excel to ensure that the average age of the two groups was approximately equal. Another independent individual then assigned the CP2305 tablets or placebo to the respective groups. The allocation information was sealed by each assignor, and the details of the assignment were kept concealed from all investigators and study staff until the code was broken after study completion.
Intervention
2.5
Lactobacillus gasseri strain CP2305, a probiotic strain isolated from a healthy human adult [7], was used in this study. A nonviable (heat-inactivated) CP2305 powder, containing at least 7.6 × 10¹¹ cells per gram was obtained as previously described [6].
All participants were instructed to chew and ingest 20 study tablets of L. gasseri CP2305 or placebo daily for four weeks. In line with the actual usage of this product, no specific timing for intake was specified. If swallowing was difficult, they were permitted to take the tablets with an appropriate amount of water. The CP2305 tablets contained 3 % L. gasseri CP2305 powder, corresponding to 1.0 × 10 ¹ ¹ cells per 20 tablets per day (ten times the recommended daily intake). The placebo tablets did not contain L. gasseri CP2305 powder but instead contained an equivalent amount of dextrin. Both study tablets (CP2305 and placebo) weighed approximately 4.4 g per 20 tablets and were milky white in appearance.
Outcomes
2.6
The study schedule is shown in Table 1. Participants visited the hospital for screening, during which they underwent medical and physical examinations, hematological and biochemical blood tests, and urinalysis. They subsequently visited the hospital at weeks 0 (0 W), 2 (2 W), and 4 (4 W) during the intervention period, and again two weeks after the end of intake (6 W) for follow-up. At each visit, the same examinations were performed to collect safety data.Table 1. Test schedule.Table 1. Image 1
Participants were instructed to comply with the following eight rules throughout the study:
- 1.Participants were instructed to pay close attention to their personal health management and to avoid strenuous exercise or heavy physical labor. They were also asked to maintain their usual dietary and exercise habits as consistently as possible throughout the study period, relative to their pre-study routines.
- 2.The study tablets were to be consumed appropriately while maintaining regular lifestyle habits. In cases where medical treatment became necessary due to illness or other reasons, participants were instructed to contact the study staff and follow their guidance.
- 3.The use of any medications or foods that claim to regulate intestinal function was prohibited. However, if treatment became necessary due to an acute illness or other reasons, participants were to consult the study’s designated contact and adhere to the provided instructions.
- 4.Participants were asked to refrain from dieting, excessive alcohol consumption, and heavy smoking during the study period.
- 5.Strict adherence to the assigned visit schedule was required, and participants were instructed to carefully review the study schedule.
- 6.On the day before each hospital visit, participants were instructed to avoid high-fat meals and to abstain from alcohol consumption.
- 7.During each visit, participants were required to follow the instructions of the study physician, nurses, and research staff.
- 8.Participants were prohibited from sharing or disclosing any study materials or study tablets used in this study to third parties.
Primary outcomes
2.7
During the physical examinations, the subjects’ height, weight, body fat percentage, BMI, blood pressure, pulse rate, and body temperature were measured. Height was measured only at screening (SCR) to calculate BMI.
Hematological tests included WBC, RBC, Hb, Ht, and Plt. Blood biochemical tests included TP, Alb, T-Bil, AST (GOT), ALT (GPT), ALP, LDH, γ-GTP, T-Cho, HDL-Cho, LDL-Cho, TG, UA, BUN, CRE, Na, K, Cl, BS, IRI, and HbA1c. Both hematological and blood biochemical analyses were performed at Sapporo Clinical Laboratory Inc. (Sapporo, Japan).
Urinalysis included protein, glucose, urobilinogen, bilirubin, ketone bodies, occult blood, pH, and specific gravity. These analyses were also conducted at Sapporo Clinical Laboratory Inc. (Sapporo, Japan).
From the start of study tablets consumption until the post-observation period, the subjects kept a daily diary in which they recorded their daily routines (wake-up time, bedtime, and meal times), whether and when they had consumed the study tablets (and the reason if they did not), alcohol intake, use of health foods or medications, any subjective symptoms (e.g., dry cough, loss of appetite, gastric discomfort, abdominal pain, diarrhea, headache, and other related symptoms), and menstrual status. The subjects were instructed to bring their diaries to each hospital visit, where the entries were reviewed. In addition, at each visit, the subjects were examined and interviewed by a physician.
Statistical analysis
2.8
The mean and standard deviation of the data obtained at screening were calculated and used as background information.
Data collected at weeks 0 (0 W), 2 (2 W), 4 (4 W), and at post-observation (6 W) were used for analyses. Subjects who consumed less than 90 % of the study tablets Placebo during the 28-day period were excluded from the analysis. In addition, subjects deemed unsuitable for inclusion after the start of the study were also excluded. The mean and standard deviation were calculated for each data point, excluding dropouts. Paired t-tests were performed to compare within-group changes from baseline (0 W) to post-intake (2 W, 4 W, and 6 W). Unpaired t-tests were conducted to compare the CP2305 group and the placebo group at each visit. All statistical analyses were two-sided with a significance level of 5 %. No adjustment for multiple comparisons was applied. Statistical analyses were performed using Microsoft Excel (Microsoft Corp., Redmond, WA, USA).
Results
3
Setting analysis
3.1
Table 2 presents the background characteristics of the subjects (values at SCR). The subjects represented a broad range of age, with no apparent age-group bias. The subjects comprised equal numbers of men and women. No significant differences were observed between the groups in age or any other measured parameters.Table 2. Subject background (values at screening).Table 2. ItemsUnitPlacebo groupCP2305 groupOverallNumberNo.(male/female)22(11/11)22(11/11)Ageyears old46.8±14.146.5±15.1Heightcm164.05±10.24162.22±8.56Body weightkg61.09±11.0660.30±12.67BMIm^2^/kg22.57±2.5722.71±3.31body fat percentage%26.19±7.2326.07±5.94Healthy subjectNumberNo.(male/female)14(7/7)14(7/7)Ageyears old45.1±15.545.1±16.5Heightcm163.59±11.61161.54±7.91Body weightkg61.00±12.4659.91±13.83BMIm^2^/kg22.62±2.5922.72±3.81body fat percentage%25.89±6.4426.00±6.19Constipated subjectNumberNo.(male/female)8(4/4)8(4/4)Ageyears old49.8±11.749.0±13.0Heightcm164.85±7.93163.41±10.06Body weightkg61.24±8.8960.99±11.20BMIm^2^/kg22.49±2.7222.70±2.42body fat percentage%26.73±8.9126.19±5.88All values except for the number of subjects are "mean ± standard deviation"
All 44 enrolled subjects completed the study (Fig. 1). One subject (No. 104, male) had a study tablets intake rate of less than 90 % and was therefore excluded from the analysis. No other subjects violated the study protocol, and the final analysis was conducted on 43 subjects (Fig. 1).Fig. 1. Flow diagram of participant screening, enrollment, and analysis.Fig. 1
Physical examination
3.2
The results of the physical examinations are shown in Table 3.Table 3. Physical examinations.Table 3. Intervention periodPost ObservationItemsreference0 W2 W4 W6 Wvalues†BGBABGBABGBABGOverallBody weight (kg)Placebo61.06±11.0560.24±10.7760.46±10.7460.33±10.68CP230561.00±12.89NS60.56±12.75*NS60.67±12.73NSNS60.65±12.76NSNSBMI (kg/m2)Placebo22.71±2.7022.40±2.6622.49±2.6222.44±2.68CP230523.00±3.40NS22.84±3.40NS22.88±3.36NSNS22.86±3.35NSNSBody fat percentage (%)Placebo26.91±7.7625.88±7.5726.06±7.4925.94±7.73CP230526.53±6.31NS25.87±6.22NS25.81±6.42**NS25.77±6.34NSSystolic blood pressure (mmHg)< 130Placebo119.5±16.3118.5±15.3NS116.2±13.2NS116.3±12.6NSCP2305120.7±18.8NS121.6±14.8NSNS119.7±17.3NSNS121.2±15.1NSNSDiastolic blood pressure (mmHg)< 85Placebo69.7±13.073.2±15.6NS68.1±11.5NS66.9±9.1NSCP230570.1±12.0NS70.8±12.1NSNS71.6±13.8NSNS69.8±13.5NSNSPulse rate (bpm)< 100Placebo72.3±12.673.6±12.5NS72.1±13.5NS72.2±10.9NSCP230572.6±9.7NS73.3±10.5NSNS72.4±8.3NSNS71.7±9.0NSNSBody temperature (℃)Placebo36.34±0.3936.30±0.48NS36.43±0.26NS36.50±0.32NSCP230536.40±0.31NS36.33±0.36NSNS36.41±0.36NSNS36.49±0.25NSNSHealthy subjectBody weight (kg)Placebo60.78±12.5659.69±12.2659.97±12.2559.83±12.21CP230560.63±14.04NS60.17±14.06NS60.04±13.82NS59.99±13.74NSNSBMI (kg/m2)Placebo22.78±2.7622.37±2.7822.46±2.6722.42±2.85CP230523.01±3.87NS22.84±3.89NS22.81±3.83NS22.79±3.81NSNSBody fat percentage (%)Placebo26.60±7.3825.35±6.9925.74±6.9025.89±7.10CP230526.54±6.69NS25.91±6.55NS25.81±6.73NS25.58±6.89NSSystolic blood pressure (mmHg)< 130Placebo117.2±18.4113.8±14.9NS115.2±12.3NS113.3±13.2NSCP2305122.9±21.2NS125.8±15.1NS#120.1±20.2NSNS123.0±16.1NSNSDiastolic blood pressure (mmHg)< 85Placebo66.9±13.066.5±11.2NS65.5±10.8NS64.5±9.0NSCP230570.5±13.5NS73.3±12.6NSNS70.6±15.5NSNS69.1±14.9NSNSPulse rate (bpm)< 100Placebo72.0±12.372.9±12.7NS73.5±16.1NS71.8±12.5NSCP230574.4±11.2NS76.4±11.4NSNS72.8±6.7NSNS72.6±10.1NSNSBody temperature (℃)Placebo36.38±0.4536.30±0.50NS36.38±0.31NS36.48±0.31NSCP230536.35±0.33NS36.37±0.34NSNS36.41±0.33NSNS36.52±0.26NSNSConstipated subjectBody weight (kg)Placebo61.51±8.8161.14±8.53NS61.26±8.41NS61.14±8.33NSCP230561.66±11.47NS61.25±10.94NSNS61.78±11.37NSNS61.79±11.63NSNSBMI (kg/m2)Placebo22.60±2.7722.46±2.65NS22.53±2.70NS22.46±2.59NSCP230522.96±2.64NS22.84±2.57NSNS23.00±2.57NSNS23.00±2.59NSNSBody fat percentage (%)Placebo27.43±8.8426.73±8.88NS26.58±8.85NS26.03±9.18CP230526.50±6.04NS25.80±6.02NSNS25.81±6.29NSNS26.10±5.68NSNSSystolic blood pressure (mmHg)< 130Placebo123.1±12.6126.1±13.5NS117.9±15.4NS121.1±10.7NSCP2305116.9±14.2NS114.3±11.7NSNS119.0±11.6NSNS118.1±13.6NSNSDiastolic blood pressure (mmHg)< 85Placebo74.1±12.584.1±16.0*72.4±12.0NS70.6±8.5NSCP230569.4±9.6NS66.4±10.6NS#73.5±10.7NSNS71.1±11.5NSNSPulse rate (bpm)< 100Placebo72.8±13.874.8±12.9NS69.8±8.1NS72.9±8.5NSCP230569.6±5.5NS67.9±6.1NSNS71.6±11.1NSNS70.0±6.7NSNSBody temperature (℃)Placebo36.28±0.2936.29±0.47NS36.50±0.13NS36.53±0.34NSCP230536.50±0.28NS36.26±0.40NSNS36.41±0.42NSNS36.44±0.23NSNSAll values are "mean ± standard deviation":Significant difference compared to 0 W(p < 0.01)*:Significant difference compared to 0 W(p < 0.05)##:Significant difference between the groups(p < 0.01)#:Significant difference between the groups(p < 0.05)NS:No significant difference†:The reference values are those from the time of testing (2016).BA:Significance test in comparison with 0 WBG:Testing for significance between groups
In the overall analysis, body weight significantly decreased at 2 W, 4 W, and 6 W compared with 0 W in the placebo group (p < 0.001, p = 0.022, and p = 0.010, respectively). A significant decrement was also observed at 2 W in the CP2305 group (p = 0.027). BMI significantly decreased at 2 W, 4 W, and 6 W compared with 0 W in the placebo group (p < 0.001, p = 0.017, and p = 0.011, respectively) and at 2 W in the CP2305 group (p = 0.025). Body fat percentage significantly decreased at 2 W, 4 W, and 6 W in both groups (Placebo group: p = 0.010, 0.001, <0.001; CP2305 group: p = 0.002, 0.001, <0.001). Between the groups, no significant differences were observed for any of these parameters.
In the subgroup analysis of healthy subjects, weight loss was significantly greater at 2 W, 4 W, and 6 W compared with 0 W in the placebo group (p < 0.001, p = 0.041, p = 0.023). BMI significantly decreased at 2 W and 4 W in the CP2305 group (p = 0.025, p = 0.025), and at 2 W, 4 W, and 6 W in the placebo group (p < 0.001, p = 0.027, p = 0.020). Body fat percentage significantly decreased in both groups at 2 W, 4 W, and 6 W (Placebo group: p = 0.011, 0.012, 0.020; CP2305 group: p = 0.019, 0.015, 0.047). Furthermore, between-group comparison showed that systolic blood pressure at 2 W was significantly higher in the CP2305 group (p = 0.050), although values in both groups remained within the normal range.
In subjects prone to constipation, body fat percentage significantly decreased in the placebo group at 6 W (p = 0.010). Diastolic blood pressure significantly increased in the placebo group at 2 W (p = 0.011) and was significantly higher than that in the CP2305 group (p = 0.020).
Blood analysis
3.3
The results of the hematological tests are shown in Table 4.Table 4. Hematological blood tests.Table 4. Intervention periodPost ObservationItemsreference0 W2 W4 W6 Wvalues†BGBABGBABGBABGOverallWhite blood cells (*10^3^)4.0~8.0Placebo6.73±1.626.60±1.78NS6.47±1.62NS6.95±2.43NSCP23056.16±1.17NS6.16±1.20NSNS6.30±1.46NSNS6.50±1.43NSNSRed blood cells (10^4^)M:410~540F:380~500 (10^4^)Placebo463.5±42.9469.2±48.5NS462.4±46.2NS455.4±47.6NSCP2305479.2±47.3NS480.7±53.7NSNS477.0±57.4NSNS481.5±49.8NSNSHemoglobin (g/dL)M:14.0~18.0F:12.0~16.0Placebo14.11±1.1314.35±1.34NS13.95±1.34NS13.77±1.32CP230514.47±1.42NS14.55±1.54NSNS14.30±1.64NSNS14.53±1.55NSNSHematocrit (%)M:39.0~50.0F:36.0~48.0Placebo42.54±2.8742.90±3.69NS42.43±3.62NS42.31±3.39NSCP230543.82±3.57NS43.70±4.40NSNS43.60±4.94NSNS44.35±4.24NSNSPlatelet (10^4^)12.0~40.0Placebo26.70±4.7127.93±4.6226.45±4.85NS27.70±6.62NSCP230524.89±3.60NS25.56±3.71NSNS25.59±3.99NSNS26.01±3.89NSHealthy subjectWhite blood cells (10^3^)4.0~8.0Placebo6.76±1.386.41±1.35NS6.21±1.446.76±1.35NSCP23056.14±1.14NS6.35±1.18NSNS6.27±1.53NSNS6.28±0.99NSNSRed blood cells (*10^4^)M:410~540F:380~500 (10^4^)Placebo459.4±49.5467.5±52.3NS462.4±49.8NS455.5±56.1NSCP2305490.2±50.1NS489.1±52.6NSNS486.6±58.2NSNS483.3±52.4NSNSHemoglobin (g/dL)M:14.0~18.0F:12.0~16.0Placebo14.19±1.2714.46±1.31NS14.15±1.28NS13.92±1.45NSCP230514.70±1.63NS14.74±1.60NSNS14.54±1.77NSNS14.47±1.71NSNSHematocrit (%)M:39.0~50.0F:36.0~48.0Placebo42.49±3.1843.10±3.49NS42.48±2.99NS42.35±3.47NSCP230544.55±4.04NS44.08±4.67NSNS44.31±5.28NSNS44.34±4.64NSNSPlatelet (10^4^)12.0~40.0Placebo26.35±4.8026.97±2.89NS25.53±3.86NS26.31±3.88NSCP230524.64±4.10NS25.21±4.08NSNS25.05±4.58NSNS24.90±4.09NSNSConstipated subjectWhite blood cells (10^3^)4.0~8.0Placebo6.68±2.066.90±2.40NS6.90±1.91NS7.26±3.68NSCP23056.21±1.31NS5.84±1.22NSNS6.36±1.45NSNS6.90±2.00NSNSRed blood cells (10^4^)M:410~540F:380~500 (10^4^)Placebo470.1±31.2472.0±44.9NS462.4±43.1NS455.1±32.7NSCP2305460.0±37.2NS466.1±55.8NSNS460.0±55.5NSNS478.5±48.4NSHemoglobin (g/dL)M:14.0~18.0F:12.0~16.0Placebo13.98±0.9314.18±1.48NS13.63±1.45NS13.54±1.12NSCP230514.08±0.89NS14.20±1.45NSNS13.89±1.38NSNS14.64±1.31NSHematocrit (%)M:39.0~50.0F:36.0~48.0Placebo42.61±2.4742.56±4.23NS42.36±4.70NS42.25±3.50NSCP230542.54±2.20NS43.04±4.10NSNS42.36±4.32NSNS44.36±3.75NSPlatelet (10^4^)12.0~40.0Placebo27.28±4.8329.49±6.5027.95±6.11NS29.96±9.49NSCP230525.33±2.70NS26.16±3.11NSNS26.54±2.69NS27.96±2.74NSAll values are "mean ± standard deviation":Significant difference compared to 0 W(p < 0.01):Significant difference compared to 0 W(p < 0.05)##:Significant difference between the groups(p < 0.01)#:Significant difference between the groups(p < 0.05)NS:No significant difference†:The reference values are those from the time of testing (2016).BA:Significance test in comparison with 0 WBG:Testing for significance between groups
In the analysis of all participants, significant changes were observed in several parameters compared with baseline; however, no significant differences were found between the groups. Similar trends were observed in both the healthy subgroup and the constipation-prone subgroup.
The results of the blood biochemical tests are presented in Table 5.Table 5. Biochemical blood tests.Table 5. Intervention periodPost ObservationItemsreferenceGroup0 W2 W4 W6 Wvalues†BGBABGBABGBABGOverallTotal protein (g/dL)6.7~8.3Placebo7.25±0.307.24±0.40NS7.29±0.36NS7.23±0.40NSCP23057.24±0.38NS7.19±0.38NSNS7.29±0.40NSNS7.33±0.34NSNSAlbumin (g/dL)3.8~5.3Placebo4.60±0.204.60±0.26NS4.63±0.26NS4.58±0.25NSCP23054.66±0.29NS4.61±0.25NSNS4.69±0.28NSNS4.65±0.28NSNSTotal bilirubin (mg/dL)0.2~1.2Placebo0.70±0.390.68±0.62NS0.64±0.27NS0.60±0.29CP23050.67±0.21NS0.66±0.26NSNS0.66±0.24NSNS0.63±0.21NSNSAST(GOT) (U/L)8~38Placebo22.7±8.020.7±4.9NS22.2±4.6NS22.1±4.9NSCP230519.5±3.8NS19.3±3.3NSNS20.8±5.4NS20.0±4.7NSNSALT(GPT) (U/L)4~44Placebo23.4±19.419.7±10.5NS22.0±13.2NS22.0±13.1NSCP230517.1±5.3NS18.0±5.8NSNS18.4±8.0NSNS18.5±6.6NSNSALP (U/L)105~330Placebo196.2±51.9192.0±47.4NS195.3±45.5NS203.0±62.2NSCP2305219.4±56.9NS208.3±49.0NSNS219.7±56.1NSNS223.2±63.0NSNSLD(LDH) (U/L)120~245Placebo180.5±20.3182.2±21.9NS191.9±18.4190.4±23.0CP2305175.2±20.4NS175.2±18.5NSNS185.2±23.5NS183.9±21.4*NSγ-GT (U/L)M:≦ 80以下Placebo32.2±23.429.7±19.5NS30.1±20.4NS37.5±49.7NSF:≦ 30以下CP230523.0±9.1NS23.3±9.9NSNS24.2±9.9NSNS24.7±11.0NSNSTotal cholestesterol (mg/dL)130~220Placebo214.0±34.5211.6±36.2NS216.4±37.8NS209.2±35.2NSCP2305214.7±37.5NS206.6±35.1NSNS209.5±38.5NSNS208.5±40.5NSNSHDL cholestesterol (mg/dL)M:40~90Placebo63.5±16.261.5±14.7NS63.0±15.9NS61.4±14.6NSF:40~100CP230563.5±15.5NS60.2±14.1NS60.8±14.5NS60.1±16.9NSLDL cholestesterol (mg/dL)70~139Placebo135.4±35.8133.8±39.0NS136.2±38.4NS132.5±34.9NSCP2305135.0±36.7NS127.2±34.8NS129.0±37.4NSNS129.2±37.0NSNSTriglyceride (mg/dL)30~149Placebo100.7±48.288.6±37.2NS99.7±72.1NS85.6±30.5CP2305103.1±70.5NS107.2±87.5NSNS103.5±63.6NSNS108.4±66.2NSNSUrin acid (mg/dL)2.0~7.0Placebo5.31±1.185.19±1.08NS5.03±1.165.37±1.15NSCP23054.99±1.34NS4.87±1.10NSNS4.86±1.11NSNS5.02±1.01NSNSUrea nitrogen (mg/dL)8.0~20.0Placebo13.25±3.7013.19±3.24NS13.18±2.78NS13.69±2.68NSCP230513.05±2.57NS12.60±3.23NSNS12.35±2.68NSNS13.08±2.79NSNSCreatinine (mg/dL)M:0.66~1.11Placebo0.810±0.1220.788±0.110NS0.780±0.1390.808±0.141NSF:0.50~0.86CP23050.812±0.109NS0.780±0.096NS0.793±0.130NSNS0.790±0.104NSNa (mEq/L)137~147Placebo141.1±1.2141.8±1.7NS141.3±2.0NS141.4±1.8NSCP2305141.0±1.3NS141.8±1.7NS142.0±1.4NS141.3±1.6NSNSK (mEq/L)3.5~5.0Placebo4.13±0.354.08±0.34NS4.05±0.39NS3.77±0.33CP23054.18±0.28NS4.15±0.26NSNS3.92±0.32NS4.02±0.42NS#Cl (mEq/L)98~108Placebo101.6±1.4102.0±1.7NS101.9±2.0NS101.8±1.5NSCP2305101.8±1.3NS102.2±1.9NSNS102.1±1.6NSNS101.5±1.9NSNSBlood glucose level (mg/dL)70~109Placebo86.1±8.989.6±8.791.4±9.989.0±7.8CP230583.5±7.9NS85.6±7.2NS87.3±8.5NS85.0±7.0NSNSInsulin (μU/mL)1.1~17.0Placebo7.04±13.606.47±7.74NS7.59±13.33NS5.80±7.34NSCP23054.53±3.54NS4.19±3.19NSNS4.34±3.20NSNS5.17±4.07NSNSHbA1c (%)4.6~6.2Placebo5.25±0.295.33±0.27**5.32±0.275.29±0.29NSCP23055.25±0.39NS5.27±0.37NSNS5.26±0.38NSNS5.21±0.38NSNSvalues†BGBABGBABGBABGHealthy subjectTotal protein (g/dL)6.7~8.3Placebo7.15±0.297.13±0.39NS7.14±0.31NS7.08±0.37NSCP23057.26±0.41NS7.24±0.34NSNS7.32±0.38NSNS7.29±0.34NSNSAlbumin (g/dL)3.8~5.3Placebo4.62±0.234.61±0.27NS4.63±0.25NS4.58±0.19NSCP23054.69±0.31NS4.61±0.23NSNS4.68±0.29NSNS4.59±0.30NSTotal bilirubin (mg/dL)0.2~1.2Placebo0.79±0.460.74±0.78NS0.68±0.31NS0.63±0.33CP23050.69±0.24NS0.66±0.30NSNS0.70±0.24NSNS0.65±0.22NSNSAST(GOT) (U/L)8~38Placebo21.8±7.120.1±5.1NS22.2±5.1NS21.8±4.9NSCP230519.9±4.6NS19.0±3.3NSNS21.3±6.4NSNS20.1±5.4NSNSALT(GPT) (U/L)4~44Placebo22.2±18.218.8±11.7NS22.6±15.7NS21.1±13.7NSCP230517.8±5.9NS17.9±6.3NSNS19.9±9.2NSNS19.1±7.3NSNSALP (U/L)105~330Placebo190.0±47.6186.6±47.4NS189.5±46.8NS184.0±44.0NSCP2305209.8±45.7NS203.4±41.4NSNS211.6±45.3NSNS211.1±43.9NSNSLD(LDH) (U/L)120~245Placebo181.7±19.8182.5±18.1NS191.5±13.5189.3±19.7NSCP2305174.1±20.9NS175.5±17.4NSNS186.1±24.7NS182.4±24.0NSγ-GT (U/L)M:≦ 80Placebo31.7±24.127.8±18.0NS28.4±18.5NS28.7±18.5NSF:≦ 30CP230523.4±10.2NS22.4±8.7NSNS24.1±9.1NSNS23.2±10.1NSNSTotal cholestesterol (mg/dL)130~220Placebo219.5±33.8214.1±34.7NS218.8±37.0NS211.2±33.9NSCP2305217.9±35.4NS207.4±27.6NSNS211.1±34.8NSNS202.6±38.7NSHDL cholestesterol (mg/dL)M:40~90Placebo67.8±16.665.8±16.1NS66.5±17.8NS64.7±15.3NSF:40~100CP230565.1±13.9NS61.5±10.9NS62.1±11.4NS60.3±13.7NSLDL cholestesterol (mg/dL)70~139Placebo138.2±34.2133.2±35.8NS136.6±34.7NS131.8±33.2NSCP2305136.9±34.1NS130.2±29.9NSNS130.6±34.0NSNS124.5±36.0NSTriglyceride (mg/dL)30~149Placebo89.4±42.880.4±38.7NS100.4±90.3NS81.8±33.0NSCP2305109.4±72.4NS95.6±57.5NSNS95.9±57.5NSNS98.4±55.7NSNSUrin acid (mg/dL)2.0~7.0Placebo5.43±1.295.18±1.25NS5.14±1.315.46±1.29NSCP23055.06±1.28NS4.96±0.82NSNS4.99±0.86NSNS5.06±0.86NSNSUrea nitrogen (mg/dL)8.0~20.0Placebo13.14±4.3413.15±3.34NS13.48±3.14NS13.72±3.01NSCP230513.30±2.21NS12.86±3.33NSNS12.64±2.16NSNS13.64±3.09NSNSCreatinine (mg/dL)M:0.66~1.11Placebo0.815±0.1270.800±0.109NS0.795±0.141NS0.813±0.142NSF:0.50~0.86CP23050.793±0.101NS0.763±0.078NS0.778±0.123NSNS0.774±0.098NSNSNa (mEq/L)137~147Placebo141.2±1.1141.3±1.3NS140.8±1.9NS141.5±1.6NSCP2305141.2±0.9NS142.0±1.4NS142.1±1.4NS141.4±1.4NSNSK (mEq/L)3.5~5.0Placebo4.02±0.273.96±0.21NS3.95±0.30NS3.64±0.28CP23054.16±0.31NS4.09±0.25NSNS4.01±0.36NSNS3.95±0.37NS#Cl (mEq/L)98~108Placebo101.5±1.2101.4±1.6NS101.5±2.2NS101.8±1.6NSCP2305102.2±1.1NS102.6±1.5NS#102.4±1.7NSNS102.1±1.7NSNSBlood glucose level (mg/dL)70~109Placebo84.1±6.888.6±9.891.2±11.786.8±7.2**CP230583.4±7.0NS84.6±6.6NSNS86.0±7.4NS83.8±6.4NSNSInsulin (μU/mL)1.1~17.0Placebo3.95±1.855.09±3.23NS9.57±16.85NS4.42±1.95NSCP23054.44±2.78NS4.90±3.79NSNS4.44±3.52NSNS5.71±4.68NSNSHbA1c (%)4.6~6.2Placebo5.18±0.275.28±0.245.28±0.225.26±0.24NSCP23055.26±0.41NS5.29±0.39NSNS5.29±0.39NSNS5.23±0.41NSNSConstipated subjectTotal protein (g/dL)6.7~8.3Placebo7.43±0.247.43±0.37NS7.53±0.31NS7.49±0.30NSCP23057.20±0.35NS7.11±0.45NSNS7.23±0.46NSNS7.41±0.34NSNSAlbumin (g/dL)3.8~5.3Placebo4.59±0.164.59±0.28NS4.63±0.31NS4.56±0.35NSCP23054.61±0.25NS4.61±0.31NSNS4.70±0.28NSNS4.75±0.23NSNSTotal bilirubin (mg/dL)0.2~1.2Placebo0.56±0.140.59±0.16NS0.59±0.21NS0.54±0.19NSCP23050.64±0.15NS0.66±0.21NSNS0.59±0.23NSNS0.60±0.20NSNSAST(GOT) (U/L)8~38Placebo24.1±9.721.6±4.5NS22.1±3.8NS22.8±5.0NSCP230518.9±2.0NS19.9±3.4NSNS20.0±3.2NSNS19.9±3.7NSNSALT(GPT) (U/L)4~44Placebo25.4±22.421.0±8.9NS21.1±8.6NS23.4±12.9NSCP230516.0±4.1NS18.1±5.1NSNS15.9±5.0NSNS17.6±5.4NSNSALP (U/L)105~330Placebo206.3±60.2200.6±49.2NS204.6±44.7NS233.9±77.4NSCP2305236.1±72.9NS216.8±62.3NSNS233.8±72.6NSNS244.5±86.7NSNSLD(LDH) (U/L)120~245Placebo178.5±22.4181.9±28.4NS192.5±25.6192.3±29.0**CP2305177.1±20.7NS174.8±21.7NSNS183.5±22.9NSNS186.5±17.1NSNSγ-GT (U/L)M:≦ 80Placebo33.1±23.832.8±22.6NS33.0±24.1NS51.9±78.1NSF:≦ 30CP230522.3±7.7NS24.9±12.3NSNS24.3±11.9NSNS27.4±12.7NSNSTotal cholestesterol (mg/dL)130~220Placebo205.0±36.0207.6±40.6NS212.5±41.4NS205.9±39.3NSCP2305209.1±42.8NS205.4±47.6NSNS206.6±46.8NSNS218.8±44.2NSNSHDL cholestesterol (mg/dL)M:40~90Placebo56.4±13.454.5±9.1NS57.3±10.7NS56.0±12.3NSF:40~100CP230560.9±18.6NS58.0±19.2NSNS58.6±19.4NSNS59.8±22.6NSNSLDL cholestesterol (mg/dL)70~139Placebo131.0±40.2134.6±46.4NS135.6±46.4NS133.6±39.9NSCP2305131.5±43.0NS121.9±43.9NSNS126.3±45.0NSNS137.4±39.9NSNSTriglyceride (mg/dL)30~149Placebo119.0±53.6101.9±32.8NS98.5±29.3NS91.9±26.8NSCP230592.0±70.4NS127.6±126.8NSNS116.9±75.3NS125.8±82.7NSUrin acid (mg/dL)2.0~7.0Placebo5.11±1.045.19±0.83NS4.86±0.92NS5.23±0.94NSCP23054.88±1.53NS4.70±1.52NSNS4.63±1.50NSNS4.94±1.29NSNSUrea nitrogen (mg/dL)8.0~20.0Placebo13.44±2.6213.25±3.28NS12.69±2.17NS13.63±2.23NSCP230512.61±3.22NS12.13±3.22NSNS11.86±3.52NSNS12.09±1.98NSNSCreatinine (mg/dL)M:0.66~1.11Placebo0.804±0.1230.768±0.1160.755±0.1430.799±0.148NSF:0.50~0.86CP23050.846±0.122NS0.811±0.120**NS0.819±0.147NSNS0.819±0.115NSNSNa (mEq/L)137~147Placebo141.1±1.6142.6±2.0142.0±2.1NS141.4±2.2NSCP2305140.6±1.8NS141.4±2.2NSNS141.6±1.4NSNS141.1±2.0NSNSK (mEq/L)3.5~5.0Placebo4.31±0.404.28±0.43NS4.21±0.49NS3.98±0.32CP23054.20±0.23NS4.24±0.27NSNS3.78±0.16**#4.15±0.49NSNSCl (mEq/L)98~108Placebo101.6±1.8102.9±1.4102.4±1.7NS101.9±1.2NSCP2305101.1±1.2NS101.5±2.3NSNS101.8±1.5NSNS100.3±1.7NS#Blood glucose level (mg/dL)70~109Placebo89.5±11.291.3±6.8NS91.8±6.9NS92.5±7.7NSCP230583.8±9.7NS87.3±8.4NSNS89.6±10.3NSNS87.0±7.9NSNSInsulin (μU/mL)1.1~17.0Placebo12.08±21.818.71±11.99NS4.36±1.29NS8.04±11.76NSCP23054.69±4.81NS2.94±0.99NSNS4.18±2.79NSNS4.23±2.70NSNSHbA1c (%)4.6~6.2Placebo5.38±0.315.43±0.32NS5.39±0.34NS5.33±0.38NSCP23055.23±0.39NS5.24±0.36NSNS5.23±0.37NSNS5.19±0.36NSNSAll values are "mean ± standard deviation"**:Significant difference compared to 0 W(p < 0.01)*:Significant difference compared to 0 W(p < 0.05)##:Significant difference between the groups(p < 0.01)#:Significant difference between the groups(p < 0.05)NS:No significant difference†:The reference values are those from the time of testing (2016).BA:Significance test in comparison with 0 WBG:Testing for significance between groups
In the analysis of all participants, significant changes were observed in several parameters compared with baseline, and a significant between-group difference was found for potassium at 6 W (p = 0.032). Among healthy subjects, significant changes were also observed in several parameters compared with baseline, with a significant between-group difference in potassium at 6 W (p = 0.021). Similarly, in the constipation-prone subgroup, significant within-group changes were observed in multiple parameters, and significant between-group differences were detected for potassium at 4 W (p = 0.029) and for chloride at 6 W (p = 0.045).
Urinalysis
3.4
No significant differences were observed between the groups in urinalysis results (Table 6).Table 6. Urinalysis.Table 6. Intervention periodPost ObservationItemsreferenceGroup0 W2 W4 W6 Wvalues†BGBABGBABGBABGOverallurine protein(-)Placebo(-):19 (+-):2(-):17 (+-):2 (+):2(-):20 (+-):1(-):18 (+-):2 (+):1CP2305(-):18 (+-):3 (+):1(-):18 (+-):4(-):22(-):21 (+-):1Urine glucose (qualitative)(-)Placebo(-):21(-):21(-):21(-):21CP2305(-):22(-):22(-):22(-):22Urobilinogen(+-)Placebo(+-):21(+-):21(+-):21(+-):21CP2305(+-):22(+-):22(+-):22(+-):21 (+):1Urinary bilirubin(-)Placebo(-):21(-):21(-):21(-):21CP2305(-):22(-):22(-):22(-):22Urinary ketones(-)Placebo(-):21(-):21(-):21(-):19 (+):2CP2305(-):20 (+):2(-):22(-):22(-):22Urine occult blood(-)Placebo(-):19 (+-):1 (++):1(-):17 (+-):3 (+):1(-):15 (+-):3 (+):2 (++):1(-):20 (+-):1CP2305(-):17 (+-):2 (++):1 (+++):2(-):18 (+-):2 (+):2(-):19 (++):1 (+++):2(-):21 (+):1Urine pH5.0~7.5Placebo6.17±0.806.02±0.66NS6.36±0.81NS6.10±0.74NSCP23056.52±0.91NS6.05±0.79NSNS6.02±0.63NS6.16±0.71NSNSUrine specific gravity1.006~1.030Placebo1.0153±0.00811.0160±0.0084NS1.0140±0.0075NS1.0174±0.0081NSCP23051.0130±0.0082NS1.0165±0.0086NS1.0145±0.0097NSNS1.0157±0.0086NSNSHealthy subjecturine protein(-)Placebo(-):12 (+-):1(-):11 (+-):1 (+):1(-):12 (+-):1(-):11 (+-):2CP2305(-):12 (+-):2(-):12 (+-):2(-):14(-):13 (+-):1Urine glucose (qualitative)(-)Placebo(-):13(-):13(-):13(-):13CP2305(-):14(-):14(-):14(-):14Urobilinogen(+-)Placebo(+-):13(+-):13(+-):13(+-):13CP2305(+-):14(+-):14(+-):14(+-):13 (+):1Urinary bilirubin(-)Placebo(-):13(-):13(-):13(-):13CP2305(-):14(-):14(-):14(-):14Urinary ketones(-)Placebo(-):13(-):13(-):13(-):12 (+):1CP2305(-):13 (+):1(-):14(-):14(-):14Urine occult blood(-)Placebo(-):12 (+-):1(-):12 (+-):1(-):9 (+-):1 (+):2 (++):1(-):12 (+-):1CP2305(-):11 (+-):1 (++):1 (+++):1(-):13 (+):1(-):12 (++):1 (+++):1(-):13 (+):1Urine pH5.0~7.5Placebo6.19±0.905.96±0.48NS6.35±0.92NS5.96±0.69NSCP23056.57±1.02NS5.86±0.74NS6.00±0.71NSNS6.14±0.74NSNSUrine specific gravity1.006~1.030Placebo1.0154±0.00901.0183±0.0080NS1.0147±0.0083NS1.0188±0.0083NSCP23051.0129±0.0078NS1.0181±0.0086NS1.0168±0.0104NS1.0179±0.0090NSNSConstipated subjecturine protein(-)Placebo(-):7 (+-):1(-):6 (+-):1 (+):1(-):8(-):7 (+):1CP2305(-):6 (+-):1 (+):1(-):6 (+-):2(-):8(-):8Urine glucose (qualitative)(-)Placebo(-):8(-):8(-):8(-):8CP2305(-):8(-):8(-):8(-):8Urobilinogen(+-)Placebo(+-):8(+-):8(+-):8(+-):8CP2305(+-):8(+-):8(+-):8(+-):8Urinary bilirubin(-)Placebo(-):8(-):8(-):8(-):8CP2305(-):8(-):8(-):8(-):8Urinary ketones(-)Placebo(-):8(-):8(-):8(-):7 (+):1CP2305(-):7 (+):1(-):8(-):8(-):8Urine occult blood(-)Placebo(-):7 (++):1(-):5 (+-):2 (+):1(-):6 (+-):2(-):8CP2305(-):6 (+-):1 (+++):1(-):5 (+-):2 (+):1(-):7 (+++):1(-):8Urine pH5.0~7.5Placebo6.13±0.646.13±0.92NS6.38±0.64NS6.31±0.80NSCP23056.44±0.73NS6.38±0.79NSNS6.06±0.50NSNS6.19±0.70NSNSUrine specific gravity1.006~1.030Placebo1.0153±0.00691.0121±0.0080NS1.0129±0.0061NS1.0153±0.0078NSCP23051.0131±0.0095NS1.0136±0.0085NSNS1.0106±0.0071NSNS1.0119±0.0070NSNS**:Significant difference compared to 0 W(p < 0.01):Significant difference compared to 0 W(p < 0.05)##:Significant difference between the groups(p < 0.01)#:Significant difference between the groups(p < 0.05)NS:No significant difference†:The reference values are those from the time of testing (2016).BA:Significance test in comparison with 0 WBG:Testing for significance between groups
Medical questionnaire and daily report
3.5
Subjective symptoms reported during the study period are summarized in Table 7.Table 7. List of subjective symptoms.Table 7intaked foodSubject No.SexSymptoms (background information, etc.) <Medication information>Date of onsetGradeCausal relationship with test food intakePlacebo104MaleLoose stools (disappeared after bowel movements around 10:00, possibly due to lack of sleep)Day 1 and 2 of intakeMildWith the exception of gas production, most of the symptoms were thought to be due to chronic fatigue or the effects of dietary content, but none of them were serious and were transient, or were observed in the follow-up observation period, so **there was no causal relationship with the intake of the test food.**Fatigue (resolved after bowel movements around 10:00, possibly due to lack of sleep)Day 1 of intakeMildGas (disappears after bowel movements, possibly due to fatigue)Day 2 of intakeMild[Case excluded from analysis because the intake rate was below the specified value]Gas (maybe it was because of the ramen I had for lunch, but I'm not sure)Day 6 of intakeMildFatigue (all day, cause unknown)Day 10 of intakeMildStomach pain (due to gas buildup after ingestion. I went to the toilet several times before recovering. This may be because I was hungry and ate beef bowl before ingesting it)Day 14 of intakeMildUrge to defecate (I had frequent urges in the morning and went to the toilet on about five floors in two hours. It wasn't diarrhea, but it was uncomfortable. The cause was unknown. The test food was not the cause. It got better in the afternoon.)Day 15 of intakeMildAbdominal pain → diarrhea (may be caused by the milk at breakfast. No test food was ingested at this point)Day 17 of intakeMildFever (38°C fever, not severe stomach pain, but went to the toilet about 5 times in 2 h. Not diarrhea, but still uncomfortable. Probably due to cold symptoms)Day 22 of intakeMildGas buildup (I had gas buildup in the afternoon and had to go to the toilet several times. Each time it was relieved, but the discomfort continued.)Day 24 of intakeMildFrequent gas (after going to bed. Feeling bloated.)Day 25 of intakeMildFatigue (I also had to defecate in the morning. I had not taken the test food at this point. I felt a little better after lunch, but the fatigue persisted. The cause is unknown, but it is thought to be because I had not yet fully recovered from my cold.)Day 26 of intakeMildUrge to defecate (going to the toilet three times in the morning. Frequent urge to defecate but not diarrhea)Day 27 of intakeMildUrge to defecate (I went to the toilet frequently in the morning. It wasn't diarrhea, but I felt uncomfortable. This may have been due to the effects of eating.)Post-observation day 13MildStomach pain (the cause is unknown, but I haven't eaten anything unusual)Post-observation day 15Mild114FemaleHeadache (aftereffects of the accident, sometimes painful depending on the weather) <Taking headache medicine>Day 19 of intakeMildSince the cause of the symptoms is known and the treatment is for that symptom, **there is no causal relationship with the intake of the test food.**115FemaleStomach pain (maybe caused by eating dinner around 9 pm) <Take 1 packet of Pansilon>Day 17 of intakeMildSince this is a symptom and treatment that may be affected by food, there is no causal relationship with the intake of the test food.Runny nose, sneezing, cough (hay fever) <Take Talion Tablets 10 mg and Pranlukast Tablets 225 "EK">Post-observation day 10 & 11MildThis was a treatment for seasonal allergies, and there was no causal relationship with the intake of the test food due to the post-observation period.116FemaleMouth ulcers (bite during dinner) <Take 2 tablets of Hythiol B>Day 20 & 21 of intakeMildSince the cause of the symptoms is known and the treatment is for that symptom, **there is no causal relationship with the intake of the test food.**117FemaleGas (I think it's because I drank this)Day 2~25 of intakeMildAlthough the gas produced by the test food cannot be ruled out as a causal relationship, it is not a serious symptom and is not a problem. The other symptoms were transient and disappeared naturally without worsening, so **there is no causal relationship to the test food.**Belly rollingDay 6 & 7 of intakeMildLoss of appetite, diarrhea, fatigueDay 26 of intakeMildDifficulty passing stoolDay 27 of intakeMild122FemalediarrheaDay 2 of intakeMildIt was determined that there was no problem because it was thought that the increase in fluid intake during excessive intake of the test food was related to the subject's habituation to the amount of fluid, and because this was a transient symptom that occurred when the subject experienced a defecation urge due to constipation.Abdominal pain (unknown cause, abdominal pain associated with defecation)Day 2 & 3 of intakeMildabdominal bloatingDay 6 & 7 of intakeMildCP2305210maleSlight diarrhea (due to eating too many vegetables)Day 11 of intakeMildThe cause of the symptoms is known, so **there is no causal relationship with the intake of the test food.**212FemaleRunny nose, cough, fatiguePost-observation day 8~12MildThese were transient cold symptoms and were not a problem, with no causal relationship to the intake of the test food.214FemaleHeadache (menstrual origin; symptoms present before ingestion)Day 0 of intakeMildSince the symptoms were menstrual, there was no problem and **no causal relationship with the intake of the test food.**Nausea (menstrual origin; symptoms present before ingestion)Day 1 of intakeMildFeeling tired? <Tiovita Drink>Day 6, 16 & 27 of intake、MildThis was a transient symptom that was also observed during the follow-up period, and use of the drink to improve it was not a problem, and **there was no causal relationship with the intake of the test food.**Post-observation day 10Feeling a bit sick? ≪Tiovita Drink≫Day 9 of intakeMildThe symptoms were transient, and the drink was used to improve the symptoms without any problems, and **there was no causal relationship with the intake of the test food.**Headache <Take one packet of Hedek Powder>Day 8, 9 & 15 of intakeMildAlthough the cause is unknown, the symptoms were short-term and were resolved with medication, so there is no problem and **no causal relationship with the intake of the test food.**slight feverDay 15, 19 & 25 of intakeMildThis appears to be a temporary early symptom of a cold, so there is no problem and **no causal relationship with the intake of the test food.**fatigueDay 16 of intakeMildThis was a transient symptom that was also observed during the follow-up period, so there was no problem and **no causal relationship with the intake of the test food.**Post-observation day 10Fatigue (menstrual origin)Day 19 of intakeMildSince the symptoms were menstrual, there was no problem and **no causal relationship with the intake of the test food.**Sore throat (25th and 26th days after taking Benzablock L tablets)Day 20, 21 & 25 of intakeMildThis was due to transient cold symptoms that occurred from the end of the test food intake period through the post-observation period, and was treated accordingly, so there was no problem and **no causal relationship with the intake of the test food.**Runny nose (taking Benzablock S tablets)Day 22 of intakeMildfeverDay 26 of intakeMildCough (observation days 2 and 3 after taking Benzablock L tablets)Post-observation day 10後観察2~5日目MildphlegmPost-observation day 10後観察2、3、6日目Mild215FemaleAbdominal pain (menstrual origin)Day 18 & 19 of intakeMildSince the symptoms were menstrual, there was no problem and **no causal relationship with the intake of the test food.**216FemaleHard stools (cause unknown)Day 6, 25 & 26 of intakeMildThe cause is unknown, and although a connection to the test food cannot be denied, it is a short-term symptom and is therefore not considered a problem.Difficulty passing stool (cause unknown)Day 10 & 23 of intakeMild219FemaleHeadache (possibly due to stiff shoulders or menstruation) <Taking Eve A tablets>Day 21 of intakeMildSince the cause of the symptoms is known and the treatment is for that symptom, there is no causal relationship with the intake of the test food.Abdominal pain (menstrual origin) < <2nd day of observation after taking Eve A tablets> >Day 28 of intakeMildSince the symptoms were menstrual, there was no problem and there was no causal relationship with the intake of the test food due to the observation period.Post-observation day 0 &2Mild stomach pain (overeating)Post-observation day 4MildThe cause of the symptoms is known, and there is no causal relationship with the intake of the test food because the condition is still in the observation period.Cough (Estac Ive, post-observation days 8–11)Post-observation day 8~14MildAll of these were cold symptoms and treatments, and there was no problem. As this was a follow-up observation period, **there was no causal relationship with the intake of the test food.**snotPost-observation day 10MildheadachePost-observation day 12MildTiredPost-observation day 13Mild
In the placebo group, five subjects experienced one case each of headache, stomach pain, stomatitis, gas, stomach upset, loss of appetite, fatigue, difficulty in defecation, abdominal pain, or abdominal distension, as well as two cases of diarrhea during the study tablets ingestion period. During the follow-up period, one subject experienced a runny nose, sneezing, and cough. In the subgroup of constipated patients, diarrhea was observed in one male patient (#122) in the placebo group. In the CP2305 group, six subjects one case each of experienced mild diarrhea, nausea, cold-like symptoms, fatigue, sore throat, runny nose, hard stool, or difficulty in defecation, and two cases each of fatigue, headache, fever, and abdominal pain. During the follow-up period, one subject experienced phlegm, mild stomach pain, abdominal pain, and headache; two subjects reported runny nose and fatigue; and three subjects reported cough. One subject who was excluded from the analysis (male, No. 104 in the placebo group) also experienced symptoms similar to those of the other participants, such as gas and abdominal pain, both before and after ingestion of the study tablets. None of these symptoms were judged to be causally related to ingestion of the study tablets. Furthermore, no abnormal findings were observed during the physician’s medical examinations.
Discussion
4
This study investigated the safety of L. gasseri CP2305 tablets administered to healthy Japanese adults over a four-week period. Both groups received 20 tablets daily—either L. gasseri CP2305 tablets or placebo tablets. Safety was evaluated based on physical examinations, urinalysis, hematology, blood biochemistry, and subjective symptoms recorded in daily diaries.
In the physical examinations, no significant differences were observed between the groups in the overall analysis. In the subgroup analysis, systolic blood pressure was significantly higher in the CP2305 group at 2 W among healthy subjects. However, the mean value (125.8 ± 15.1 mmHg) remained below the reference threshold (<130 mmHg) and was therefore not considered clinically relevant from a safety standpoint. In addition, diastolic blood pressure was significantly higher in the placebo group among subjects prone to constipation; however, the mean value (84.1 ± 16.0 mmHg) was also below the reference threshold (<85 mmHg), indicating no safety concern. Although significant decreases in body weight and body fat percentage were observed before and after intake, these changes were small and showed no significant between-group differences, suggesting no safety implications. In addition, among healthy subjects, BMI showed a significant decrease in both the CP2305 and placebo groups. Because this change occurred similarly in both groups, it is considered to reflect seasonal or behavioral factors, such as natural fluctuations in daily activity levels, rather than any effect of the study tablets. A review of individual data revealed that a few participants had BMI or blood pressure values exceeding the reference limits; however, the number of such cases did not increase meaningfully after ingestion, indicating no effect attributable to the study tablets.
In hematological tests, no significant between-group differences were observed in either the overall or subgroup analyses. Although several parameters showed significant pre- to post-intake changes, all remained within normal ranges and were not considered clinically meaningful. Occasional outliers were observed, but the number of such cases did not increase notably after ingestion, indicating no influence of the study tablets.
In the blood biochemical tests, potassium levels were significantly higher in the CP2305 group at 6 W (post-observation period) in the overall analysis. In the subgroup analysis of healthy subjects, chloride at 2 W and potassium at 6 W were both significantly higher in the CP2305 group. In contrast, in subjects prone to constipation, potassium at 4 W and chloride at 6 W were significantly higher in the placebo group. Although several parameters showed significant pre- and post-intake changes, these variations were minor, transient, and within the normal range. They occurred in both groups, were not correlated with other related indicators, and were therefore not considered adverse effects associated with the study tablets.
Urinalysis revealed no significant between-group differences in quantitative parameters. Similarly, no notable between-group differences were observed in the number of subjects outside the reference limits for qualitative parameters. Although significant pre- and post-intake fluctuations were noted in urine specific gravity and pH, these changes were small and within the reference range, indicating no safety concern. A few subjects showed urinary occult blood levels of (±) or higher. But except for subject No. 111, who showed (±) result, all were female and likely influenced by menstruation. In subject No. 111, the result was deemed a false positive and transient, thus not considered clinically relevant.
Regarding subjective symptoms, a total of 14 events were reported by five subjects in the placebo group and 29 events by six subjects in the CP2305 group, including those reported during the post-observation period. All symptoms were mild, and no cases were considered to have a causal relationship with the study tablets, indicating that the product was safe. One excluded subject (No. 104, male, in the control group) reported abdominal symptoms during both the ingestion and post-observation periods; however, because these symptoms persisted even after ingestion ceased (up to day 15 of the post-observation period), a causal relationship with the study tablets was ruled out. In the subgroup of constipated patients, diarrhea was observed in one male patient (#122) in the placebo group, but no worsening of constipation was observed.
Overall, no safety concerns were identified in the physical examinations, hematology, blood biochemistry, urinalysis, or subjective symptoms. These findings confirm the safety of excessive intake of L. gasseri CP2305 tablets (10 times the recommended daily dose).
Conclusion
5
This study evaluated the safety of daily ingestion of 20 Lactobacillus gasseri CP2305 tablets (1.0 × 10 ¹¹ L. gasseri CP2305 cells/day) in healthy Japanese adults and individuals prone to constipation. No safety concerns were identified. These findings support the safety of L. gasseri CP2305 tablets, even when ingested at a dose ten times higher than the usual amount.
Funder
Asahi Group Holdings Ltd.
CRediT authorship contribution statement
Kazuhiko Takano: Supervision, Project administration, Investigation. Hiroki Miyashita: Writing – review & editing, Writing – original draft, Visualization, Validation, Software, Formal analysis, Data curation. Tatsuhiko Hirota: Writing – review & editing. Koji Mochizuki: Writing – review & editing, Supervision, Resources. Daisuke Sawada: Writing – review & editing. Hajime Fuchida: Writing – review & editing, Writing – original draft, Resources, Conceptualization.
Declaration of Competing Interest
This study was sponsored by the following companies: Asahi Group Holdings, Ltd., which funded the study and its implementation, and Asahi Quality and Innovations, Ltd., which funded the manuscript preparation. H. F., K. M., D. S., and T. H. are employees of Asahi Quality and Innovations, Ltd. Asahi Group Holdings, Ltd., and Asahi Quality and Innovations, Ltd. entrusted the study operations to Clinical Support Corporation. H. M. is an employee of Clinical Support Corporation. Clinical Support Corporation was involved in the planning and implementation of the study as well as in manuscript preparation. Furthermore, K. T. (MD) served as the principal investigator and monitored all subjects’ conditions.
The reference list from the paper itself. Each links out to its DOI / PubMed record.
- 1Qin J.Li R.Raes J.Arumugam M.Burgdorf K.S.Manichanh C.Nielsen T.Pons N.Levenez F.Yamada T.Mende D.R.Li J.Xu J.Li S.Li D.Cao J.Wang B.Liang H.Zheng H.Xie Y.Tap J.Lepage P.Bertalan M.Batto J.-M.Hansen T.Le Paslier D.Linneberg A.Nielsen H.B.Pelletier E.Renault P.Sicheritz-Ponten T.Turner K.Zhu H.Yu C.Li S.Jian M.Zhou Y.Li Y.Zhang X.Li S.Qin N.Yang H.Wang J.Brunak S.DoréJ.Guarner F.Kristiansen K.Pedersen O.Parkhill J.Weissenbach J.Bork P.Ehrlich S.D.Wang J.A human gut microbial gene catalogue established by metagenomic sequencing Nature 4642010596510.1 · doi ↗ · pubmed ↗
- 2Sonnenburg J.L.Bäckhed F.Diet-microbiota interactions as moderators of human metabolism Nature 5352016566410.1038/nature 1884627383980 PMC 5991619 · doi ↗ · pubmed ↗
- 3Ma L.Yan Y.Webb R.J.Li Y.Mehrabani S.Xin B.Sun X.Wang Y.Mazidi M.Psychological stress and gut microbiota composition: a systematic review of human studies Neuropsychobiology 82202324726210.1159/00053313137673059 · doi ↗ · pubmed ↗
- 4Odamaki T.Kato K.Sugahara H.Hashikura N.Takahashi S.Xiao J.-Z.Abe F.Osawa R.Age-related changes in gut microbiota composition from newborn to centenarian: a cross-sectional study BMC Microbiol 1620169010.1186/s 12866-016-0708-527220822 PMC 4879732 · doi ↗ · pubmed ↗
- 5Kelly J.R.Minuto C.Cryan J.F.Clarke G.Dinan T.G.Cross talk: the microbiota and neurodevelopmental disorders Front. Neurosci.11201749010.3389/fnins.2017.0049028966571 PMC 5605633 · doi ↗ · pubmed ↗
- 6Sugawara T.Sawada D.Ishida Y.Aihara K.Aoki Y.Takehara I.Takano K.Fujiwara S.Regulatory effect of paraprobiotic Lactobacillus gasseri CP 2305 on gut environment and function Microb. Ecol. Health Dis.2720163025910.3402/mehd.v 27.3025926979643 PMC 4793260 · doi ↗ · pubmed ↗
- 7Nishida K.Sawada D.Kawai T.Kuwano Y.Fujiwara S.Rokutan K.Para-psychobiotic Lactobacillus gasseri CP 2305 ameliorates stress-related symptoms and sleep quality J. Appl. Microbiol 12320171561157010.1111/jam.1359428948675 · doi ↗ · pubmed ↗
- 8Nishida K.Sawada D.Kuwano Y.Tanaka H.Rokutan K.Health benefits of Lactobacillus gasseri CP 2305 tablets in young adults exposed to chronic stress: a randomized, double-blind, placebo-controlled study Nutrients 11201910.3390/nu 11081859 PMC 672342031405122 · doi ↗ · pubmed ↗