Correction: Structural and spectroscopic basis of excitation energy transfer in microbial rhodopsins binding xanthophylls
Giacomo Salvadori, Piermarco Saraceno, Alisia Santomieri, Chris John, Laura Pedraza-González

TL;DR
This paper corrects a previous study on how microbial rhodopsins transfer energy when bound to xanthophylls.
Contribution
The correction addresses errors in the original study's structural and spectroscopic findings.
Findings
The correction clarifies the structural details of energy transfer in microbial rhodopsins.
Spectroscopic data was revised to improve accuracy in energy transfer mechanisms.
The updated analysis provides a more reliable basis for understanding xanthophyll-bound rhodopsins.
Abstract
Correction for “Structural and spectroscopic basis of excitation energy transfer in microbial rhodopsins binding xanthophylls” by Giacomo Salvadori et al., Chem. Sci., 2025, 16, 18423–18437, https://doi.org/10.1039/D5SC04961J.
Genes, proteins, chemicals, diseases, species, mutations and cell lines named across the full text — each resolved to its canonical identifier and authoritative record.
Click any figure to enlarge with its caption.
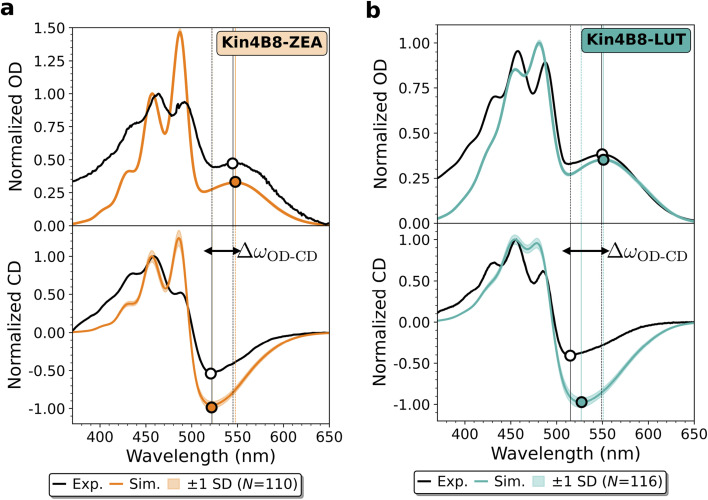 Figure 1
Peer Reviews
No public reviews on file for this paper yet. If you reviewed it on a platform where reviews are public (OpenReview, ICLR, NeurIPS, ICML), you can paste yours below so the community can read it here.
Videos
No videos yet. Explain this paper in a talk, walkthrough, or lecture? Add one.
Taxonomy
TopicsPhotoreceptor and optogenetics research · Photosynthetic Processes and Mechanisms · Advanced Fluorescence Microscopy Techniques
The authors regret that an error was present in the construction of the spectral densities employed in the simulations reported in the original article. Specifically, the low-frequency portion of the spectral density for both the retinal and the carotenoid were inadvertently truncated (frequencies <150 cm^−1^ for Kin4B8-lutein and <300 cm^−1^ for Kin4B8-zeaxanthin). This omission affected the vibronic structure of the carotenoid S_2_ state and consequently modified the simulated absorption and circular dichroism (CD) spectra, as well as the spectral overlap entering the Förster excitation energy transfer (EET) rates.
The corrected absorption and CD spectra, previously reported in Fig. 5 in the main text, are shown in the updated Fig. 5 herein.
The revised absorption spectra display modest but systematic differences relative to those originally published. In the Kin4B8-lutein complex, the relative intensity of the two carotenoid absorption peaks in the 450–500 nm region is altered: whereas the original spectra displayed peaks of comparable height, the corrected spectra exhibit a slightly enhanced intensity for the longer-wavelength peak. In addition, the carotenoid absorption maxima are blue-shifted by approximately 5 nm. A similar trend is observed for the Kin4B8-zeaxanthin complex, where the narrower peaks lead to slightly more pronounced differences. Despite these changes, the overall agreement between simulated and experimental absorption spectra remains good, and all conclusions regarding the reliability of our exciton model are preserved.
The CD spectra are affected in an analogous manner. For Kin4B8-lutein, the carotenoid CD features exhibit a 4–5 nm blue-shift, and the central positive lutein band near 480 nm becomes slightly more intense. The negative CD band at ∼525 nm becomes marginally deeper; however, its characteristic blue-shift relative to the rPSB absorption maximum, one of the key spectroscopic signatures of the Kin4B8-xanthophyll complexes, remains essentially unchanged. For Kin4B8-zeaxanthin, the corrections are even less pronounced, and the blue-shift slightly improves the peak positions.
Importantly, correcting the spectral density has a negligible impact on the computed EET times (τEET) and efficiencies (θEET). For Kin4B8-ZEA, the updated values are τEET = 60.1 ± 1.6 and θEET = 70.1 ± 0.5% (previously 59.1 ± 1.7 and 70.5 ± 0.6%, respectively). For Kin4B8-LUT, the revised values are τEET = 60.7 ± 3.5 and θEET = 70.4 ± 1.2% (previously 60.3 ± 3.5 and 70.5 ± 1.2%, respectively). The updated data are reported in Table S5 in the SI.
Overall, although the corrected spectral densities lead to minor quantitative changes in the simulated optical spectra, all qualitative trends and mechanistic conclusions reported in the original publication remain valid. In particular, the excitonic model continues to reproduce the key experimental observables, including the characteristic shift between the rPSB absorption maximum and the negative CD band, as well as the high EET efficiencies observed for both lutein and zeaxanthin.
In addition, in the original versions of Fig. S6b, S7b, S8b, and S9b, a factor of 2 was inadvertently omitted in the excitonic contribution to the CD spectra due to a plotting error. This issue affected only the graphical representation of the data; the underlying calculations were performed correctly. This can be verified by reconstructing the total CD spectrum as the sum of the individual chromophore contributions and the excitonic contribution, which reproduces the reported total spectrum.
The affected figures in the SI have been updated accordingly (Fig. S3 and S6–S10).
The Royal Society of Chemistry apologises for these errors and any consequent inconvenience to authors and readers.