Relief Zones Enhance the Durability of Ultrathin Membranes in Electrochemical Conversion Devices
Audrey K. Taylor, Megan McVeigh, Catherine Weiss, Kenneth C. Neyerlin

TL;DR
This paper introduces relief zones to improve the durability of ultrathin membranes in electrochemical devices like fuel cells.
Contribution
The novel use of relief zones to reduce mechanical stress and enhance membrane lifetime in MEAs.
Findings
Relief zones reduce nonuniform compression in MEAs, preventing mechanical degradation.
Fuel cell tests showed a 6-fold increase in membrane lifetime (∼1500 hours).
The method works without hardware changes, enabling better device integration.
Abstract
Premature failures in electrochemical conversion systems often result when membrane electrode assemblies (MEAs) use ultrathin (≤15 μm-thick) polymer electrolyte membranes, susceptible to mechanical degradation from stress concentrations arising from device-level integration. Herein, relief zones were developed to mitigate mechanical degradation by alleviating excess and nonuniform compression across active areas. Relief zones, created through ablation of carbonaceous diffusion media, enable seamless adaptation across MEA dimensions without need for hardware modifications. Demonstrated using fuel cells as a case study, accelerated stress tests revealed a 6-fold lifetime improvement (∼1500 h) compared to conventional edge-protected MEAs, decoupling device-level engineering effects from material limitations.
Genes, proteins, chemicals, diseases, species, mutations and cell lines named across the full text — each resolved to its canonical identifier and authoritative record.
Click any figure to enlarge with its caption.
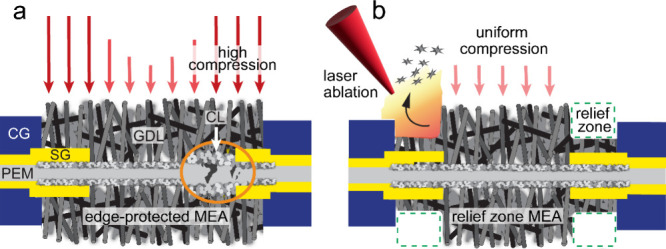 Figure 1
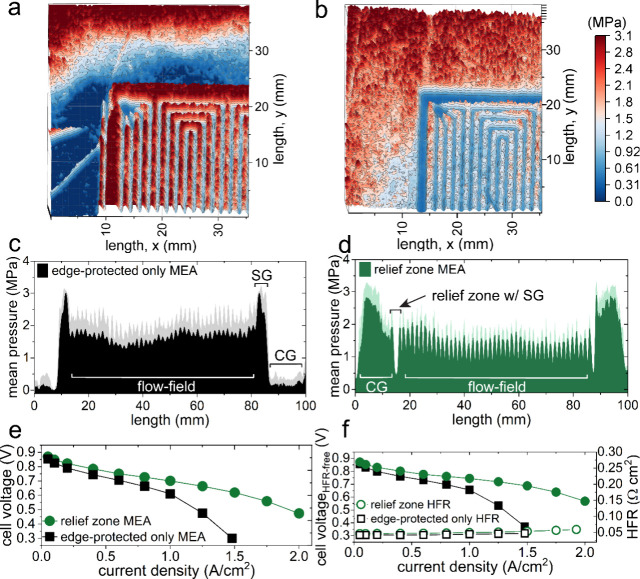 Figure 2
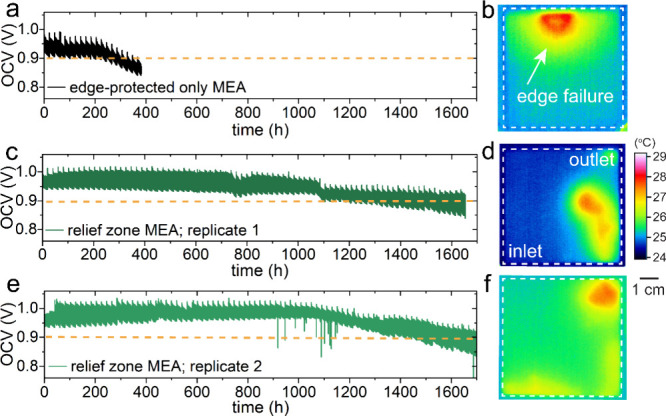 Figure 3
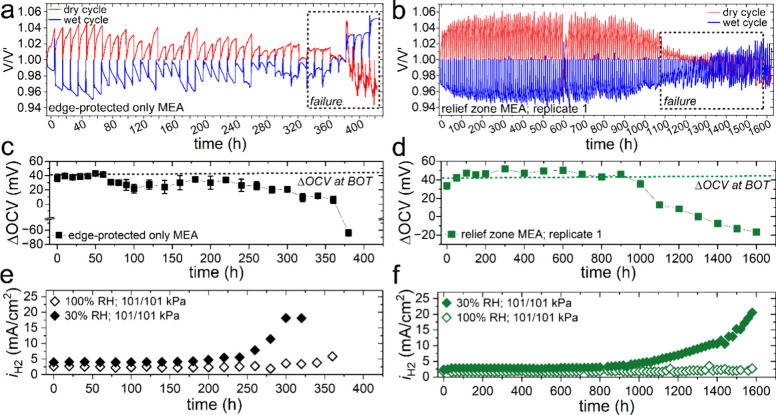 Figure 4
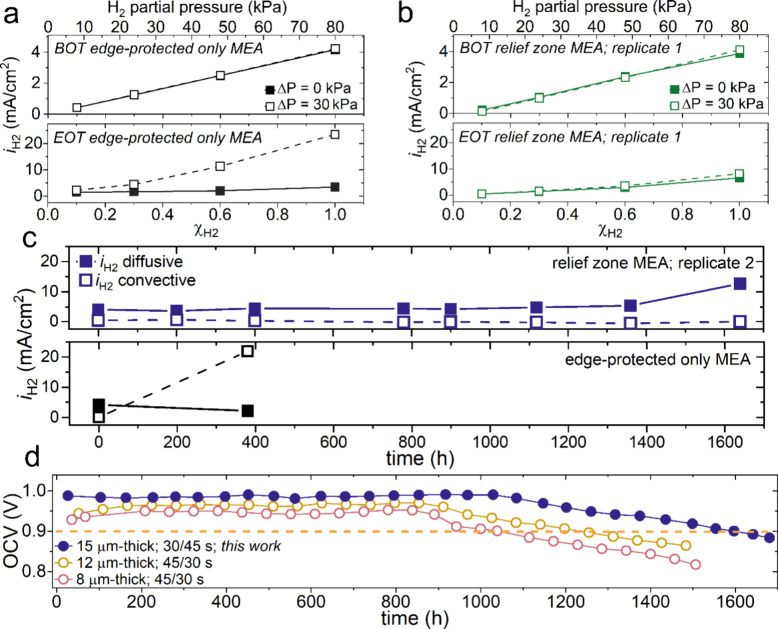 Figure 5
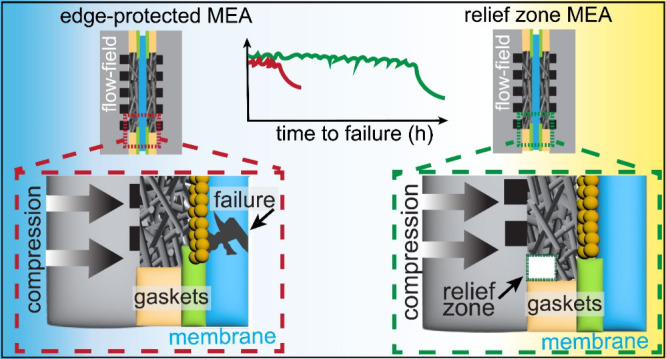 Figure 6
 Figure 7
- —Hydrogen and Fuel Cell Technologies Office10.13039/100010268
Peer Reviews
No public reviews on file for this paper yet. If you reviewed it on a platform where reviews are public (OpenReview, ICLR, NeurIPS, ICML), you can paste yours below so the community can read it here.
Videos
No videos yet. Explain this paper in a talk, walkthrough, or lecture? Add one.
Taxonomy
TopicsFuel Cells and Related Materials · Advanced battery technologies research · Advanced Battery Materials and Technologies
State-of-the-art polymer electrolyte membranes (PEMs) used in electrochemical systems have moved toward ultrathin dimensions (i.e., ≤15 μm-thick) to reduce cost and improve performance. ?,? At these ultrathin dimensions, however, trade-offs arise from increased reactant crossover and compromised mechanical stability.? In particular, polymer electrolyte membrane fuel cells (PEMFCs) benefit from ultrathin PEMs in the membrane electrode assembly (MEA), positioning them for deployment in heavy-duty transport and stationary power applications among other emerging uses.? Total cost of ownership analyses suggest that thicker membranes could be more cost-effective compared to thinner PEMs since refueling would be less frequent. This benefit becomes more significant for vehicles maintained over long durations (e.g., 15 yrs).? Nevertheless, cost analyses indicate an optimal thickness between 10 and 12 μm, since lowered protonic resistances and higher power densities can be achieved, thereby decreasing the number of cells in a stack.? Coordinated material development efforts aimed at stabilizing and mitigating degradation in ultrathin PEMs are relevant to a range of electrochemical conversion systems; thus, assembly or packaging strategies also have broad applicability regardless of technology type.
Chemical design strategies that improve transport properties are often linked to reduced mechanical stability. Entropic penalties associated with increased hydration of ionic domains pose challenges to the dimensional stability of PEMs with high ion exchange capacities. Lessening such trade-offs have included the use of reinforcement layers, which minimize in-plane dimensional changes.? Although these approaches can reduce mechanical degradation, their efficacy depends on an appropriate integration of the PEM within not only the MEA but also the single-cell or stack hardware in which it is to be examined.
The architecture of the MEA and its integration within the cell hardware can impact the occurrence of premature failures in the PEM. Nonideal component integration,? including both material defects from processing ?,? and stresses generated from compression during cell assembly,? can lead to early mechanical degradation.? These irregularities often go undetected during routine performance assessments without specifically sensitive testing conditions.? Premature degradation events, identified as pin-holes, cracks, and/or tears, are most prevalent in PEMs with ultrathin dimensions,? and although reinforcement layers mitigate dimensional changes from water uptake, they do not prevent or resolve these integration-related challenges.
Subgaskets (SGs) placed between the PEM and the gas diffusion layer (GDL) or porous transport layer (PTL) have traditionally been used to protect the PEM from irregularities and local stress concentrations along the sealing perimeter. ?,? Dimensionally stable SGs are used to limit interfacial deformation of the soft PEM with relatively stiff materials and to limit buckling within voids upon water uptake. ?,? These so-called “edge-protected MEAs” have demonstrated improved durability compared to those without, as well as for PEMs ≥25 μm in thickness. ?,? These conventional edge-protected MEAs rely on compression gaskets (CGs) for hard-stop sealing along the cell perimeter (Figurea). The resulting thickness of the CG within the assembled hardware specifies the compression target of the GDL (or PTL), ultimately affecting device performance and durability, ?−? ? whereas the SG extends to mask the CG-to-GDL interface with the PEM, providing additional mechanical support. Thin SGs (≤45 μm) ensure mechanical loading is focused onto CGs for adequate sealing. Increased pressure from excessive GDL compression along the SG regions was, however, found to be a primary contributor to early mechanical degradation in conventional edge-protected MEAs. This limitation underscores the need to revise current MEA designs to isolate intrinsic material properties from those related to integration and device engineering to achieve long-term operation and reproducible durability outcomes for ultrathin PEMs. To address these shortcomings, a novel MEA architecture is proposed to enable robust integration of ultrathin PEMs broadly applicable to electrochemical conversion systems.
In this letter, we propose a relief zone strategy to alleviate stress from mechanical overcompression prevalent in MEAs. The relief zone mitigates mechanical degradation and promotes a uniform compression across the active area, enabling failure assessments strictly related to the chemical and mechanical properties of the PEM in question.? Laser ablation was used to remove diffusion media along the exposed SG regions, leaving behind an intact microporous layer (MPL) as depicted in Figureb. The relief zone depth should be proportional to or preferably greater than the change in thickness specified by the compression target of the GDL (Equation S1). Cross-sectional and top-down images of the relief zone MEA are provided in Figure S1a-b. The relief zone approach is fully customizable, enabling ease of modification to a range of electrode component dimensions and material thicknesses without the need for costly hardware modifications. Thus, the use of relief zones is a promising approach for integration of ultrathin, state-of-the-art PEMs across electrochemical conversion systems that utilize zero-gap, MEA designs at specified compressions.
Spatial pressure distributions were assessed to examine stress points across the MEA within the single-cell hardware. Three-dimensional reconstructions of the surface contact pressure distributions are shown in Figurea-b for the edge-protected only and relief zone MEA, respectively. These data include the inlets of a quad serpentine land-channel array with CG and edge-protected SG regions. Figurea exhibits a variable pressure distribution across the CG edge with high mechanical loading concentrated along the SG and the flow-field lands. In contrast, the relief zone MEA shows a higher mechanical loading at the CG, ensuring a leak-free cell assembly and lessened pressure across the lands (Figureb). The pressure drop between the CG and the flow-field are indicative of the relief zone, which mitigates overcompression of the GDL along the lands. These results highlight the ability of relief zones to redistribute mechanical loading more effectively than edge-protection alone, establishing a direct link between contact pressure uniformity with implications to MEA durability and performance.
Mean pressure profiles across the MEAs are shown in Figurec-d. The edge-protected only MEA exhibits a considerable concentration of pressure along the SG and a higher pressure and deviation across the flow-field (Figurec), whereas the relief zone MEA shows the highest pressures along the CG. The pressure drop at the SG indicates the presence of relief zones, which alleviates excess GDL compression, enabling a uniform pressure distribution (Figured). These data agree with the selected reconstructions, and the pressure contact films are provided in Figure S2a-b. In short, regions of overcompression create irregular pressure concentrations and gradients that result in mechanical fatigue in addition to limited electrochemical performance.
Polarization data from the relief zone MEAs exhibit a ∼16 mV decrease in kinetic overpotential (Figuree-f). This small kinetic offset could indicate differences in the local concentration of O_2_ or water activity at the Pt-ionomer interface from compression-induced densification. Lower cell voltages are observed for the edge-protected only MEA with exacerbated ohmic and mass transport losses and are consistent for replicate relief zone MEAs (Figure S3). The edge-protected only MEA experiences a GDL compression of 96% along the SG, indicating a high compression gradient that likely decreases to a 20% compression target at the MEA center. The porosity of the GDL in this case may be negatively impacted by limited O_2_ diffusion and the transfer of reactants and products in both the pore-structure and catalyst layer. ?,? Similar high frequency resistance (HFR) values indicate comparable interfacial contact and ionic resistance, suggesting performance differences are due to mass transport losses from GDL constriction.? The edge-protected only MEA exhibits higher H_2_ crossover limiting current density measurements (i H2) at beginning of test (BOT), revealing that nonuniform overcompression can also drive PEM deformation and structural thinning at lands and intrusion into channels (Figure S4).? Thus, relief zones can lower reactant crossover and enhance performance, enabling accurate and uniform GDL compression targets while mitigating PEM deformation.
Enhanced durability of the relief zone MEA was demonstrated during the combined chemical-mechanical accelerated stress test (AST) and evaluated using open circuit voltage (OCV) assessments and infrared (IR) thermography at the end of the test (EOT). Aggressive mechanical cycling (i.e., 100/0% RH at 30/45 s intervals) under an OCV hold condition assists in exposing imperfections in the MEA that arise from nonideal component integration either by fabrication and/or assembly techniques. ?,? The edge-protected only MEA approaches <0.9 V OCV at ∼250 h (Figurea). The corresponding IR thermography data at EOT show local heating along the top-edge of the MEA from the exothermic oxidation of H_2_ at exposed Pt sites, indicating through-plane perforation near the SG, whereas the relief zone MEAs approach <0.9 V OCV at 1.2 k and 1.4 k h for replicates 1 and 2, respectively, demonstrating a 6-fold enhancement (Figurec and ?e). The respective EOT IR thermography data for relief zone MEAs suggest H_2_ crossover by thinning, as indicated by broad, circular hot spots with lower relative temperatures located at or near flow-field outlets (Figured and ?f).
Cross-sectional, PEM thickness measurements of EOT samples acquired from failure, inlet, and outlet locations also indicate PEM thinning in relief zone MEAs (Figure S5). These data reveal thicknesses of 2.8 ± 0.38 μm and 11.7 ± 1.03 μm at PEM failure sites for the edge-protected only and relief zone MEAs, respectively. Pronounced loss of PEM material for the edge-protected MEA is demonstrated, whereas the relief zone MEA retains 78% of its initial thickness, corroborating the effectivity of the proposed method for mitigating mechanical degradation. Moreover, at the inlet and outlet locations, where pinhole failures are absent, relief zone PEMs exhibit retention of 72% and 89%, respectively, and with 1k h longer durability lifetime.
Interestingly, ICP-MS (Figure S6) analyses show that both MEAs exhibit higher Ce concentration at the outlets. At OCV, the PEM hydration state is dictated primarily by inlet humidification. Solvation-mediated transport of Ce and Fe toward outlets is driven by diffusional water gradients due to higher λ (H_2_O/SO_3_H) at the inlet. ?,? Higher mechanical stress and/or pressure gradients will also lower the λ for a PEM equilibrated with a specific water activity due to a reduction in free volume within ionomer water domains.? Consequently, the edge-protected only MEA experiences an amplified hydraulic potential gradient from the center of the active area toward the inactive regions beneath the CG. This effect manifests as reduced Ce retention and a higher transport of Ce from active to inactive areas, as measured by XRF (Figure S7), whereas the relief zone architecture minimizes compression at the active area boundary, maintaining a higher local water content and a more uniform hydration profile. By reducing the magnitude of the water flux driving force, this design suppresses the convective displacement of scavengers, resulting in the higher Ce retention within the active area and lowering residual Fe content. To further resolve underlying PEM failure modes, OCV transient analyses were used to leverage deviations from predicted voltage values under defined operating conditions.
Deviations from thermodynamically derived OCV predictions under specific operating conditions can be used to monitor irreversible degradation events. Figuresa and ?b show the deconvoluted OCV transients for low and high RH conditions. Nernstian behavior and kinetic effects elicit higher dry OCV responses due to greater reactant partial pressures at low RH. Herein, nonrecoverable losses are attributed to PEM degradation, as demonstrated through declines in dry OCV as losses from H_2_ crossover increase.? Critical failures in Figurea and ?b (i.e., dashed boxes) are evident where similar OCVs occur under dry and wet conditions, resulting in a ΔOCV of 0 mV (i.e., wet OCV subtracted from dry OCV). ?,? A reversal of the dry and wet OCV responses (i.e., wet OCV ≫ dry OCV) can indicate PEM perforation, since H_2_ crossover is attenuated by water uptake and swelling and higher crossover losses occur in the dry state. Interestingly, the relief zone MEAs do not exhibit this reversal behavior (Figureb) but rather scattering behavior evidently from thinning rather than perforation. Convergence of dry and wet OCV responses where ΔOCV remains near 0 mV occur for 200–300 h. Zoomed-in transient plots of this behavior are provided in Figures S8 and S9. Use of relief zones in combination with reinforcement layers suggests that through-plane perforations from mechanical stresses are mitigated such that thinning becomes the dominant failure mode.
Figuresc and ?d show the ΔOCV values at selected intervals. The ΔOCV at BOT was determined as 41 mV (dashed line), defined by the Nernst potential corrected for H_2_ crossover and cathodic kinetic losses at both low and high RH.? The edge-protected MEA in Figurec exhibits a decrease in ΔOCV after 70 h, while increases to i H2 are not apparent until 200 h at 30% RH (Figuree). In contrast, decreases in ΔOCV track with increasing i H2 at 30% RH for the relief zone MEA (Figured and ?f). Higher and/or nonuniform effective PEM hydration from overcompression of the GDL can result in slowed water transport and, therefore, obfuscated i H2 values. Similar divergences between ΔOCV declines and crossover were previously encountered for cracked electrodes with increased and nonuniform water retention.? Thus, relying on i H2 alone does not fully capture the PEM degradation mechanisms. Similarly, the relief zone MEA exhibits little to no increase for i H2 at 100% RH, as this measurement does not effectively capture the thinning behavior. To further elucidate such failure modes, a series of i H2 measurements were performed to separate diffusive (i H2 diffusive) and convective (i H2 convective) crossover contributions to distinguish between thinning and through-plane perforations.
Figuresa and ?b show the i H2 versus H_2_ mole fraction (Χ_H2_ = 0.1, 0.3, 0.6, and 1.0) for symmetric (ΔP = 0 kPa) and differential backpressure (ΔP = 30 kPa) conditions for the edge-protected only and relief zone MEA, respectively. In brief, slopes for ΔP = 0 kPa represent i H2 diffusive, while slopes for ΔP = 30 kPa include both i H2 diffusive and i H2 convective terms, and the y-intercept at Χ_H2_ = 0 represents the contribution from shorting current.? At BOT, the i H2 diffusive and i H2 convective terms are similar in magnitude for the edge-protected only (i.e., 4.16 mA/cm^2^ and 60.2 μA/cm^2^) and the relief zone MEA (i.e., 4.09 mA/cm^2^ and 35.7 μA/cm^2^). Excessive compression and a high pressure gradient caused early failures near the SG frame in edge-protected only MEAs, as demonstrated by an increase to 21.9 mA/cm^2^ for i H2 convective at EOT (Figurea). In contrast, the relief zone MEA exhibits a modest increase where i H2 convective = 1.82 mA/cm^2^ (Figureb). The time-resolved breakdown in Figurec shows an increase to i H2 diffusive and minimal i H2 convective at EOT for the relief zone MEA. In short, the relatively low i H2 convective contribution further suggests that the reinforced PEMs with relief zones exhibit thinning as a failure mode even when subjected to aggressive mechanical cycling during the AST. In contrast, excess and nonuniform compression in edge-protected only MEAs result in early failures which obscure assessments toward intrinsic PEM material properties.
Distinguishing between intrinsic material properties and integration-driven failure modes is critical to directing future research endeavors and yielding a proper assessment of the state of technology for subsequent scale-up. While thickness-independent durability for ultrathin reinforced PEMs has been reported for combined chemical mechanical ASTs, the results were ultimately inconclusive due to early mechanical failures from stress concentrations along the frames. Figured compares the durability of relief zone MEAs against 8 and 12 μm-thick PEMs probed under less aggressive conditions (i.e., shorter dry cycle, 45/30 s wet/dry).? While this comparison provides a qualitative understanding, it underscores the importance of optimizing device-level integration prior to material assessment and showcases relief zones as an effective strategy for reducing local stress concentrations near electrode edges inherent to traditional methods of edge-protection.
To properly assess material properties within small scale devices, we move past limitations in single-cell assembly techniques toward robust integration of ultrathin PEM materials. As material properties such as hydration, swelling, and thickness change, revisiting cell-level engineering to understand the boundary conditions is critical for proper material assessments. Herein, we show that relief zones can be applied to improve the signal-to-noise ratio of material properties over cell-level engineering to not only yield accurate assessments of material limitations but also properly define failure modes for subsequent material-based mitigation strategies. Root causes of early mechanical failures were identified and mitigated using a stress relief zone strategy, demonstrating a 6-fold improvement in AST lifetime. Analyses of scavenger retentions in post-mortem MEAs highlighted the critical role of structural architecture in governing these distributions and suggest further investigation into the coupled effects of mechanical and chemical degradation. Linkage of absolute pressures along lands and the resulting diffusion media compression could guide new metrics to mitigate structural impacts. These findings could assist in an improved translation of representative durability characterizations from single-cell- to stack-level platforms.
Supplementary Material
The reference list from the paper itself. Each links out to its DOI / PubMed record.
- 1Gittleman C. S.Jia H.De Castro E. S.Chisholm C. R. I.Kim Y. S.Proton Conductors for Heavy-Duty Vehicle Fuel Cells Joule 2021571660167710.1016/j.joule.2021.05.016 · doi ↗
- 2Kienitz B.Kolde J.Priester S.Baczkowski C.Crum M.Ultra-Thin Reinforced Ionomer Membranes to Meet Next Generation Fuel Cell Targets ECS Trans.20114111521153010.1149/1.3635683 · doi ↗
- 3Luo X.Lau G.Tesfaye M.Arthurs C. R.Cordova I.Wang C.Yandrasits M.Kusoglu A.Thickness Dependence of Proton-Exchange-Membrane Properties J. Electrochem. Soc.20211681010451710.1149/1945-7111/ac 2973 · doi ↗
- 4Cullen D. A.Neyerlin K. C.Ahluwalia R. K.Mukundan R.More K. L.Borup R. L.Weber A. Z.Myers D. J.Kusoglu A.New Roads and Challenges for Fuel Cells in Heavy-Duty Transportation Nature Energy 20216546247410.1038/s 41560-021-00775-z · doi ↗
- 5Gittleman C. S.Kongkanand A.Masten D.Gu W.Materials Research and Development Focus Areas for Low Cost Automotive Proton-Exchange Membrane Fuel Cells Current Opinion in Electrochemistry 201918818910.1016/j.coelec.2019.10.009 · doi ↗
- 6Kienitz B.Optimizing Polymer Electrolyte Membrane Thickness to Maximize Fuel Cell Vehicle Range Int. J. Hydrogen Energy 20214619111761118210.1016/j.ijhydene.2020.03.126 · doi ↗
- 7Shi S.Weber A. Z.Kusoglu A.Structure/Property Relationship of Nafion XL Composite Membranes J. Membr. Sci.201651612313410.1016/j.memsci.2016.06.004 · doi ↗
- 8Taylor A. K.Baez-Cotto C.Hu L.Smith C.Rodriguez-Nazario A.Young J. L.Mauger S.Neyerlin K. C.The Influence of Electrode Crack Dimensions on the Durability of Polymer Electrolyte Membrane Fuel Cells J. Power Sources 202562823588410.1016/j.jpowsour.2024.235884 · doi ↗