Benzydamine Attenuates Matrix Metalloproteinase‐9 Expression Through Inhibition of ERK MAPK in Activated Human Monocytic Cells Under Hyperglycemic Condition
Anh Phong Do, Yan-Cheng Shen, Yu-Wen Cheng, Chih-Hao Yang, Li-Chu Huang, Yi-Chien Liu, Ahmad Dzulfikri Nurhan, Yen-Mei Lee, Sung-Po Hsu, George Hsiao

TL;DR
Benzydamine reduces MMP-9 activity in monocytic cells under high-glucose conditions by inhibiting ERK MAPK and NF-κB pathways.
Contribution
This study reveals a novel anti-inflammatory mechanism of benzydamine in high-glucose environments through ERK MAPK and NF-κB inhibition.
Findings
Benzydamine inhibits LPS-induced MMP-9 gelatinolysis in THP-1 cells under high-glucose conditions.
Benzydamine suppresses ERK MAPK phosphorylation and NF-κB activation in monocytic cells.
Benzydamine also reduces TLR-4 and SARS-CoV-2 S1 protein-induced MMP-9 activity under high-glucose conditions.
Abstract
Much evidence has demonstrated that the association between sepsis and diabetes can result in comorbidity effects. The endotoxin lipopolysaccharide (LPS) is a damaging factor that penetrates through the intestinal wall and into circulation in patients with diabetes. Benzydamine is a clinical drug widely used for pharyngitis and periodontitis with local anesthetic and analgesic properties. The purpose of this study was to investigate the anti‐matrix degradative effects of benzydamine and its mechanisms on matrix metalloproteinase (MMP)‐9 activation in LPS‐stimulated THP‐1 human monocytic cells under high‐glucose condition. In this study, it was found that benzydamine could attenuate LPS‐induced MMP‐9‐mediated gelatinolysis and protein expression in THP‐1 cells under the normal‐glucose condition. On the other hand, LPS induced higher MMP‐9 gelatinolytic activity under the high‐glucose…
Genes, proteins, chemicals, diseases, species, mutations and cell lines named across the full text — each resolved to its canonical identifier and authoritative record.
Click any figure to enlarge with its caption.
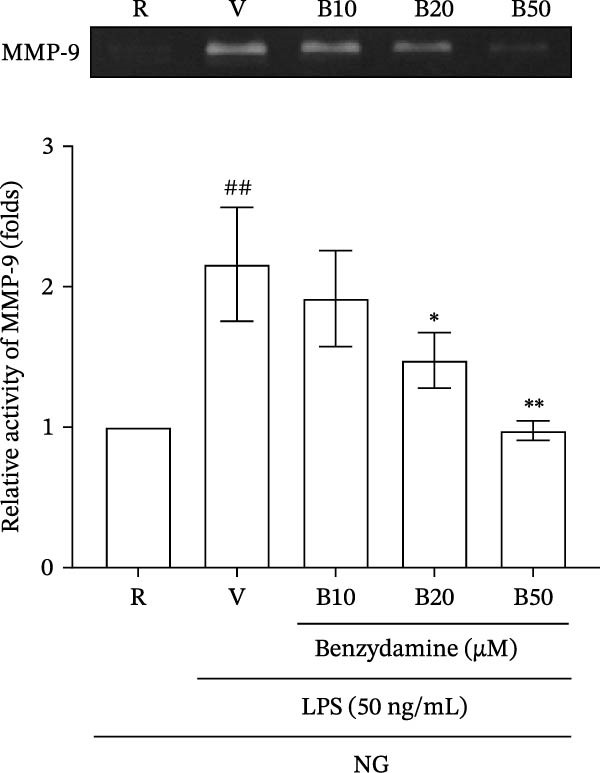 Figure 1
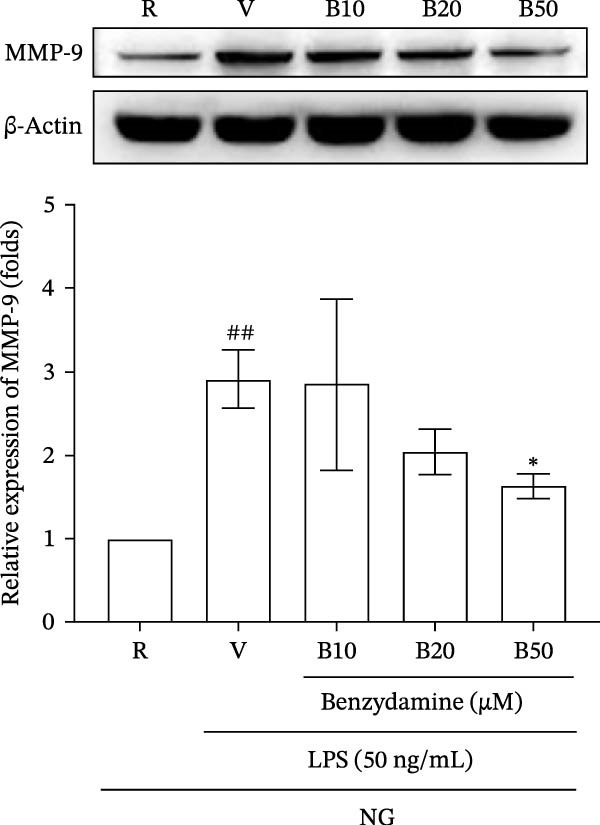 Figure 2
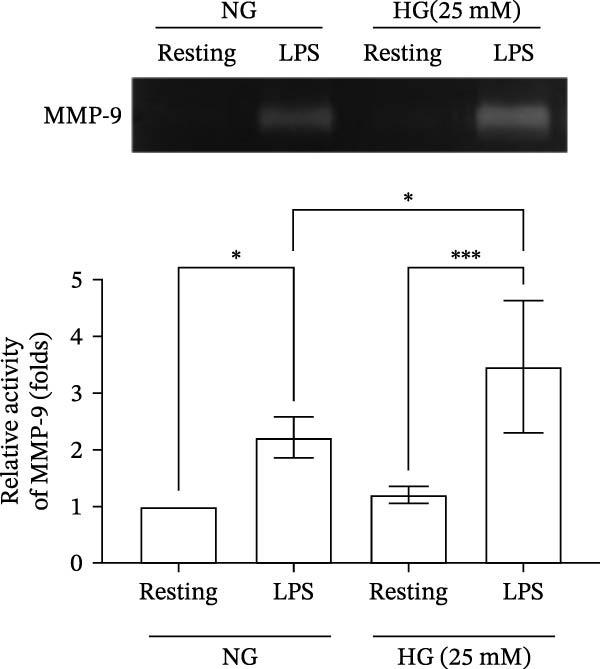 Figure 3
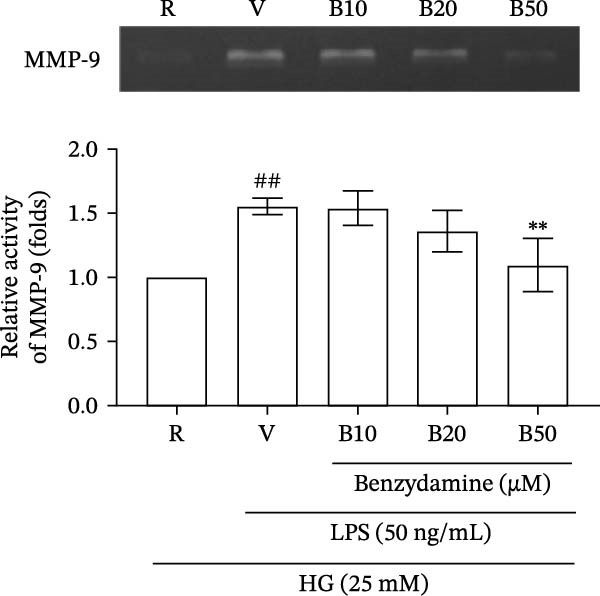 Figure 4
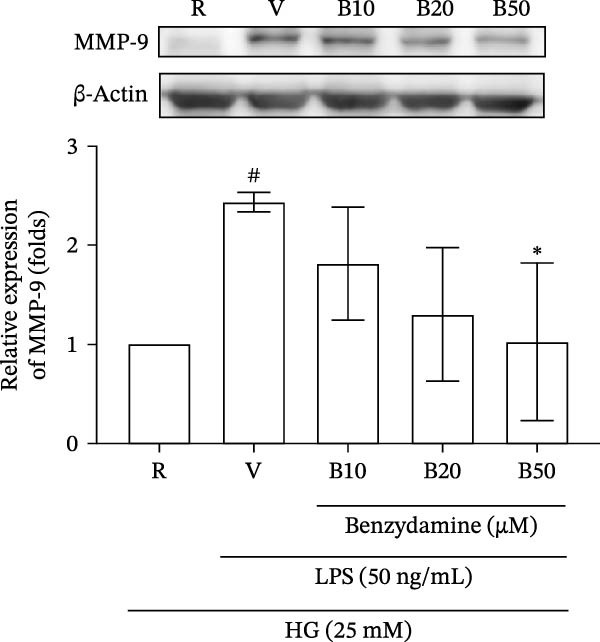 Figure 5
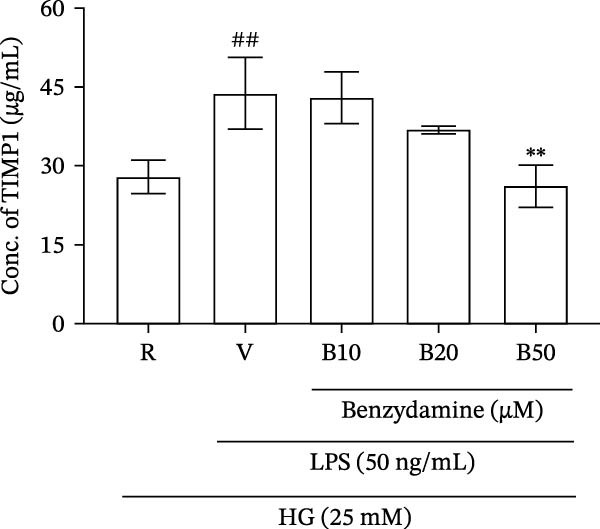 Figure 6
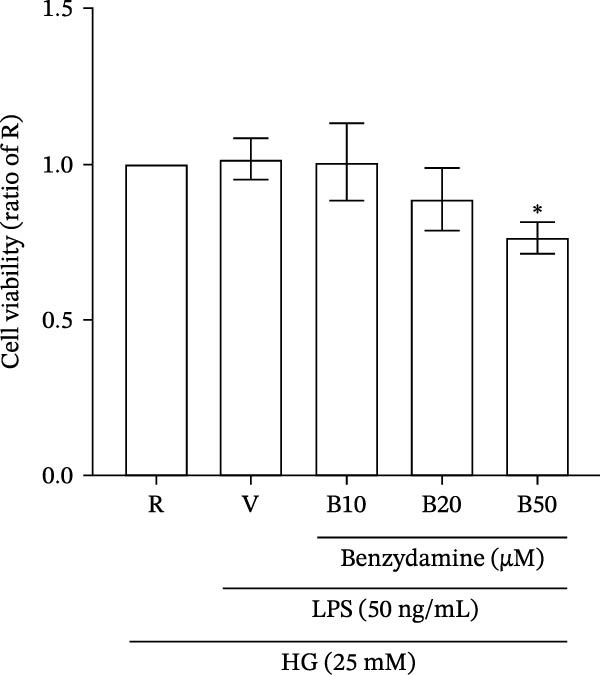 Figure 7
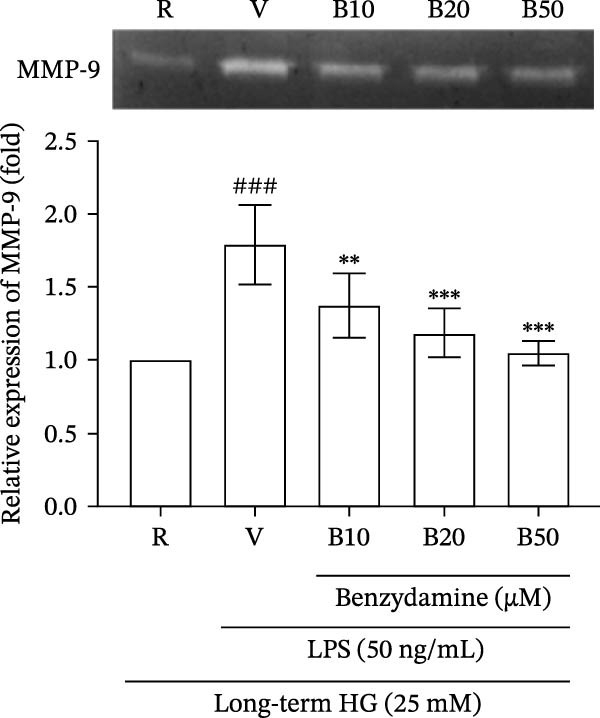 Figure 8
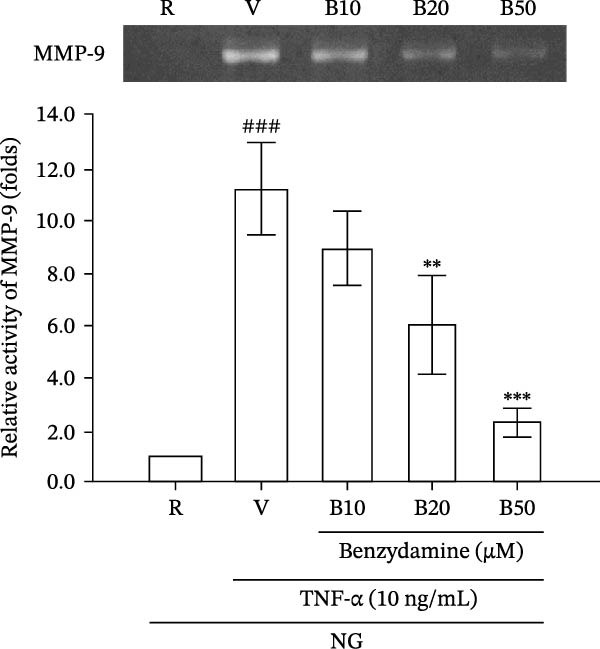 Figure 9
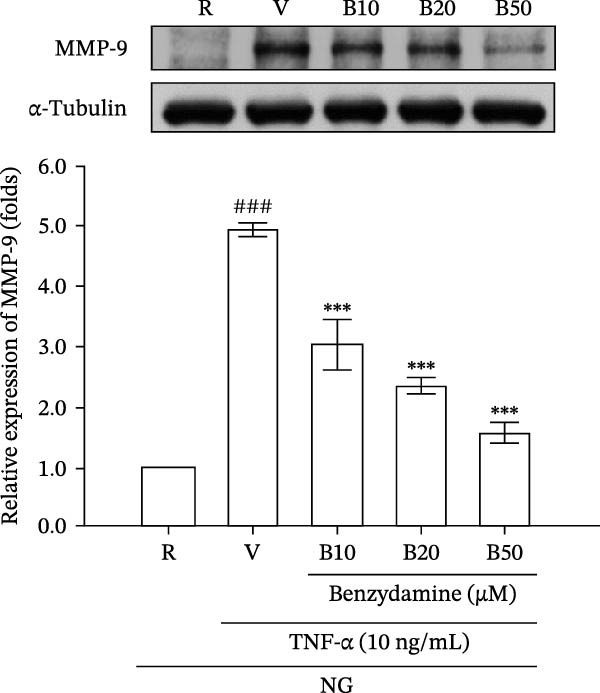 Figure 10
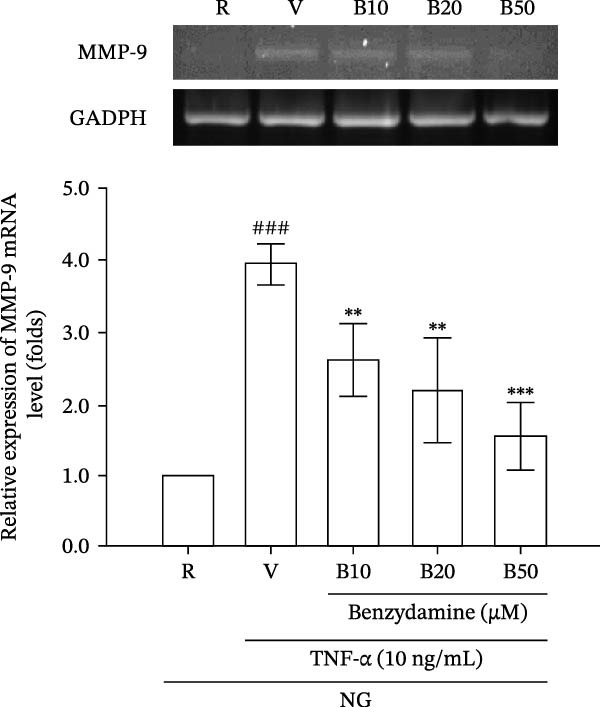 Figure 11
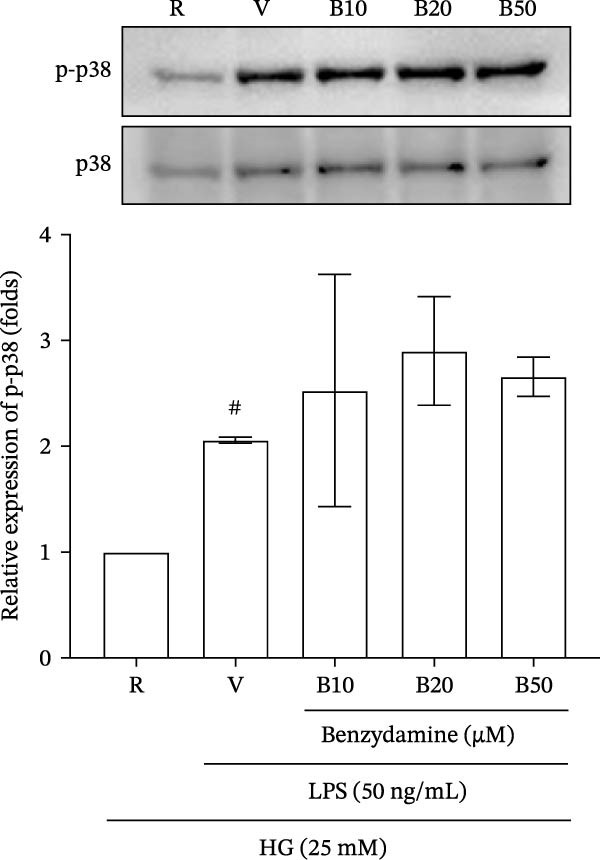 Figure 12
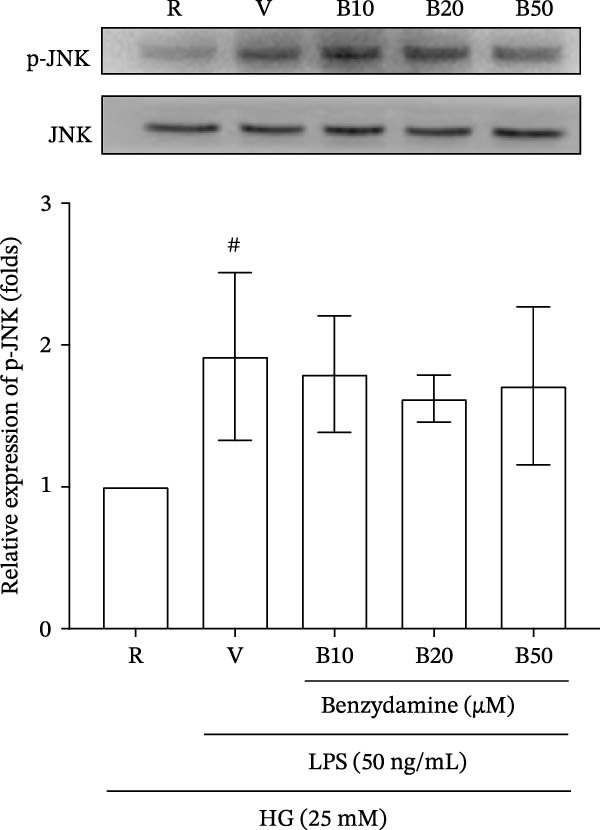 Figure 13
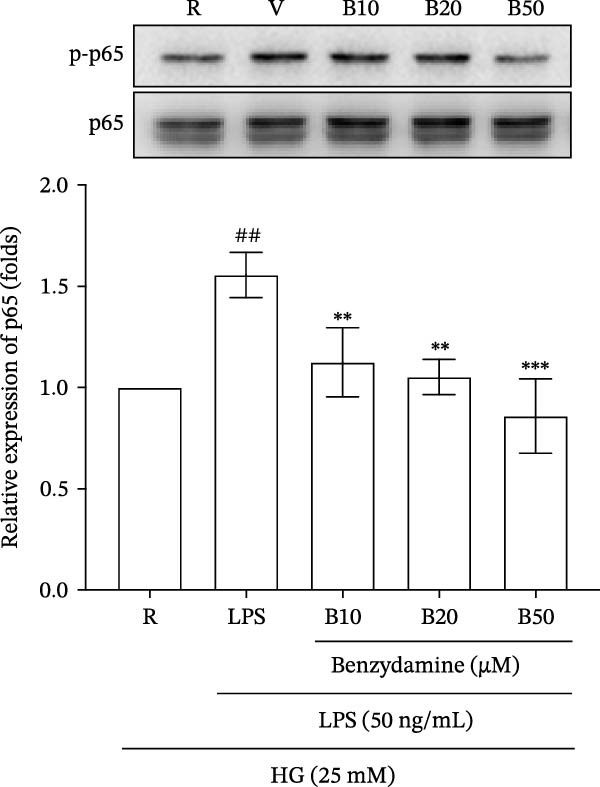 Figure 14
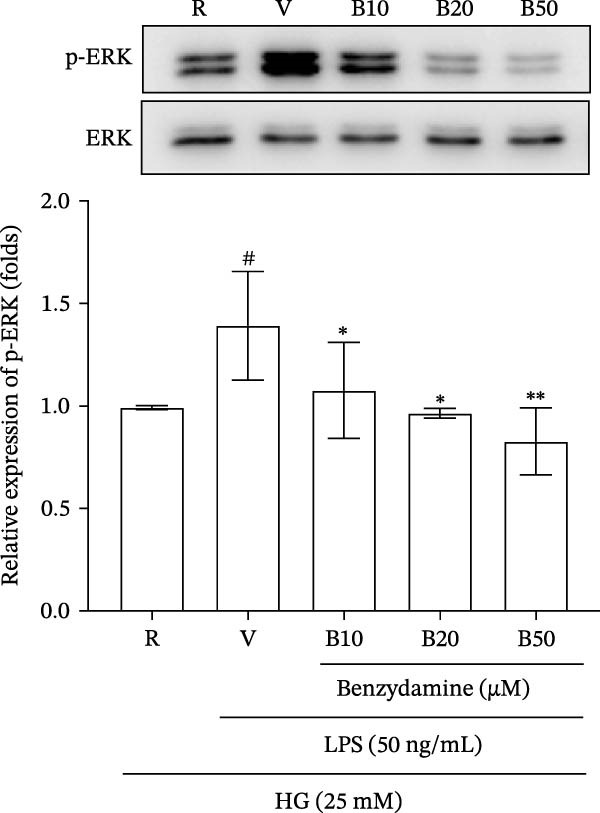 Figure 15
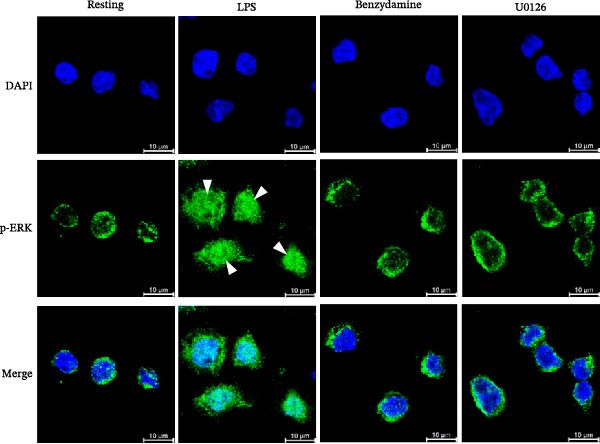 Figure 16
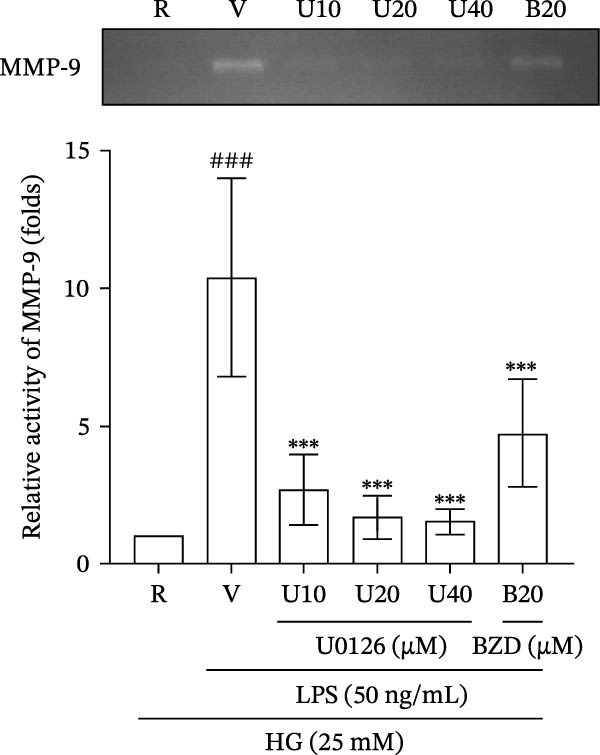 Figure 17
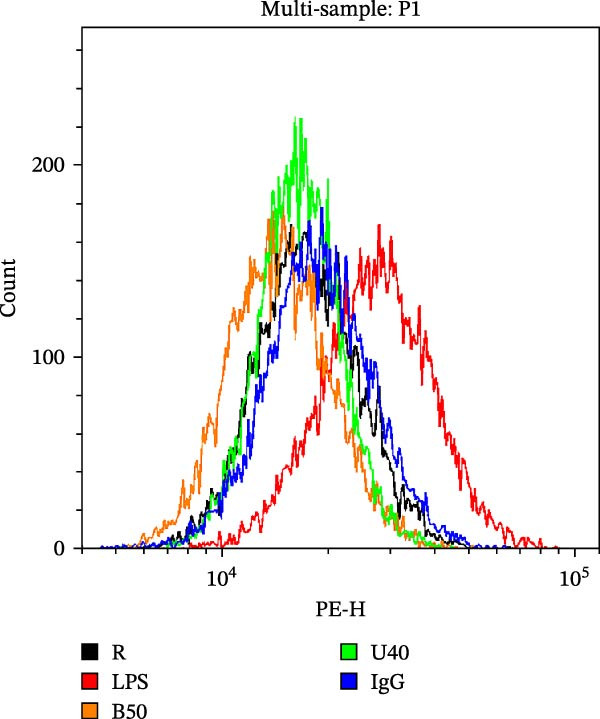 Figure 18
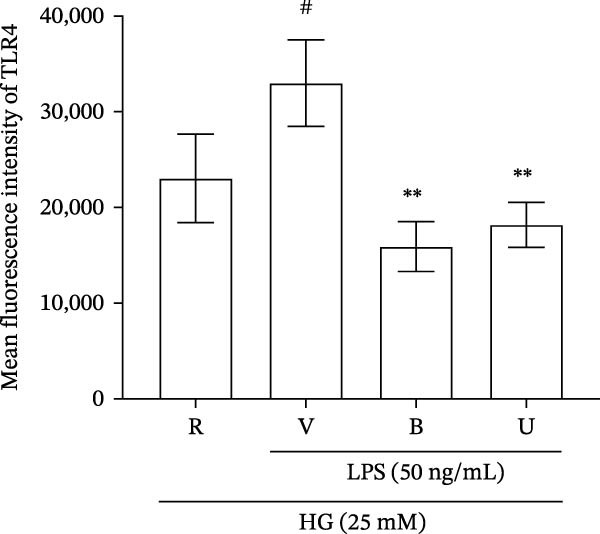 Figure 19
- —Ministry of Science and Technology10.13039/100007225
- —Taipei Medical University10.13039/501100004700
Peer Reviews
No public reviews on file for this paper yet. If you reviewed it on a platform where reviews are public (OpenReview, ICLR, NeurIPS, ICML), you can paste yours below so the community can read it here.
Videos
No videos yet. Explain this paper in a talk, walkthrough, or lecture? Add one.
Taxonomy
TopicsProtease and Inhibitor Mechanisms · Nitric Oxide and Endothelin Effects · Melanoma and MAPK Pathways
1. Introduction
Sepsis is a life‐threatening condition characterized by dysregulated host response to infection that leads to multiple organ dysfunction and is associated with high mortality rates [1, 2]. According to epidemiologic findings, diabetic patients with septic conditions suffer a high rate of mortality [3]. The increasing prevalence of sepsis among diabetic patients is associated with the global rise in diabetes [4]. However, the relationship between diabetes mellitus (DM) and sepsis is still poorly understood in modern medicine [3]. Notably, diabetes is also established as a comorbidity for COVID‐19, which is characterized by severe cytokine storms [5]. The severity of infection is affected by proinflammatory cytokines, such as tumor necrosis factor (TNF)‐α, interleukin (IL)‐1β, and IL‐6 [6]. These cytokines are released from monocytes/macrophages and play a very important role in the pathophysiological processes of sepsis [7]. Hyperglycemia has been known to create a devastating environment that increases the levels of proinflammatory molecules, such as IL‐1β, TNF‐α, and the protease matrix metalloproteinases (MMPs), thereby prolonging inflammatory responses [8].
MMP‐9 is well‐known not only for its essential role in the pathogenesis of inflammatory diseases [9, 10], but also for its involvement as a key mediator in the progression of infectious conditions under hyperglycemia, such as sepsis and periodontal diseases [11, 12]. Overproduction of MMPs have been identified in the different tissues with varying substrate specificities and multiple inflammatory responses [13]. Dysregulated MMP‐9 production plays a pivotal role in different infectious diseases and sepsis [14]. It is noteworthy that the monocyte/macrophage lineage plays a crucial role in inflammatory remodeling by releasing MMPs [15]. Monocytic MMP‐9 production is also important in the pathology of inflammatory and septic diseases [16]. Previous clinical studies have demonstrated that MMP‐9 was elevated in acute/chronic hyperglycemia and sepsis, suggested the significant association between hyperglycemia and MMP‐9 levels in patients with severe sepsis or septic shock [11]. Lipopolysaccharide (LPS) could induce MMP‐9 production via Toll‐like receptor (TLR)‐4 activator in monocytes [17]. THP‐1 cells were found to be sensitive to LPS, which promotes the progression of inflammatory responses [18]. TNF‐α is also a crucial inducer of MMP‐9 expression, since LPS can upregulate monocytic TNF‐α to amplify the inflammatory responses by further enhancing MMP‐9 production [19]. There are numerous reports support that overexpression of MMPs could contribute to deterioration of hematoma and graft [20, 21]. These further demonstrate the relationship between diabetes, high‐glucose, and MMPs in complications of disease.
Benzydamine is a clinically used nonsteroidal anti‐inflammatory drug (NSAID), which is effective in the treatment of inflammatory diseases or COVID‐related symptoms [22], such as sore throat [23]. Benzydamine could also attenuate microglia‐mediated neuroinflammation and significantly improve the ischemic stroke injuries [24]. Furthermore, benzydamine has great potential in the treatment of inflammation‐related bone diseases and osteoporosis in premenopausal women [25], and it was recently found to have a role in limiting inflammatory pain induced by neuronal sensitization [26]. Benzydamine was also effective in treating sepsis by inhibiting the production of TNF‐α in a mouse model of endotoxemia when administered before or concomitantly with LPS [27]. The anti‐inflammatory capacity of benzydamine might result from its ability to reduce the production of IL‐1β and TNF‐α in blood mononuclear cells [28]. The present hypothesis is that benzydamine may have inhibitory effects on inflammation, particularly on MMP expression in activated monocytic cells with hyperglycemia. Elucidating how benzydamine inhibits MMP‐9 may have potential for preventing degradation and serve as a target for anti‐inflammatory therapy in endotoxemia under hyperglycemia.
2. Materials and Methods
2.1. Materials
Benzydamine, LPS from Escherichia coli O127:B8, U0126, thiazolyl blue tetrazolium bromide (MTT) were purchased from Sigma–Aldrich (St. Louis, MO, USA). Recombinant human TNF‐α was purchased from PeproTech (Cranbury, NJ, USA). SARS‐CoV‐2 spike protein derived from the wild‐type SARS‐CoV‐2 strain and expressed in E. coli (S1 subunit, Cat. 61831) was obtained from Leadgene Biomedical, Inc. (Tainan, Taiwan). Gelatin was purchased from Kanto Chemical (Tokyo, Japan). Agarose was obtained from GeneDirex (Las Vegas, Nevada, USA). MMP‐9 (Cat. 10375‐2‐AP), β‐actin (Cat. 66009‐1‐Ig), α‐tubulin (Cat. 11224‐1‐AP), and p65 (Cat. Ab529) antibodies were purchased from Proteintech (Rosemont, IL, USA). Goat anti‐rabbit IgG (HRP, Cat. GTX213110‐01), anti‐mouse IgG (HRP, Cat. GTX213111‐01), and goat anti‐rabbit IgG with DyLight488 secondary antibodies (Cat. GTX213110‐04) were purchased from GeneTex (Irvine, CA, USA). Antibodies against p‐p38 (Cat. 9211S), p38 (Cat. 8690T), p‐JNK (Cat. 9251S), JNK (Cat. 9252S), p‐ERK (Cat. 9101S), ERK (Cat. 9107S), and p‐p65 (Cat. 3033S) were purchased from Cell Signaling (Beverly, MA, USA). PE anti‐human CD284 (TLR‐4, Cat. 312806) and PE mouse IgG2a with κ isotype Ctrl antibodies (Cat. 400211) were purchased from BioLegend (San Diego, CA, USA). All other chemicals used in this study were of reagent grade.
2.2. THP‐1 Cell Culture
The human monocytic leukemia THP‐1 cell line was purchased from American Type Culture Collection (Manassas, VA, USA) and subcultured regularly for 72 h each time (1.2 × 10^7^ cells in T75 flasks), as previously described [29]. Cells were maintained in RPMI 1640 medium containing 10% heat‐inactivated fetal bovine serum (FBS), NaHCO_3_ (23.57 mM), HEPES (18 mM), streptomycin (90 μg/mL), l‐glutamine (3.65 mM), and penicillin (90 units/mL) at 37°C in a humidified atmosphere (95% O_2_ and 5% CO_2_). To seed the cells to collect samples for experiments, we used two types of medium: normal‐glucose (glucose concentration of 11 mM; RPMI 1640/FBS 0.5% without phenol red) and high‐glucose (glucose concentration of 25 mM; RPMI 1640/FBS 0.5% without phenol red) [30].
2.3. Gelatin Zymography Analysis
THP‐1 cells (5 × 10^5^ cells/0.5 mL) were seeded onto 24‐well plates (Costar) in the normal‐glucose (11 mM) or high‐glucose (25 mM) RPMI 1640 medium containing 0.5% FBS without phenol red, pretreated with or without benzydamine (10, 20, and 50 µM) for 30 min and subsequently stimulated with LPS (50 ng/mL), TNF‐α (10 nM), or COVID‐19 S1 protein (0.5 µg/mL) for 24 h, and then the supernatants were collected. After centrifuged at 500 × g for 5 min at 4°C, the supernatants were mixed with a non‐reducing buffer containing Tris–HCl, glycerol, SDS, and bromophenol blue (125 mM, 25%, 4%, and 0.01%, respectively), pH 6.8, and electrophoresed on gels containing 1 mg/mL of gelatin. After electrophoresis, the gels were washed twice with 2.5% Triton X‐100 for 20 min and subsequently incubated with reacting buffer containing Tris–base, NaCl, CaCl_2_, and Brij 35, pH 7.5, for 17 h at 37°C. For the staining procedure, the gels were then stained with 50% Colloidal Brilliant Blue G (w/v) in 25% methanol and 10% acetic acid for 20 min at RT. Clear zones (bands) against the blue background showed the presence of gelatinolysis by MMP‐9. Gelatinolytic zones were imaged for further quantifying as described previously [29, 31].
2.4. MTT Assay
A colorimetric MTT assay was used to evaluate cell viability, as previously described [32]. In brief, 1 × 10^6^ THP‐1 cells were seeded in each well of a 24‐well plate. After treatment with benzydamine at various concentrations (10, 20, and 50 μM) for 23 h, MTT (0.55 mg/mL) was added, and the samples were incubated for 1 h. The cells were then centrifuged at 5000 × g for 5 min at 4°C and lysed with 0.5 mL DMSO. The absorbance values at 570 nm were measured on a microplate reader (Thermo Multiskan GO, Ratastie, Finland).
2.5. Enzyme‐Linked Immunosorbent Assay (ELISA) for TIMP‐1
THP‐1 cells were seeded onto 12‐well plates at 1 × 10^6^ cells/mL per well. Under the high‐glucose conditions (25 mM), cells were pretreated with benzydamine for 30 min and then stimulated with LPS for 24 h. After stimulation, the culture medium was collected and centrifuged at 500 × g for 5 min at 4°C. The resulting supernatant was diluted 20‐fold and the amount of secreted TIMP‐1 protein was quantified by using the human TIMP‐1 ELISA kit (Proteintech, Chicago, IL) and following its manufacturer’s instructions.
2.6. Western Blot Analysis
THP‐1 cells (1.0 × 10^6^ cells/mL) were seeded onto 6‐well plates (Costar) in normal or high‐glucose medium. Then, the cells were pretreated with or without benzydamine (10, 20, and 50 μM) for 30 min and were subsequently stimulated with LPS (50 ng/mL) or TNF‐α (10 nM). Stimulation time varied according to the target protein: 24 h for MMP‐9 and 1 h for total‐ and phosphor‐ p38, JNK, p65, and ERK. Thereafter, the THP‐1 cells were lysed with Radioimmunoprecipitation assay (RIPA) (Abcam, Cambridge, UK., ab 156034) containing 1% protease inhibitors (MedChemExpress, Monmouth Junction, NJ, USA., HY‐K0010) and centrifuged at 12,000 × g for 5 min at 4°C. After homogenized, the samples were heated, and then separated by SDS‐PAGE and transferred to PVDF membranes. The membranes were blocked with 5% nonfat milk in TBST for 1 h and incubated in the recommended dilution of specific primary antibodies overnight at 4°C. The membranes were then washed and incubated with HRP‐conjugated secondary antibodies for 1 h and visualized by chemiluminescence. The optical density of the blots was analyzed by ImageJ software (National Institutes of Health, USA., 2020). The densities were calculated and normalized to the internal control (β‐actin or α‐tubulin), or to the total form for phosphorylated proteins, and presented as described previously [29].
2.7. Reverse Transcription‐Polymerase Chain Reaction (RT‐PCR)
Total RNA was isolated from THP‐1 cells using TRIsureTM reagent (Bioline, Trento, Italy). For each RT‐PCR reaction, RNA (0.5 μg) and primers (0.2 μM) were reverse‐transcribed to produce cDNAs, followed by amplification using One‐tube RT‐PCR mix using a commercial kit (Super Script One‐Step RT‐PCR system, GIBCOTM, Thermo Fisher Scientific; Waltham, MA). RT‐PCR was conducted using the following primers for human MMP‐9 as sense: 5′‐CGT GGA GAG TCG AAA TCT CTG‐3′, antisense: 5′‐CCA AAC TGG ATG ACG ATG TCT‐3′; for human GAPDH as sense: 5′‐CCA CCC ATG GCA AAT TCC ATG GCA‐3′, antisense: 5′‐TCT AGA CGG CAG GTC AGG TCC ACC‐3′. Following amplification, the PCR products were electrophoresed in a 1.5% agarose gel and visualized by GelRedTM staining. GAPDH was used as an internal control. GAPDH levels normalized the amount of cDNA template used in each PCR reaction. The respective amplified PCR products were analyzed as previously described [32].
2.8. Confocal Immunofluorescent Analysis
THP‐1 cells were seeded onto 12‐well plates at 1 × 10^6^ cells/mL per well. Under the high‐glucose condition (25 mM), cells were pretreated with benzydamine (50 μM) or U0126 as a classical ERK inhibitor (40 μM) for 30 min and then stimulated with LPS (50 ng/mL) for 1 h. After stimulation, the cells were collected by centrifugation at 250 × g for 3 min at 4°C. After centrifugation, the supernatant was removed, and the cells were resuspended in 600 μL of ice‐cold PBS. Subsequently, 200 μL of the cell suspension was transferred onto each well of a Nunc Lab‐Tek Chamber Slide (Thermo Scientific, Waltham, MA) and allowed to stand at room temperature (RT) for 30 min to enable cell adhesion. After 15 min of paraformaldehyde (4%) fixation, cells were washed with PBS and then permeabilized with 0.1% Triton X‐100 in PBS for 20 min at RT. The cells were then rinsed with PBS and incubated with 3‐fold diluted SuperBlockTM blocking buffer in PBS for 45 min. The cells were incubated with primary anti‐pERK antibodies in PBS for 2 h at RT, and then washed and incubated with a Dylight 488‐conjugated secondary antibody for 1 h. The washed cells were covered and mounted with HIGHDEF IHC fluoromount mounting medium (Enzo Life Sciences, Farmingdale, NY) with DAPI (1 µg/mL). The slides were taken to view and photographs by the Leica Stellaris 5 confocal spectral microscope imaging system (Leica, Wetzlar, Germany).
2.9. Determination of Surface TLR‐4 by Flow Cytometry
The surface expression of TLR‐4 was evaluated as described previously, with some modification [33]. Briefly, THP‐1 cells were seeded onto 12‐well plates at 1 × 10^6^ cells/mL per well. Under high‐glucose conditions (25 mM), cells were pretreated with vehicle, benzydamine (10, 20, and 50 μM) or U0126 (40 μM) for 30 min and subsequently stimulated with LPS (50 ng/mL) for 24 h. Then, cells were collected and centrifuged at 250 × g for 5 min at 4°C. After centrifugation, each pellet (containing 1 × 10^6^ cells) was resuspended and blocked with 100 μL of 10‐fold diluted SuperBlockTM (PBS) blocking buffer for 10 min at RT with gentle shaking (50 rpm). Subsequently, 5 μL of PE‐conjugated primary antibody was added directly to each sample (final ratio: 5 μL antibody per 1 × 10^6^ cells in 100 μL of 10% SuperBlock in PBS) and incubated on ice for 20 min. After incubation, the volume was filled to 1 mL with PBS, and samples were subjected to flow cytometric fluorescence quantification by using a Beckman Coulter CytoFLEX flow cytometry (Ramsey, MN). The results were calculated from 10,000 acquired events.
2.10. Statistical Analysis
Data were collected and analyzed by GraphPad Prism (GraphPad Software, Inc., La Jolla, CA). One‐way ANOVA was performed under the assumptions of normality and equal variances, followed by Newman‐Keuls post hoc multiple comparison testing. For all analyses, fold change values were calculated relative to the resting group. Data are presented as the mean ± S.D. from at least three independent experiments, with p‐value <0.05 was considered to indicate statistically significant.
3. Results
3.1. The Effects of Benzydamine on the LPS‐Induced MMP‐9‐Mediated Gelatinolysis and MMP‐9 Expression Under the Normal‐Glucose Condition
First, the inhibitory effects of benzydamine under the normal‐glucose condition of glucose (11 mM) were investigated in THP‐1 cells. The activity of MMP‐9 in the LPS (50 ng/mL)‐stimulated gelatinolysis was significantly increased to 2.2 ± 0.4‐fold compared with those in the resting group, as determined by zymography (n = 3). Pretreatment with benzydamine (10, 20, and 50 μM) attenuated this LPS‐induced gelatinolysis resulting in 1.9 ± 0.2‐, 1.5 ± 0.2‐, and 1.0 ± 0.1‐fold increases, respectively, compared with the resting group (Figure 1A). Consistently, LPS stimulation significantly increased MMP‐9 protein expression to 2.9 ± 0.3‐fold compared with the resting group by western blotting (n = 3). Benzydamine (50 μM) pretreatment markedly inhibited LPS‐induced expression of MMP‐9 protein to 1.6 ± 0.2‐fold under the normal‐glucose condition (Figure 1B). These findings indicate the inhibitory roles of benzydamine on the LPS‐induced MMP‐9 activity and protein expression in THP‐1 cells.
Figure 1. The effects of benzydamine on the LPS‐induced MMP‐9 gelatinolysis and its protein expression under the normal‐glucose condition. THP‐1 cells (1 × 10^6^ cells/mL) were dispensed onto 24‐well plates, pretreated with benzydamine (10, 20, and 50 μM) for 30 min and then treated with LPS (50 ng/mL) for 24 h under the normal‐glucose condition. Cell‐free supernatants were then assayed for MMP‐9 activity by gelatin zymography. Cellular lysates were obtained and analyzed for MMP‐9 protein expression by western blot. (A) The effect of benzydamine on the LPS‐induced MMP‐9 gelatinolysis of THP‐1 cells (n = 3). (B) The effect of benzydamine on the LPS‐induced MMP‐9 protein expression (n = 3). R, resting; V, vehicle; NG, normal‐glucose. Quantitative data are expressed as mean ± S.D. ^##^ p < 0.01 as compared with the resting group; ^∗^ p < 0.05, ^∗∗^ p < 0.01 as compared with the vehicle group.(A)(B)
3.2. The Effects of Benzydamine on the LPS‐Induced MMP‐9 Activation and TIMP‐1 Production in THP‐1 Cells Under the High‐Glucose Condition
To further compare the effects of LPS‐induced MMP‐9‐mediated gelatinolysis between the normal‐glucose and high‐glucose conditions, gelatin zymography was performed to assess MMP‐9 activity. Under the normal‐glucose conditions (11 mM), LPS (50 ng/mL) increases MMP‐9 activity to 2.2 ± 0.3‐folds compared with the resting group in human THP‐1 cells (n = 4). Under the high‐glucose condition (25 mM), LPS increases MMP‐9 activity to 3.5 ± 1.0‐fold compared with the resting group (n = 4). Notably, exposed to the same concentration of LPS stimulation, MMP‐9 activity was significantly higher in the high‐glucose condition compared with the normal‐glucose condition (Figure 2A). These results revealed that the LPS‐induced gelatinolysis was enhanced under the high‐glucose condition.
Figure 2. The effects of benzydamine on the LPS‐induced gelatinolytic activity and MMP‐9 expression under the high‐glucose condition. THP‐1 cells (1 × 10^6^ cells/mL) were dispensed onto 6‐well plates and stimulated with LPS (50 ng/mL) for 24 h. Cell‐free supernatants were then assayed for MMP‐9‐mediated gelatinolysis by gelatin zymography or TIMP‐1 levels by ELISA, respectively. Cellular lysates were analyzed for MMP‐9 protein expression by western blot. (A) Comparison of MMP‐9‐mediated gelatinolysis induced by LPS in THP‐1 cells under the normal‐glucose (11 mM) or high‐glucose (25 mM) conditions (n = 4). (B) The effects of benzydamine (10, 20, and 50 μM) on MMP‐9 gelatinolysis (n = 3), (C) the expression of MMP‐9 protein (n = 3), and (D) TIMP‐1 levels (n = 3) induced by LPS under the high‐glucose condition. (E) The effect of benzydamine on the THP‐1 cell viability stimulated with LPS under the high‐glucose condition (n = 3) was assessed by MTT assay. (F) The effect of benzydamine on the LPS‐induced MMP‐9 gelatinolysis under the long‐term high‐glucose condition (n = 4). R, resting; V, vehicle; NG, normal‐glucose; HG, high‐glucose. Data are expressed as the means ± S.D. ^#^ p < 0.05, ^##^ p < 0.01, ^###^ p < 0.001 as compared with the resting group; ^∗^ p < 0.05, ^∗∗^ p < 0.01, ^∗∗∗^ p < 0.001 as compared with the vehicle group.(A)(B)(C)(D)(E)(F)
To examined the gelatinolytic inhibitory effect of benzydamine under the high‐glucose condition, THP‐1 cells were cultured with the high‐glucose medium and pretreated with vehicle or benzydamine, and followed by a 24 h LPS stimulation. LPS induced a significant increase of MMP‐9‐mediated gelatinolysis to 1.6 ± 0.1‐folds compared with the resting condition (n = 3). Pretreatment with benzydamine (50 μM) decreased the MMP‐9‐mediated gelatinolysis to 1.1 ± 0.2‐fold compared with the resting group (Figure 2B). The protein expression level was further assessed by western blot. Our result showed that MMP‐9 protein expression was increased to 2.4 ± 0.1‐fold under the high‐glucose condition in LPS‐stimulated THP‐1 cells (n = 3) compared with the resting group. The expression of MMP‐9 protein was significantly inhibited to 1.0 ± 0.8‐fold by benzydamine at 50 μM (Figure 2C). These results were consistent with our previously described results obtained from zymographic studies. Tissue inhibitor of metalloproteinase‐1 (TIMP‐1) is an endogenous protein inhibitor that is able to block MMP‐9 enzyme activity [34]. To further evaluate whether the inhibitory effect of benzydamine on the LPS‐induced MMP‐9 mediated gelatinolysis was resulted from its effect on TIMP‐1, each conditioned medium was collected to analyze TIMP‐1 level. The results showed that stimulation with LPS induced an increase of TIMP‐1 levels from 27.9 ± 3.2 to 43.9 ± 6.8 μg/mL (n = 3), and only benzydamine at 50 μM partially decreased the level of TIMP‐1 to 26.3 ± 4.0‐fold compared with the resting group (Figure 2D). These findings revealed that the MMP‐9 inhibitory effect of benzydamine was not due to an increase level of TIMP‐1 in LPS‐stimulated THP‐1 cells under the high‐glucose condition.
Although 50 μM benzydamine partially reduce cell viability to 0.76 ± 0.05‐fold compared with the resting group (n = 3, Figure 2E), the MMP‐9 activity was suppressed to near the resting group levels (Figure 2B) under the high‐glucose condition, suggesting that the effect of benzydamine on the gelatinolysis is not solely due to its cytotoxicity.
To clarify the effect of benzydamine on the long‐term‐high‐glucose condition, THP‐1 cells were first incubated with high‐glucose medium for 24 h, then treated with benzydamine (10, 20, and 50 μM) and followed by LPS stimulation for another 24 h. Consistently, benzydamine could concentration‐dependently and significantly inhibit gelatinolysis under the long‐term high‐glucose condition (n = 4, Figure 2F). In summary, these findings revealed that benzydamine exhibited inhibitory effects on the LPS‐stimulated MMP‐9 expression and gelatinolysis under the high‐glucose condition.
3.3. The Effects of Benzydamine on the TNF‐α‐Induced MMP‐9 Gelatinolysis and Its Expression Under the Normal‐Glucose Condition
Since LPS significantly induces TNF‐α production [29] and TNF‐α can promote MMP‐9 mediated gelatinolysis in THP‐1 cells [35], the effect of benzydamine on the TNF‐α‐induced MMP‐9 activation was evaluated under the normal‐glucose condition. Zymographic results consistently confirmed that benzydamine (20 and 50 μM) inhibited TNF‐α (10 ng/mL)‐induced MMP‐9 gelatinolysis from 11.2 ± 1.8‐fold to 6.0 ± 1.9‐ and 2.26 ± 0.6‐fold compared with the resting group in THP‐1 cells (n = 4, Figure 3A). Thereafter, to assess whether benzydamine attenuates TNF‐α‐induced MMP‐9 protein expression in a similar manner, gelatin zymography was performed. After 24 h of stimulation with TNF‐α, the expression of cellular MMP‐9 protein increased to 4.9 ± 0.1‐fold compared with the resting group (n = 3). Benzydamine attenuated the TNF‐α‐induced expression of MMP‐9 protein to 3.0 ± 0.4‐, 2.4 ± 0.1‐, and 1.5 ± 0.2‐fold compared with the resting group at concentrations of 10, 20, and 50 μM, respectively (Figure 3B).
Figure 3. The effects of benzydamine on the TNF‐α‐induced MMP‐9 gelatinolysis, protein and its mRNA expression under the normal‐glucose condition. THP‐1 cells (1 × 10^6^ cells/mL) were dispensed onto 24‐well plates with normal‐glucose medium, cells were pretreated with benzydamine (10, 20, and 50 μM) or vehicle (DMSO) for 30 min before the stimulation with 24 h TNF‐α (10 ng/mL). (A) Cell‐free supernatants were analyzed for MMP‐9 activity by gelatin zymography (n = 4) and (B) cellular lysates were then evaluated for MMP‐9 protein by WB (n = 3). (C) After stimulation of TNF‐α for 6 h, followed by extraction of total RNA and analysis of mRNA levels of MMP‐9 and GAPDH. RT‐PCR was performed as described in the method section (n = 3). R, resting; V, vehicle; NG, normal‐glucose. Data are expressed as the mean ± S.D. ^###^ p < 0.001 as compared with the resting group; ^∗∗^ p < 0.01, ^∗∗∗^ p < 0.001 as compared with the vehicle group.(A)(B)(C)
Next, we observed whether the transcription of TNF‐α‐stimulated MMP‐9 mRNA was affected by benzydamine under the normal‐glucose condition. The results showed that the expression of MMP‐9 mRNA was strongly increased after 6 h of the treatment with TNF‐α (10 ng/mL), with an increase of 3.9 ± 0.3‐fold compared with the resting group (n = 3). After pretreatment with benzydamine (10, 20, and 50 μM), MMP‐9 mRNA expression was markedly reduced in a concentration‐dependent manner to 2.6 ± 0.5‐, 2.2 ± 0.7‐, and 1.5 ± 0.5‐fold compared with the resting group, respectively (Figure 3C).
3.4. The Effects of Benzydamine on the Activation of the MAPKs and NF‐κB Signaling Under the High‐Glucose Condition
It has been known that the activation of MAPK and NF‐κB pathways play critical roles in LPS‐stimulated monocytes [36, 37]. Therefore, we investigated whether activation of the p38, JNK, and ERK MAPK pathways were involved in the inhibitory actions of benzydamine on the LPS‐stimulated THP‐1 cells in the high‐glucose media. Cells were cultured in the high‐glucose media for 24 h followed by the treatment with benzydamine (10, 20, and 50 μM) for 30 min before 1 h LPS (50 ng/mL) stimulation.
The immunoblotting results showed that the expression of the phosphorylated p38 and JNK MAPKs were significantly increased to 2.06 ± 0‐ (n = 3) and 1.9 ± 0.6‐fold (n = 4), respectively, in the LPS‐stimulated groups compared with the resting group. However, treatment with benzydamine (10, 20, and 50 μM) did not interfere with the expression of their phosphorylated signaling proteins of p38 and JNK MAPKs (Figure 4A, B) under the high‐glucose condition.
Figure 4. The effects of benzydamine on MAPK and NF‐κB activation in LPS‐stimulated THP‐1 cells under the high‐glucose condition. THP‐1 cells (1 × 10^6^ cells/mL) were dispensed onto 6‐well plates for 24 h under the high‐glucose medium, then treated with benzydamine (10, 20, and 50 μM) for 30 min before stimulated with LPS (50 ng/mL). Cells were collected after stimulation with LPS for 1 h. Cellular lysates were analyzed by western blot to determine the level of phosphorylated (A) p38 MAPK (n = 3), (B) JNK MAPK (n = 4), (C) p65 (n = 3), and (D) ERK MAPK (n = 4) as indicated. R, resting; V, vehicle; HG, high‐glucose. Data are expressed as the mean ± S.D. ^#^ p < 0.05, ^##^ p < 0.01 as compared with the resting; ^∗^ p < 0.05, ^∗∗^ p < 0.01, ^∗∗∗^ p < 0.001 as compared with the vehicle group.(A)(B)(C)(D)
Furthermore, immunoblotting analyses revealed that stimulation with LPS (50 ng/mL) caused a marked increase of phosphorylated p65 to 1.6 ± 0.1‐fold (n = 3). Benzydamine (10, 20, and 50 μM) had the significant inhibitory effect on the expression of phosphorylated p65 to 1.1 ± 0.2‐, 1.1 ± 0.1‐, and 0.9 ± 0.2‐fold, respectively. These findings revealed that this drug could inhibit LPS‐stimulated NF‐κB signaling activation in human monocytic cells under the high‐glucose condition (Figure 4C).
Surprisingly, our data revealed that the expression of phosphorylated ERK in the LPS‐stimulated hyperglycemia group increased to 1.4 ± 0.3‐fold compared with the resting group (n = 4). Benzydamine reduced ERK phosphorylation to 1.1 ± 0.2‐, 1.1 ± 0.1‐, and 0.9 ± 0.2‐fold compared with the resting group at concentrations of 10, 20, and 50 μM, respectively (Figure 4D). These results clearly indicate that ERK MAPK may be a target of benzydamine that reduces MMP‐9 expression and activity on the LPS‐stimulated THP‐1 cells.
3.5. The Effect of Benzydamine on the Activation of the pERK Translocation Under the High‐Glucose Condition
To further evaluate the effect of benzydamine on pERK, nuclear pERK translocation was investigated by confocal immunofluorescent studies. The pERK was translocated into the nucleus after LPS stimulation. Benzydamine (50 μM) could inhibit the LPS‐induced translocation of pERK (Figure 5A) into the nucleus (n = 4). U0216 (40 μM), as an ERK inhibitor also had a significant inhibitory effect on the pERK nuclear translocation (Figure 5A). Additionally, gelatin zymography was used to validate the role of ERK on the LPS‐induced gelatinolysis. Our data revealed that U0126 at 10, 20, and 40 μM markedly attenuated the LPS‐induced gelatinolysis to 2.7 ± 1.3‐, 1.7 ± 0.8‐, and 1.5 ± 0.4‐fold compared with the resting group under the high‐glucose condition (n = 4, Figure 5B). In summary, these results suggested that benzydamine significantly inhibit the activation of ERK MAPK in LPS‐activated THP‐1 cells under the high‐glucose condition.
Figure 5. The effect of benzydamine on LPS‐induced pERK translocation in THP‐1 cells. (A) THP‐1 cells were dispensed onto 6‐well plates until 70–80% confluent under hyperglycemic condition, then cells were pretreated with vehicle, benzydamine (50 μM), or U0126 (40 μM) for 30 min, and subsequently stimulated with LPS (50 ng/mL) for 1 h. Confocal fluorescence analysis was performed as described in methods section. Translocation of pERK from cytosol to the nucleus in THP‐1 cells is shown. The green fluorescence represents pERK detected by an anti‐pERK antibody followed by a Dylight 488‐conjugated secondary antibody. The blue fluorescence represents nuclei stained with DAPI (n = 4). (B) The cell‐free supernatants were analyzed for MMP‐9‐mediated gelatinolysis by gelatin zymography to evaluate the effects of U0126 (10, 20, and 40 μM) and benzydamine (20 μM) on MMP‐9 gelatinolysis (n = 4). R, resting; V, vehicle; HG, high‐glucose condition. Data are expressed as the mean ± S.D. ^###^ p < 0.001 as compared with the resting; ^∗∗∗^ p < 0.001 as compared with the vehicle.(A)(B)
3.6. The Effects of Benzydamine on the LPS‐Induced Surface Expression of TLR‐4 Expression in THP‐1 Cells Under the High‐Glucose Condition
LPS is known to induce proinflammatory mediator expression through cell surface receptor, especially TLRs [38]. A previous study also showed that surface TLR‐4 is upregulated in monocytes when treated with LPS [39]. To clarify the additional anti‐inflammatory functions of benzydamine, the LPS‐induced surface TLRs expression was determined under the high‐glucose condition by flow cytometric analysis. Our data revealed that surface TLR‐4 was significantly upregulated in the LPS‐stimulated THP‐1 cells compared with the resting group under the high‐glucose condition (n = 3). Benzydamine (50 μM) significantly inhibited the upregulation of surface TLR‐4 protein on the LPS‐stimulated THP‐1 cells under the high‐glucose condition (Figure 6). Interestingly, U0126 (40 μM) effectively decreased the expression of surface TLR‐4 protein (Figure 6B), which is consistent with previous study [40]. These results revealed the inhibitory role of benzydamine on the LPS‐induced surface TLR‐4 upregulation under the high‐glucose condition.
Figure 6. The effects of benzydamine on the LPS‐induced surface TLR‐4 expression the high‐glucose condition. THP‐1 cells (1 × 10^6^ cells/mL) were dispensed onto 6‐well plates for 30 min under the high‐glucose condition, then cells were pretreated with vehicle, benzydamine (50 μM), or U0126 (40 μM) for 30 min, and subsequently stimulated with LPS (50 ng/mL) for 1 h. Confocal fluorescence analysis was performed as described in methods section. Flow cytometric analyses of TLR‐4 cell surface expression in THP‐1 cells pretreated with benzydamine (B, 50 μM) or U0126 (U, 40 μM), and then stimulated with LPS (50 ng/mL) for 24 h or left untreated (control) under the high‐glucose medium. Quantitative analysis of TLR‐4 expression is expressed as the percentage of the total cells (n = 3). R, resting; V, vehicle; HG, high‐glucose condition. Data are expressed as the mean ± S.D. ^#^ p < 0.05, ^##^ p < 0.01 as compared with the resting group; ^∗^ p < 0.05, ^∗∗^ p < 0.01, ^∗∗∗^ p < 0.001 as compared with the vehicle.(A)(B)
4. Discussion
According to our findings, LPS‐induced MMP‐9 gelatinolysis was enhanced in THP‐1 cells under the high‐glucose condition. Benzydamine could alleviate the enhanced LPS‐induced MMP‐9 gelatinolysis and protein expression in THP‐1 cells by the inhibition of ERK phosphorylation under the high‐glucose condition. In addition, benzydamine also significantly inhibited LPS‐ and TNF‐α‐induced MMP‐9‐mediated gelatinolysis and expression under the normal‐glucose condition.
Hyperglycemia is a condition associated with deterioration in sepsis and COVID‐19 infection [41, 42]. Compared with non‐DM patients, DM patients with metabolic abnormalities including insulin resistance and hyperglycemia may have increased concentrations of gastrointestinal LPS concentrations in circulation [43]. Furthermore, reduced intestinal motility is common in DM patients, which is a devastating condition that impacts bacterial growth and increases endotoxemia [3]. LPS, as an endotoxin, is a bacterial pathogen‐associated molecular patterns that can induce the overproduction of inflammatory mediators, leading to dangerous conditions or progression to sepsis, and increased mortality [44]. In several infectious diseases, such as comorbid with COVID‐19 infection, proinflammatory cytokines also play very important roles in the cytokine storm and various pathological stages [45].
In clinical findings, MMP‐9 has the important and pathological roles in diabetic complications, such as retina neuropathy [46] and worsening aortic dissection [47]. A variety of MMPs are correlated with myocardial infarction. The increase concentration of MMPs after myocardial infarction, can also lead to left ventricular dysfunction with heart failure [48]. Increased MMP‐9 levels can be found when monocyte/macrophage are stimulated with TNF‐α, LPS, or other proinflammatory cytokines [35]. DM complications are associated with high levels of inflammatory cytokines such as IL‐1β, IL‐6, and TNF‐α [49]. MMP‐9 level was also increased under high‐glucose condition in microvascular endothelial cells [50]. These pathological factors boost the development of nephropathy, retinopathy, and cardiovascular disease in patients with diabetes [42, 51, 52]. High‐glucose could stimulate macrophage to induce production of proinflammatory and pro‐fibrotic factors [53]. Consistent with previous findings, our data indicated that LPS could induce higher gelatinolysis under the high‐glucose compared with the normal‐glucose condition. Following the administration of benzydamine, the LPS‐stimulated MMP‐9 expression and activation were significantly decreased compared with the resting group under the high‐glucose condition. These results support our hypothesis that benzydamine might possess a potential role on the monocyte‐mediated matrix‐degrading action in sepsis with hyperglycemia.
The action of MMP‐9 is related to the activity of the endogenous tissue inhibitor TIMP‐1. Previous studies have identified the important role of TIMP‐1 in clinical issues such as the diagnosis and treatment of sepsis [54, 55]. Additionally, Local expression of TIMP‐1 was indicated to prevent MMP‐9‐related inflammatory complication, for example, rupture of aneurysms [56]. Our data showed that benzydamine could decrease the level of TIMP‐1 under the high‐glucose condition. These results indicated that benzydamine has inhibitory effects on MMP‐9 expression and activation, but not through an increase in TIMP‐1 level.
TLR‐4 is a transmembrane protein that belongs to the pattern‐recognition receptor family of the innate immune system. The initial trigger action of LPS is the activation of the surface receptor TLR‐4 protein, which further transfer the signals into the intracellular effectors in macrophage/monocyte lineage [38]. It has been demonstrated that hyperactivation of TLR‐4 triggers the production of various inflammatory factors that are related to the development of a variety of diseases [57]. The anti‐inflammatory potential of TLR‐4 inhibitors have been validated, and may serve as drugs for the treatment of various diseases, including sepsis, intestinal inflammation, diabetes‐induced high blood pressure, and COVID‐19 [57]. Furthermore, it has been known that LPS stimulation significantly induces the expression of TLR‐4 protein under high‐glucose condition [58]. Additionally, the activation of ERK MAPK has been demonstrated to play a role in the inflammatory cascades induced by LPS‐stimulated murine neutrophils [59]. The literature was also revealed that ERK signaling inhibition could abrogate inflammatory actions in microglial cells [60]. Furthermore, previous study showed that ERK1/2 activation inhibitor‐U0126 can inhibit LPS‐stimulated MMP‐9 production in THP‐1 cells [61]. And, benzydamine was shown to alleviate MCP‐1‐induced ERK activation in monocytes [62]. Consistent with previous studies, our data showed that benzydamine decreased LPS‐stimulated elevation of the surface TLR‐4 protein expression under the high‐glucose condition, and U0126 also showed a marked effect. These findings suggested that benzydamine might serve as a potential drug for TLR‐4‐related diseases associated with hyperactivation. Moreover, in addition to MAPK, cellular TLR‐4 activation can also induce the NF‐κB signaling pathways, which promote the induction of the production of various inflammatory cytokines [63]. Furthermore, long‐term high‐glucose was also suggested to enhance activation of NF‐κB in LPS‐stimulated macrophages [64]. It was recently found that benzydamine could reduce IKK, ERK, and p38 MAPK, leading to the inhibition of IL‐1β synthesis in osteoclast activation [25]. And, benzydamine was also shown to alleviate MCP‐1‐induced ERK activation in monocytes [62], which may support our result that benzydamine reduced ERK activation in LPS‐inhibited THP‐1 cells under hyperglycemic condition. On the other hand, inhibition of LPS‐induced p38 or JNK MAPK activation could regulate cellular inflammation by downregulation of IL‐6 and TNF‐α production [65, 66]. However, benzydamine showed little effect on LPS‐induced activation of p38 and JNK MAPKs in this study. These finding suggested that, under combined stress of high‐glucose and acute inflammatory stimuli, phosphorylated ERK, but not p38 and JNK MAPKs, might plays an important role in the LPS‐induced MMP‐9 expression and gelatinolysis.
A hyperosmolar hyperglycemic state is one of the critical complications of diabetes [67]. It was indicated that hyperglycemia leads to hypertonic conditions and result in cellular damage and inflammation [68]. Additionally, some drugs have been suggested to ameliorate hypertonicity‐induced inflammation [18, 69]. In our previous study, hypertonic sucrose was shown to increase TNF‐α production and enhance ERK activation in LPS‐stimulated THP‐1 cells [70]. In this study, glucose was used to create hyperglycemic conditions as a hypertonic condition for THP‐1 cells, which could explain the enhancement of ERK activation under LPS stimulation. Some reports have shown that hypertonic stress can affect mitogen‐activated protein kinases (MAPKs) [71] and specific components, such as TAK1 and MEKKs [72]. In our result, based on the downregulation of ERK activation under the high‐glucose condition, it was proposed that benzydamine may exert its effect through upstream regulators, such as Ras or MEKK1/2 [73, 74], but this hypothesis needs further investigation.
COVID‐19 infection is characterized by an aggressive multisystem inflammatory complication known as a cytokine storm, in which monocytes are implicated through overproduction and release of inflammatory cytokines and mediators [75]. Recently, it was found that the S1 protein activates human monocytes through the galectin‐3 interaction to produce inflammatory cytokines, as reported in COVID‐19‐related cytokine release syndrome [76]. Consistently, stimulation of PBMCs with spike protein resulted in an increase in IL‐2 and TNF‐α [77]. A recent report showed that the SARS‐CoV‐2 Delta variant spike protein enhances inflammatory cytokine production in human monocytic THP‐1 cells [78]. According to our findings, S1 protein could stimulate MMP‐9‐mediated gelatinolysis in THP‐1 monocytic cells under hyperglycemic conditions (n = 3, Figure S1). The literature has demonstrated that the S1 protein might bind to additional receptors or effectors, such as neuropilin‐1 [79], TLR‐4 [80], and galectin‐3‐associated proteins [76]. According to our findings, benzydamine inhibited S1 protein‐induced MMP‐9‐mediated gelatinolysis. Our results implied that its inhibitory effects on ERK or NF‐κB might play the important role, as shown by the findings of TLR‐4 [80], and these mechanisms need further investigation.
It is important to mention some limitations of our study. Although physiological glucose levels are approximately 5 mM [81], we used 11 mM as the normal‐glucose condition, because RPMI‐1640 contains 11 mM glucose in RPMI‐1640, which supports optimal growth of THP‐1 cells. Previous studies also used 11 mM RPMI‐1640 as normal‐glucose when comparing with higher glucose conditions [82, 83]. Therefore, despite being slightly higher than physiological blood glucose, 11 mM can still be used as a baseline to see the effects of higher glucose in our experiments.
Taken together, this study elucidated that benzydamine attenuates LPS‐induced MMP‐9 expression and activation predominantly by inhibiting the ERK MAPK signaling pathway in activated THP‐1 monocytes under the high‐glucose condition. Given the downregulatory effect of benzydamine on MMP‐9 expression, this classical NSAID with dual functions should be further investigated in animal models or used as a potential therapeutic agent for tissue‐degrading effects under diabetic endotoxemia.
NomenclatureLPS:LipopolysaccharideMMP:Matrix metalloproteinaseTNF‐α:Tumor necrosis factorERK/MAPK:Extracellular‐signal‐regulated kinase/mitogen‐activated protein kinaseNF‐κB:Nuclear transcription‐factor kappa BDM:Diabetes mellitusTLR‐4:Toll‐like receptor‐4
Funding
This research was financially supported by the Ministry of Science and Technology, Taiwan (Grants MOST 105‐2320‐B‐038‐041 and MOST 107‐2320‐B‐038‐025‐MY3) and the Taipei Medical University (Grant TMU‐NDMC‐11302).
Conflicts of Interest
The authors declare no conflicts of interest.
Supporting Information
Additional supporting information can be found online in the Supporting Information section.
Supporting information
Supporting Information Figure S1. The effects of benzydamine on the S1 protein (wild‐type SARS‐CoV‐2)‐induced MMP‐9 gelatinolysis in THP‐1 cells under the high‐glucose condition.
The reference list from the paper itself. Each links out to its DOI / PubMed record.
- 1Arina P. and Singer M. , Pathophysiology of Sepsis, Current Opinion in Anaesthesiology. (2021) 34, no. 2, 77–84, 10.1097/ACO.0000000000000963.33652454 · doi ↗ · pubmed ↗
- 2Singer M. , Deutschman C. S. , and Seymour C. W. , et al.The Third International Consensus Definitions for Sepsis and Septic Shock (Sepsis-3), Journal of the American Medical Association. (2016) 315, no. 8, 801–810, 10.1001/jama.2016.0287, 2-s 2.0-84959273475.26903338 PMC 4968574 · doi ↗ · pubmed ↗
- 3Gomes J. M. G. , Costa J. A. , and Alfenas R. C. G. , Metabolic Endotoxemia and Diabetes Mellitus: A Systematic Review, Metabolism-Clinical and Experimental. (2017) 68, 133–144, 10.1016/j.metabol.2016.12.009, 2-s 2.0-85007413742.28183445 · doi ↗ · pubmed ↗
- 4de Miguel-Yanes J. M. , Méndez-Bailón M. , Jiménez-García R. , Hernández-Barrera V. , Pérez-Farinós N. , and López-de-Andrés A. , Trends in Sepsis Incidence and Outcomes Among People With or Without Type 2 Diabetes Mellitus in Spain (2008-2012), Diabetes Research and Clinical Practice. (2015) 110, no. 3, 266–275, 10.1016/j.diabres.2015.10.008, 2-s 2.0-84955213410.26489822 · doi ↗ · pubmed ↗
- 5Kruglikov L. L. , Shah M. , and Scherer P. E. , Obesity and Diabetes as Comorbidities for COVID-19. Underlying Mechanisms and the Role of Viral-Bacterial Interactions, E Life. (2020) 9, 10.7554/e Life.61330, e 61330.32930095 PMC 7492082 · doi ↗ · pubmed ↗
- 6Chousterman B. G. , Swirski F. K. , and Weber G. F. , Cytokine Storm and Sepsis Disease Pathogenesis, Seminars in Immunopathology. (2017) 39, no. 5, 517–528, 10.1007/s 00281-017-0639-8, 2-s 2.0-85019757791.28555385 · doi ↗ · pubmed ↗
- 7Cavaillon J. M. , Chousterman B. G. , and Skirecki T. , Compartmentalization of the Inflammatory Response During Bacterial Sepsis and Severe COVID-19, Journal of Intensive Medicine. (2024) 4, no. 3, 326–340, 10.1016/j.jointm.2024.01.001.39035623 PMC 11258514 · doi ↗ · pubmed ↗
- 8Zamanian M. Y. , Alsaab H. O. , and Golmohammadi M. , et al.NF-Kappa B Pathway as a Molecular Target for Curcumin in Diabetes Mellitus Treatment: Focusing on Oxidative Stress and Inflammation, Cell Biochemistry and Function. (2024) 42, no. 4, 10.1002/cbf.4030, e 4030.38720663 · doi ↗ · pubmed ↗