Epigenetic maintenance of the injury response state in glioblastoma stem cells
Fatemeh Molaei, Graham MacLeod, Shahan Haider, Aleczandria Tiffany, Frank M Oteng, Jacob M Berman, Arianna Skirzynska, Molly S Shoichet, Daniel Schramek, Peter B Dirks, Stephane Angers

TL;DR
This study identifies EP300 as a key gene that maintains the aggressive injury response state in brain tumor stem cells, offering a potential target for treatment.
Contribution
The study reveals EP300 as a novel regulator of the injury response state in glioblastoma stem cells.
Findings
Perturbation of EP300 reduces CD44 expression and disrupts the injury response state in glioblastoma stem cells.
Loss of EP300 leads to decreased self-renewal and invasion in glioblastoma stem cells.
EP300 inhibition delays tumor initiation and progression in a mouse model of glioblastoma.
Abstract
Glioblastoma (GBM) is a common and highly lethal type of primary brain tumor in adults. Therapeutic failure is partly attributed to a fraction of glioblastoma stem cells (GSCs) that show high levels of heterogeneity and plasticity. Glioblastoma stem cells exist in a transcriptional gradient between 2 states: Developmental (Dev) and injury response (IR), in which IR-GSCs exhibit more invasive behaviors. While previous studies have identified fitness genes in GSCs, the genes required to establish and maintain the Dev and IR states remain poorly defined. To identify the regulators of the IR-GSC state, we performed a phenotypic genome-wide CRISPR-Cas9 knockout screen in patient-derived GSCs based on cell surface expression of the IR marker CD44. Validation of EP300 in regulation of IR state was performed using CRISPR gene editing and A-458 inhibitor treatment. RNA-seq, CUT&RUN, invasion…
Genes, proteins, chemicals, diseases, species, mutations and cell lines named across the full text — each resolved to its canonical identifier and authoritative record.
Click any figure to enlarge with its caption.
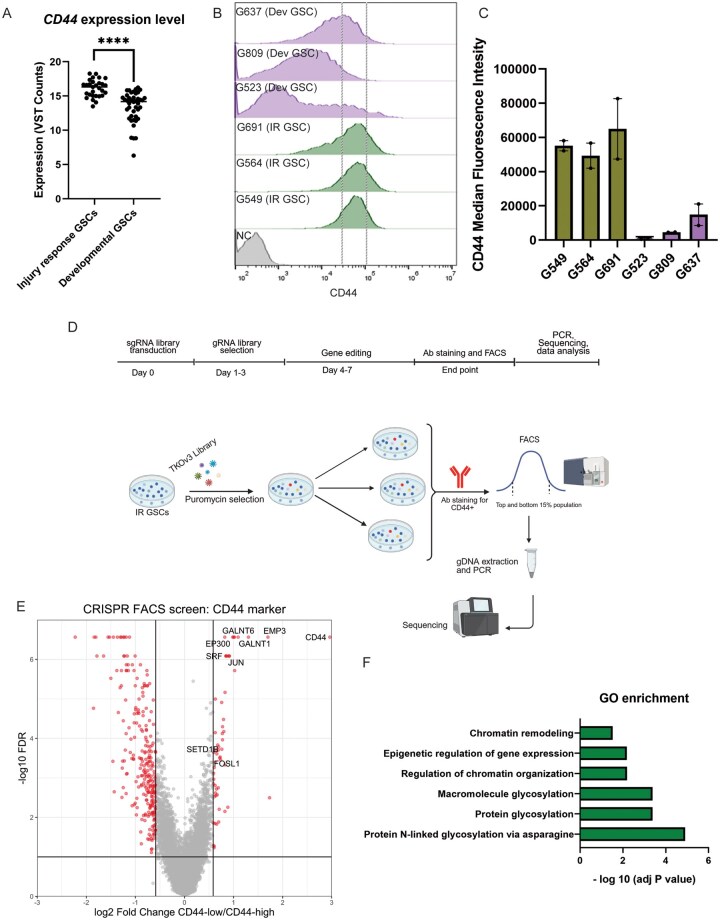 Figure 1
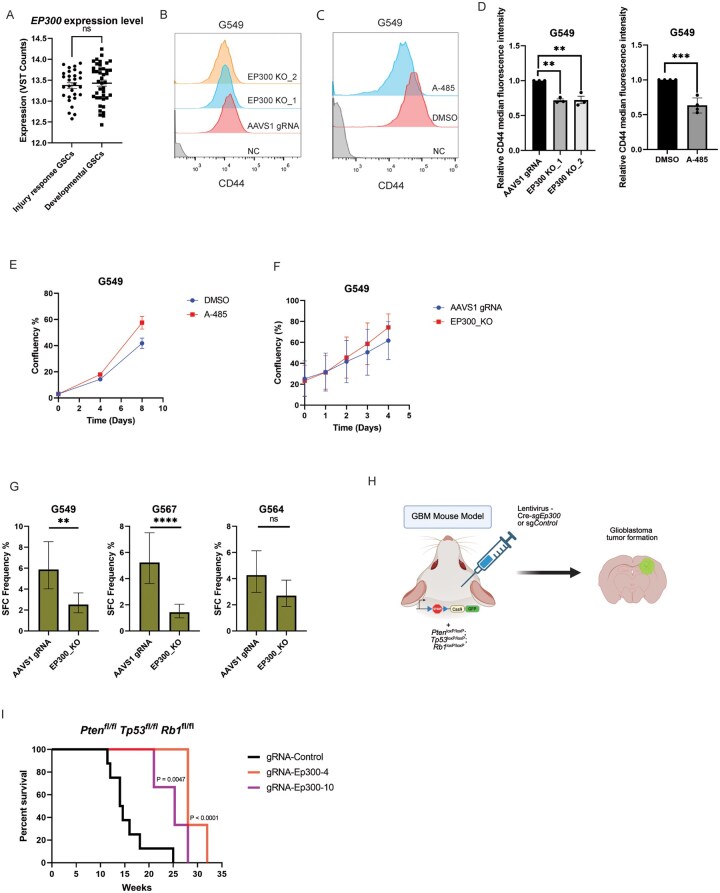 Figure 2
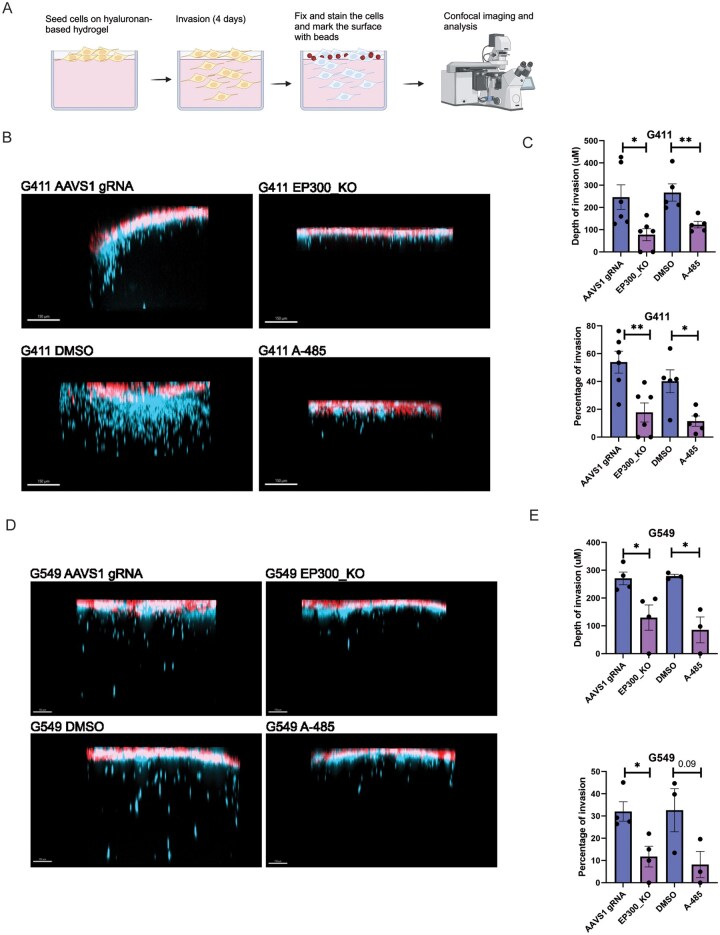 Figure 3
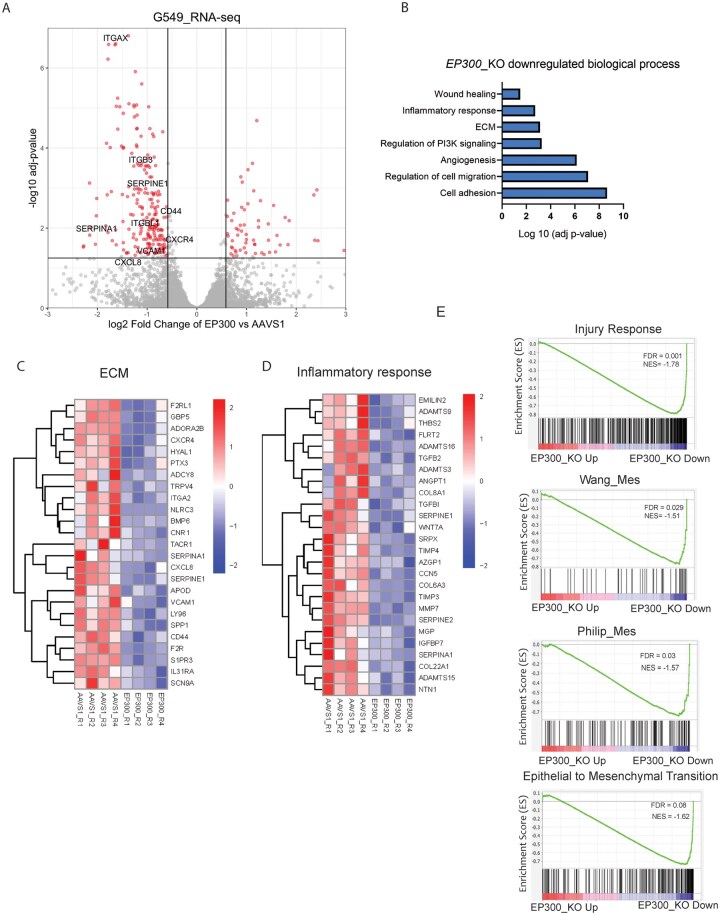 Figure 4
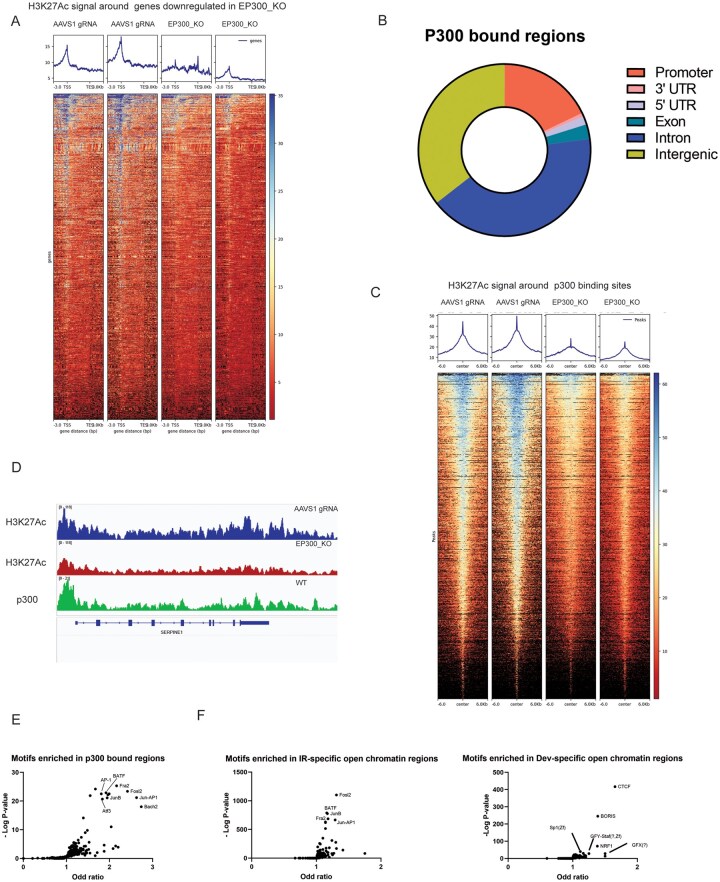 Figure 5
- —Canadian Institutes of Health Research10.13039/501100000024
Peer Reviews
No public reviews on file for this paper yet. If you reviewed it on a platform where reviews are public (OpenReview, ICLR, NeurIPS, ICML), you can paste yours below so the community can read it here.
Videos
No videos yet. Explain this paper in a talk, walkthrough, or lecture? Add one.
Taxonomy
TopicsGlioma Diagnosis and Treatment · Pluripotent Stem Cells Research · Protein Degradation and Inhibitors
Isocitrate dehydrogenase (IDH)-wild type glioblastoma (GBM) is the most common and aggressive form of brain tumor in adults that remains incurable. Genomic and transcriptomic studies in GBM tumor samples have revealed considerable intertumoral heterogeneity in bulk tumors and classified GBM tumors into 3 major subtypes according to their gene expression profiles: Proneural, Classical and Mesenchymal.1 However, recent single-cell RNA-seq analyses revealed the detection of cells from multiple subtypes within individual tumors, with the dominant subtype driving bulk tumor classification.2 This suggests that intratumoral heterogeneity is a significant driver of the intertumoral heterogeneity observed in bulk tumors. This same study classified GBM cells into 4 malignant cellular states that recapitulate the transcriptomic program of neural-progenitor-like, oligodendrocyte-progenitor-like, astrocyte-like, and mesenchymal-like states.2 In addition, multiple studies have demonstrated evidence of plasticity in GBM cells, with individual clones being capable of recapitulating the heterogeneous nature of GBM tumors by giving rise to cells of multiple cellular states in xenograft models.3 Therapeutic failure in GBM can largely be attributed to high levels of intratumoral heterogeneity and plasticity.2
At the root of GBM lies the glioblastoma stem cells (GSCs) that are characterized by tumor initiation, self-renewal, and differentiation abilities.4 Glioblastoma stem cells contribute to neovascularization, invasion, therapeutic resistance, and recurrence and are a source of intratumoral heterogeneity and plasticity.5 Recent single-cell and bulk RNA-seq characterization of a large panel of patient-derived cultures demonstrated that GSCs can be grouped into 2 major cellular states according to their gene expression profiles: Developmental (Dev) and Injury Response (IR) that underlie the previously described Proneural and Mesenchymal GBM subtypes, respectively.6 Importantly, rather than 2 distinct fixed subtypes, GSCs exist in a transcriptional gradient between the Dev and IR states, indicative of cellular plasticity that contributes to intratumoral heterogeneity in GBM tumors. A growing body of evidence indicates that in response to standard-of-care treatment (chemotherapy plus radiation) or exposure to cytokines, Dev/Proneural cells can transition to a more IR/Mesenchymal phenotype, which is more invasive and therapy-resistant, contributing to a worse prognosis.6 Additional characterization using bulk and single-cell ATAC-seq profiling revealed 3 chromatin states in GSCs: Constructive, Reactive, or Invasive.7 Invasive and Reactive GSC cultures have IR expression signatures, thus likely representing further functional stratification of the IR subtype, while the Constructive GSCs align with Dev signatures.
Genome-wide and targeted CRISPR-Cas9 fitness screens on panels of GSCs have revealed differences in genetic dependencies between subtypes and the existence of a gene fitness gradient between IR and Dev GSCs, functionally manifesting the transcriptional gradient.6 While these screens provide a wealth of information on functional differences between the subtypes, precisely how the transcriptional gradient between GSC subtypes is established and maintained is not fully understood, although it is likely influenced by genetic abnormalities, cell-cell interactions, and clonal variation.3 Knowledge of which genes are required to maintain the IR-GSC state would greatly increase our understanding of GSC biology. In theory, if the genes or networks required for the maintenance of this more aggressive state were perturbed, malignant cells could be “locked” into a less aggressive phenotypic state, and the prognosis for patients could be improved.
In this study, we performed a genome-wide flow cytometry-based CRISPR-Cas9 phenotypic screen on patient-derived IR GSCs to identify genes required to maintain the most aggressive IR-GSC state. We identified EP300, encoding the histone acetyltransferase p300, as a master regulator of the IR state. Genetic or pharmacological perturbations of EP300 disrupted the epigenome and shifted GSCs out of the IR state, subsequently reducing invasiveness, self-renewal, and tumor progression. Taken together, our study revealed new IR phenotype regulators and established a potential therapeutic opportunity to interfere with the maintenance of the IR state to reduce GBM tumorigenicity.
Methods
Ethics
All experimental procedures of this study were conducted in accordance with the Tri-Council Policy Statement: Ethical Conduct for Research Involving Humans (Canada) and were approved by Research Ethics Boards at The Hospital for Sick Children (Toronto, Canada) and the University of Toronto. Animal husbandry, ethical handling of mice, and all animal work were carried out according to guidelines approved by the Canadian Council on Animal Care and under protocols approved by the Toronto Centre for Phenogenomics Animal Care Committee (18-0272H).
Cell Culture
Glioblastoma stem cell cultures previously derived from brain tissue collected with informed consent from patients6 were grown adherently on Poly-L ornithine (Sigma Aldrich) and laminin (Sigma Aldrich)-coated plates as previously described.8
HEK293T cells were cultured in DMEM media supplemented with 10% Fetal Bovine Serum (FBS) and 1% pen-strep (Life Technologies). The following drugs, when used, were dissolved in DMSO: A-485 (Tocris, Cat. No. 6387) and Temozolomide (TMZ; MilliporeSigma).
All GSCs were confirmed to match their parental primary GBM tumors through STR profiling at The Centre for Applied Genomics (Toronto, Ontario, Canada). Cells were periodically subjected to testing with the MycoAltert Plus mycoplasma detection kit (Lonza Biosciences) to confirm the absence of contamination. In-depth characterization of GSC cultures used in this study, including assignment of “subtype” by RNA-seq and assessment of sphere-forming potential, was previously described.6
Genome-Wide CRISPR-Cas9 Screen
CRISPR-Cas9 knockout (KO) screen was performed using the 70K TKOv3 library (Addgene Pooled Library #90294)9; 4 × 10^8^ cells were transduced with a multiplicity of infection of 0.3 in the presence of 0.8 µg/mL of polybrene and plated into 10 cm plates. Twenty-four hours post transduction, the media was removed, and fresh GSC media containing 2 μg/mL puromycin was added to cells. After 3 days of puromycin selection, cells were harvested, counted, and 2 ×10^7^ cells were collected as a T0 sample, and the remaining pool of cells were divided into 3 biological replicates. A minimum 200-fold library coverage was maintained for all replicates. After 4 additional days of culture, cells were harvested, washed once with Phosphate-buffered saline (PBS), blocked on ice for 30 min with 3% BSA, and stained with CD44 antibody (1:200, Invitrogen Cat No: 56044180) plus eBioscience Fixable Viability Dye eFluor 450 (1:500, Invitrogen Cat No: 65-0863-14) for 1 h on ice in the dark. After staining, cells were washed 2 × with PBS and fixed with 1% Paraformaldehyde (PFA) for 10 min at room temperature in the dark. Cells were washed with PBS and resuspended in PBS, 0.5% BSA, and 1 mM EDTA. Fluorescence-Activated Cell Sorting (FACS) was performed on BD Influx and BD FACS Aria III instruments (BD Biosciences). The top 15% and bottom 15% of CD44-expressing cells per replicate were collected for further processing.
Genomic DNA extraction and sequencing library preparation were performed as previously described.9^,^10 Barcoded sequencing libraries were sequenced using a NextSeq500 instrument (Illumina) at a read depth of 200-fold for all samples. Sequencing was performed at the Network Biology Collaborative Centre, Lunenfeld-Tanenbaum Research Institute (nbcc.lunenfeld.ca, Toronto).
CRISPR-Cas9 Gene Editing
To generate single gene KO, individual gRNAs were ligated into Esp3I-digested LentiCRISPRV2 (LCV2) vector (Addgene catalog #52961), and lentivirus was produced as described previously.9 For KO, 3 ×10^5^ GSCs were transduced in the presence of 0.8 μg/mL polybrene. After 24 h, cells were selected with 2 μg/mL puromycin for 3 days prior to seeding for performing various experiments. To quantify gene editing efficiency, TIDE11 was used from PCR amplicons flanking gRNA target sites. For a complete list of gRNA sequences, see Table S2.
RNA Sequencing
Total RNA was isolated from cells transduced with AAVS1 or EP300-targeting gRNAs using the TRIzol reagent (Thermofisher). Sequencing was performed at the Donnelly Sequencing Center at the University of Toronto (https://thedonnellycentre.utoronto.ca/donnelly-sequencing-centre). The quality of RNA was measured using BioAnalyzer (Agilent), and RNA-seq libraries (4 biological replicates each sample) were derived using NEBNext Poly(A) mRNA Magnetic Isolation Module followed by NEBNext Ultra II Directional RNA library prep kit. Libraries were loaded on a NovaSeq6000 (Illumina) at 320 pMol with 150 paired-end reads. The trimmed reads were aligned to the reference genome (UCSC hg19) using Kallisto,12 and differential expression analysis was performed using the DESeq2 package.13 Further analysis was performed using gProfiler and gene set enrichment analysis (GSEA) software.14
Quantitative Polymerase Chain Reaction
RNA was extracted using the TRIzol reagent (Thermofisher), and 2 μg of total RNA was used for cDNA synthesis using Super-Script II reverse transcription kit (Thermo Fisher). Quantitative polymerase chain reaction (qPCR) was performed using SyBrGreen (ThermoFisher) on a BioRAD CFX instrument. The primer sequences can be found in Table S3.
Cell Proliferation Assay
Cells with AAVS1 gRNA and EP300 KO were imaged using the Incucyte live cell imaging platform (Sartorius). Quantification of cell confluency from images was performed using Incucyte instrument software (version 2023A Rev2).
In Vitro Limiting Dilution Assay
In vitro sphere-forming ability was measured by culturing GSCs in serial dilutions (range of 2-1000 cells per well) on non-adherent 96-well plates. After 2-3 weeks of culture, the frequency of sphere-forming cells was quantified by inequality in frequency between multiple groups and tested for adequacy of the single-hit model using Extreme limiting dilution analysis (ELDA) software (http://bioinf.wehi.edu.au/software/elda).15
TMZ Cell Viability Assay
Glioblastoma stem cells at a density of 2000 cells/well were seeded in 96-well plates. Twenty-four hours after seeding, cells were treated with TMZ. The dose-response experiments in these cells were conducted in the range of 0-100 µM of TMZ for 7 days with 1 media change with new drug added at the mid-point. Relative cell viability was assessed using the CellTiter-Glo Luminescent Cell Viability Assay (Promega).
Flow Cytometry
Glioblastoma stem cells were harvested and washed with cold PBS. For assessment of CD44 surface expression, blocking of cells in 3% BSA/PBS (blocking buffer) was performed for 30 min on ice, followed by primary antibody (anti-CD44 Alexa Fluor 700, Invitrogen Cat no: 56044180) at 1:200, and viability dye (Fixable Viability Dye eFluor 450, Invitrogen Cat No: 65-0863-14) at 1:500, in blocking buffer for 1 h on ice in darkness. Subsequently, cells were washed 2 × with PBS and fixed in 1% PFA for 10 min followed by resuspension in PBS for flow cytometry. A CytoFlex S (Beckman Coulter) instrument was used for flow cytometry, and data were analyzed and visualized using FlowJo v10.8 Software (BD Life Sciences).
Invasion Assay
Hyaluronic acid-based Diels-Alder click-cross-linked hydrogel was prepared as described previously.16 For the invasion assay, 15 µL of hydrogel solution was plated into each well of a 384-well plate. Following gelation, hydrogels were washed extensively with PBS, NS-A basal media, and with GSC growth medium, with at least 45 min incubation between wash steps. Prior to seeding cells on hydrogels, GSCs were either transduced with LCV2 viruses (AAVS1 and EP300) or treated with DMSO and A-485. After 1 week of KO/pre-treatment, GSC lines were plated on hydrogels at a density of 3500 cells in 60 μL of media. Twenty-four hours after seeding, another 15 μL of fresh media was added to the cells. Four days after plating, cells were fixed with 4% PFA for 45 min at room temperature and counterstained with Hoechst (1:500 Invitrogen H1399) to visualize nuclei. Approximately 10 000 red fluorescent beads (1:15 Fluospheres 15 μm polystyrene beads, Thermo Fisher Scientific F8842) were then added to mark the surface of the hydrogel and allowed to settle for 10 min prior to imaging. Hydrogels were imaged using an Olympus confocal microscope (FV1000), taking images every 20 μm on the z-axis. Images were analyzed using Imaris 8.3.1 (Bitplane) software and processed using MATLAB.16
Nuclei Isolation and Cleavage under Targets and Release Using Nuclease
Cells were transduced with LCV2 EP300 or AAVS1 and selected with puromycin as above. After 1 week, cells were harvested for Cleavage under Targets and Release Using Nuclease (CUT&RUN) assay. To crosslink proteins to the genomic DNA, the final concentration of 0.1% formaldehyde was added to 500 000 cells and incubated for 1 min. Glycine with a final concentration of 125 mM was added to cells to quench the crosslink. The Cleavage under Targets and Release Using Nuclease assay was performed using the CUTANA ChIC/CUT&RUN kit (14-1048, EpiCypher). Briefly, after crosslinking, cells were spun down at 600g for 3 min and washed 2 × with the kit wash buffer. Meanwhile, concanavalin A beads (14-1048, EpiCypher) were activated using beads-activation buffer (14-1048, EpiCypher). Then, cross-linked cells were added to the antibody buffer. Antibodies were added and incubated overnight at 4 ° with rocking. Cells were then washed with permeabilization buffer, and CUTANA pAG-MNase was added to the cells. Also, 100 mM CaCl_2_ was added to activate MNase to cleave target chromatin, and cells were incubated at 4 °. After 2 h, CUTANA stop buffer was added to the extracted chromatin. The crosslink was reversed by adding 10% PFA and 20 mg/mL protease to the extracted chromatin and incubated at 55 °C overnight, and the DNA was purified. At the Donnelly Sequencing Center at the University of Toronto, libraries were prepared using NEBNext Ultra II FS DNA library prep kit for Illumina and quantified using the Qubit 1 × dsDNA high-sensitivity assay. Sizing was done using Agilent TapeStation D1000 ScreenTape, and sequencing was loaded on the NovaSeq6000 (Illumina) at 300 pMol concentration with 150 paired-end reads. H3K27Ac and p300 antibodies were as follows, respectively: H3K27Ac Monoclonal Antibody, Invitrogen (MA5-23516), p300 (D8Z4E) Rabbit mAb, and Cell Signaling (product #86377).
Mice
R26-LSL-Cas9-GFP (JAX #026175), Trp53^fl/fl^ (Trp53tm1Brn, JAX #008462), Pten^fl/fl^ (Ptentm1Hwu/J, JAX #006440), and Rb1^fl/f l^ (Rb1tm2Brn/J, JAX #026563) were animals used in this study, and they were all obtained from the Jackson Laboratories. An equal number of male and female animals were used without any bias.
Lentivirus Production for In Vivo Study
gRNAs targeting mouse Ep300 (5′-AGCAAGCTAATGGGGAAGTGAGG-3′, 5′-AGGAACTAGAAGAGAAACGAAGG-3′) were cloned into pLKO-Cre stuffer v4 plasmid (Addgene #158032) by using BsmBI restriction sites. 293T cells (Invitrogen R700-07) were seeded on 10 cm plates and transfected for 8 h using polyethyleneimine in non-serum media conditions with gRNA containing lentiviral construct, packaging plasmids psPAX2 and pPMD2. Post transfection, media was added to the plates supplemented with 10% fetal bovine serum and 1% pencillin-streptomycin antibiotic solution (w/v). Forty-eight hours after transfection, viral supernatant was filtered through a Stericup-HV PVDF 0.45-μm filter and then concentrated ∼2000-fold by ultracentrifugation in an MLS-50 rotor (Beckman Coulter). Viral titers were calculated by flow cytometry-based quantification of infected R26-LSL-tdTomato MEFs.
Intracranial Injection and In Vivo Lentiviral Transduction
Concentrated virus was mixed with 0.05% Fast Green (F7252-5G) and loaded into a syringe (Hamilton 7659-01) with a 33-gauge needle (Hamilton 7803-05). P0 pups were anesthetized on parafilm-covered ice, and their heads were secured with a custom 3D-printed mold. A stereotactic manipulator was used to position the needle 0.3 mm above the Bregma toward the Lambda Suture and 0.1 mm lateral of the Sagittal Suture into the right ventricle. The needle punctured 3 mm into the skull and retracted 1 mm for a final depth of 2 mm; 1 µL of virus was administered and allowed 1 min to diffuse before retraction of the needle. Post-injection, the neonates were warmed on a heating pad.
Quantification and Statistical Analysis
Analysis of genome-wide CRISPR-Cas9 FACS-based screen
Raw sequencing data were demultiplexed and trimmed of the adaptor sequence from FASTQ files prior to mapping of sequencing reads to the TKOv3 library using the MAGeCK algorithm17 count function. Gene KOs positively selected in the CD44 low population bin over the CD44 high population bin were identified using the test function in MAGeCK (FDR < 0.2).
Analysis of CUT&RUN
We used the modified pipeline developed by the Henikoff Lab18 to align the Fastq files into hg38 genome and process them into Sam, Bam, bigwig, and bedgraph files. For peakCalling, we used SEACR (Sparse Enrichment Analysis for CUT&RUN) with cut off 0.01 for H3K27Ac peak calls and 0.001 for p300-binding sites calls. Homer software (annotatePeak.pl) was used to annotate peaks for H3K27Ac and P300.19 Enhancers were identified using the ROSE algorithm.20 Enhancer regions in each sample were tested against all samples to identify the significantly enriched motifs.19 P300-bound regions were also tested with Homer software (findMotifsGenome.pl) to find the enrichment of transcription factor (TF)-binding motifs.19
To identify IR motifs in ATAC-seq, we generated a consensus file for IR GSCs peaks, and also 1 master consensus peak file containing both IR and Dev GSCs open regions, then we tested the IR consensus peak regions against the master peak file.7
Statistical analysis
The details related to the statistical analysis for each experiment can be found in figure legends. The Graphpad Prism 5 (GraphPad Software, La Jolla, California, United States) was used for statistical analysis, unless specified otherwise. All statistical tests were two-sided unless specified otherwise. Statistical analysis for flow cytometry and invasion assay was performed using unpaired, two-sample t-tests from n = 3 replicates. Statistical analysis of qPCR data was performed using GraphPad Prism, and two-way ANOVA test was used to calculate significance. Values were obtained from at least 2 biological replicates for each sample, and hcyclo was used for normalization. Sphere-forming capacity in limiting dilution assay is plotted as 95% CIs for 1/stem cell frequency. To assess the differences in stem cell frequencies between various groups, Pairwise chi-square tests were used.
Results
Genome-Wide CRISPR-Cas9 Phenotypic Screen Identifies Regulators of the Injury Response GSC State
Previous work has identified CD44 as a marker of the IR/Mes state in GBM, with higher expression in IR GSCs when compared to Dev GSCs (Figure 1A).6 Elevated expression of CD44 on the surface of IR GSCs compared to Dev GSCs was confirmed via flow cytometry in a panel of patient-derived GSC cultures (Figure 1B and C). To identify genes required for maintenance of the IR state in GSCs, we performed a FACS-based genome-wide CRISPR-Cas9 KO phenotypic screen using CD44 cell surface expression as a fiducial marker of the IR state. To this end, we transduced a patient-derived IR GSC culture (G549) with the TKOv3 genome-wide human gRNA library21 to generate a pool of KO cells and isolated cells with high (top 15%) and low CD44 (bottom 15%) expression using FACS (Figure 1D; Figure S1A). The gating strategy was designed such that the CD44 level in the “low” population would be less than the median level for all IR cultures tested, and to allow for sufficient cells to be captured following FACS in order for quantification to be statistically reliable (Figure 1B). A comparison of gRNA abundances using the MAGeCK algorithm in CD44-low and CD44-high GSC populations identified genes whose KO decreased CD44 expression levels. As expected, CD44 was identified as the top hit enriched in the CD44-low bin (Table S1). Predictably, as CD44 is a transmembrane glycoprotein, our screen identified several genes with known functions in macromolecular/protein glycosylation (GALNT1, GALNT6) as well as EMP3, which has previously been shown to regulate CD44 levels at the cell surface (Figure 1E and F).22 In addition, we identified JUN and FOSL1, which have previously been reported as regulators of the mesenchymal signatures in GBM (Figure 1E).23 Notably, several additional TFs, such as SRF and KLF6, and chromatin remodeling genes, including EP300 and SETD1B, were also enriched in the CD44-low population, suggesting their requirement in sustaining transcriptional programs defining the IR state.
*CRISPR-Cas9 phenotypic screen identifies genes required to maintain the IR GSCs state. (A) CD44 mRNA expression in Injury Response (IR) (n=29) vs Developmental (Dev) (n = 42) patient-derived GSC cultures. ***P< .0001. (B) Flow cytometry analysis of CD44 cell surface expression in a panel of patient-derived IR and Dev GSC cultures (N = 2). Median Fluorescence Intensity (MFI). Dashed lines indicated the top/bottom 15% of CD44 levels for G549. HEK293 cells were used as negative control (NC). (C) Quantification of CD44 expressed as median fluorescent intensity (MFI) in IR and Dev GSCs (N = 2) from panel (B). (D) Schematic of genome-wide phenotypic CRISPR screens for identification of genes required to maintain the IR GSCs state. Created in BioRender. Macleod, G. (2026) https://BioRender.com/vwpxycy. (E) Volcano plot of genes enriched in CD44 “low” population compared to CD44 “high” population. P-values from genome-wide CRISPR screen calculated by the MAGeCK algorithm. Selected hits, including previously identified regulators of IR/Mes state (JUN, FOSL1), CD44 glycosylation/trafficking (GALNT6, GALNT6, EMP3), and chromatin remodeling (EP300, SRF, SETD1) are highlighted. (F) Selected Gene Ontology (GO) for hits enriched in CD44 “low” population compared to CD44 “high” population (FDR less than 0.2). GSCs, glioblastoma stem cells.
Loss of EP300 Compromises Self-Renewal and Tumor Initiation of IR GSCs
Transition between cell states requires epigenetic reprogramming driven by alterations in chromatin accessibility, a process in which histone acetylation plays an important role.24 EP300 is a bromodomain histone acetyltransferase, which, along with cyclic AMP response element-binding protein (CREB), is responsible for histone H3 lysine 27 acetylation (H3K27Ac) at super-enhancer and promoter regions and is a mark associated with active gene transcription.25 EP300 function affects the expression of genes crucial for cell cycle regulation, apoptosis, and DNA repair, thereby shaping the cancer cell phenotype.26 Additionally, EP300 interacts with various TFs and acts as a transcriptional coactivator.27 At the mRNA level, the EP300 expression is not significantly different between IR and Dev GSCs (Figure 2A). This suggests our screen identified potential regulators of IR state that would not be obvious from expression studies alone.
*EP300 is required for self-renewal of IR GSCs and tumor initiation and/or progression in vivo. (A) EP300 mRNA expression in Injury Response (IR) (n = 29) vs Developmental (Dev) (n = 42) patient-derived GSC cultures. (B) Representative flow cytometry experiments (3 independent experiments) measuring CD44 cell surface expression in IR GSC (G549) transduced with gRNA targeting AAVS1 (control) or EP300 (2 gRNAs). (C) Representative flow cytometry experiment (3 independent experiments) measuring CD44 surface expression following treatment of IR GSCs (G549) for 7 days with DMSO or A-485. (D) Bar graph representing the quantification of CD44 cell surface expression (expressed as median fluorescent intensity relative to the control) in panel (B) (n = 3). Error bars: mean ± SEM, **P < .01, ***P < .001. (E) Quantification of IR GSC (G549) proliferation following treatment with control (DMSO) or with 400nM EP300 inhibitor (A-485) (n = 3) using the Incucyte Live Cell Imaging system. Error bars: mean ± SEM. (F) Quantification of IR GSC (G549) proliferation following control (AAVS1 gRNA) or EP300 knockout (EP300_KO) (n = 3). Error bars: mean ± SEM. (G) In vitro limiting dilution assay (LDA) of GSCs culture. Representative Sphere-forming Capacity (SFC) of the indicated GSC cultures expressing gRNA targeting AAVS1 (control) or EP300. Error bars: estimated frequency +95% CI, **P < .01, ***P < .0001. (H) Schematic illustrating the GBM mouse model (Created with BioRender.com). Mice carrying LSL-Cas9-GFP and triple floxed Tp53, Pten, and Rb1 alleles were intracranially injected with lentivirus carrying Cre-recombinase and gRNAs targeting either control or Ep300. Created in BioRender. Macleod, G. (2026) https://BioRender.com/mz0tn87. (I) Kaplan-Meier curve for Tp53/Pten/Rb1 triple knockout GBM mouse model in tumors expressing the indicated gRNAs. Indicated P-value was calculated using the log-rank (Mantel-Cox) test. GBM, glioblastoma; GSCs, glioblastoma stem cells.
Knockout of EP300 using 2 different gRNAs in 2 IR GSCs (G549 and G411) resulted in decreased CD44 surface expression when compared to control (Figure 2B-D; Figure S2A and C). Treatment with A-485, a selective inhibitor of EP300 histone acetyltransferase activity, showed decreased levels of CD44 in 2 IR GSCs (G549 and G411) when compared to cells treated with DMSO (Figure 2C and D, Figure S2B and C).28 Collectively, these findings verify our screen results and confirm that EP300 regulates surface expression of CD44 in IR GSCs.
Next, we assessed the effect of EP300 perturbations on the proliferation of IR GSCs. We observed that the proliferation rate of IR GSCs was not significantly affected by EP300 KO or chemical inhibition when compared to controls (Figure 2E and F; Figure S2D and E). This is consistent with previous CRISPR fitness screens performed by our lab, where EP300 was not identified as a genetic vulnerability in IR GSCs (Figure S2F).9 One of the features of the CD44 phenotypic screen was the ability to identify regulators of cell state whose KO may not affect cell growth or survival but that affect other phenotypes related to the IR state. Importantly, we observed that the sphere-forming capacity (a surrogate for self-renewal capacity) of IR GSCs decreased upon EP300 KO (Figure 2G; Figure S2G). This finding suggests EP300 is a regulator of self-renewal in IR GSCs as opposed to proliferation. Increased resistance to chemotherapy is a feature often associated with Mesenchymal/IR GSCs; therefore, we evaluated the effect of EP300 KO on TMZ sensitivity. We observed that EP300 KO did not change the sensitivity of IR GSCs to TMZ (Figure S2H). This aligns with our previous findings where EP300 was not among the genes identified to modulate GSC sensitivity to the TMZ treatment and suggests that other factors likely play a stronger role in modulating response to this chemotherapeutic agent.9
To investigate the role of EP300 in GBM tumor initiation and progression, we tested the requirement of Ep300 in a mouse model of GBM consisting of disruption of 3 common GBM tumor suppressor genes Tp53, Pten, and Rb1.29 Mice carrying floxed alleles of Tp53 (Tp53^fl/fl^), Pten (Pten^fl/fl^), and Rb1 (Rb1^fl/fl^) as well as LSL-Cas9-GFP were subjected to stereotactic injection at P0 to deliver lentiviral particles expressing Cre and either Ep300-targeting or control gRNAs and transduce the mouse neural stem cells residing in the lateral subventricular zone (Figure 2H). Kaplan-Mayer survival analysis showed that genetic ablation of Ep300, using 2 independent gRNAs, significantly prolonged the survival of mice when compared to control gRNA-injected animals (Figure 2I; Figure S3), indicating a role for Ep300 in promoting tumor progression.
EP300 is Required to Maintain the Invasive Behavior of IR GSCs
One of the main features of invasive/IR GSCs is the ability to invade surrounding tissues and contribute to the aggressiveness of tumors.7 To investigate the requirement of EP300 for the invasive behavior of IR GSCs, we used a recently developed hyaluronic acid-based GBM tumor-mimetic hydrogel that includes extracellular matrix components upregulated in patients to perform invasion assays16 (Figure 3A). EP300 KO decreased both the depth of invasion and percentage of invasive cells in 2 independent IR GSC cultures (G411 and G549) (Figure 3B-E). Supporting these results, inhibition of EP300 using A-485 also significantly decreased both the percentage and depth of invasion (Figure 3B-E). We conclude that EP300 regulates the invasive phenotype of IR GSCs.
*EP300 is required for invasiveness of IR GSCs. (A) Schematic of the invasion assay. GSCs were seeded on top of the hydrogel and allowed to invade for 4 days. Subsequently, cells were fixed and the surface of the gel was marked using beads for further analysis. Created in BioRender. Macleod, G. (2026) https://BioRender.com/iy1a6oo. (B) Representative compressed z-stack confocal images of G411 IR GSCs seeded and invading the hydrogel (Cells are labeled in blue and beads are in red). Cells are either control, knockout for EP300 or pre-treated with the EP300 inhibitor A-485 for 7 days at 400 nM. (C) Depth of invasion and percentage of invading cells upon EP300 KO or chemical inhibition of EP300 (pre-treatment with A-485 for 7 days at 400 nM) in G411 IR GSCs decreased significantly when compared to control (n = 3, Error bars: mean ± SEM, Unpaired T-test, *P < .05, **P < .01). (D) Representative compressed z-stack confocal images of G549 IR GSCs seeded and invading the hydrogel (cells are labeled in blue and beads are in red). Cells are either control, knockout for EP300 or pre-treated with the EP300 inhibitor A-485 for 7 days at 400 nM. (E) Depth of invasion and percentage of invading cells upon EP300 KO or chemical inhibition of EP300 (pre-treatment with A-485 for 7 days at 400 nM) in G549 IR GSCs decreased significantly when compared to control (n = 3, error bars: mean ± SEM, unpaired T-test, *P < .05, *P < .01). EP300 KO, EP300 knockout; GSCs, glioblastoma stem cells; IR, Injury Response.
EP300 Activity is Required to Maintain the IR Transcriptional Signature
Glioblastoma stem cells in the IR state are characterized by high expression of mesenchymal cell-related genes and pathways associated with immune response, inflammation, wound healing, extracellular matrix, and cell adhesion.6 Since we observed that EP300 perturbations reduce several key phenotypes associated with IR GSCs (CD44 expression, self-renewal, tumor initiation, and invasion), we next investigated the requirement of EP300 to maintain the transcriptional signature of IR GSCs. RNA-seq and differential expression analysis revealed significant downregulation of multiple genes associated with the IR state, including ITGAX, CD44, SERPINE1, and SERPINA1 in EP300 KO samples when compared to control cells (Figure 4A). Independent validation by qPCR confirmed regulation of several of these genes by EP300 (Figure S4A). Gene Ontology enrichment analysis of downregulated genes revealed overrepresentation of pathways associated with the IR state, including extracellular matrix (ECM), wound healing, and inflammation response (Figure 4B-D), while differentially upregulated genes were enriched for cellular and tissue development pathways (Figure S4B). Among upregulated genes, there was no evidence of upregulation of PN/Dev signatures that would suggest a state transition in this trajectory. A previous study that performed RNA-seq on a Proneural patient-derived GBM cell line following EP300 knockdown observed downregulation of a number of DNA repair genes.30 This was not observed in our IR GSC line, consistent with a lack of sensitization to TMZ (Figure S2H), and may suggest differences in roles for EP300 between cell states.
EP300 is required to maintain IR response gene signature in GSCs. (A) Volcano plot depicting differentially expressed genes in G549 IR GSCs knockout for EP300 vs control (AAVS1 gRNA), N = 4. (B) Selected Gene Ontology (GO) biological process differentially downregulated in IR GSCs knockout for EP300 (n = 4). (C) Heatmap comparing average expression of genes associated with the Extracellular Matrix GO term (GO:0031012) in control or EP300 knockout IR GSCs. (D) Heatmap of average expression of genes in Inflammatory Response GO term (GO:0006954) in EP300 KO samples vs control (AAVS1 targeting gRNA). (E) Representative plots of gene set enrichment in differentially expressed genes comparing EP300 KO samples vs control (AAVS1-targeting gRNA). GSCs, glioblastoma stem cells; IR, Injury Response.
Gene set enrichment analysis on RNA-seq results evidenced the downregulation of IR GSC, Mesenchymal GBM, and Hallmark Epithelial-to-Mesenchymal (EMT) signatures (including ITGA2, ITGB3, COL6A3, and CXCL8) upon EP300 KO (FDR < 0.05) (Figure 4E; Figure S3C).31 Furthermore, we observed significant loss of inflammation pathways (SCHMITT, TNF, and HMG) that are required to induce PN to Mes transition and to induce the Mes signature in GBM cells (Figure S4C).32 Together, our results suggest that EP300 is required to maintain the IR transcriptional program.
To further investigate the role of EP300 in IR GSCs, we performed chromatin profiling CUT&RUN experiments using an H3K27Ac antibody to compare EP300 KO and control (AAVS1 gRNA) IR GSCs. As expected, given the HAT function of EP300, we observed a global reduction of H3K27Ac signal upon EP300 KO (Figure S5A). In EP300 KO cells, a clear reduction of H3K27Ac signal around the transcription start site (TSS) was observed for genes whose expression was downregulated upon EP300 KO (Figure 5A). Our results therefore confirm that EP300 regulates transcriptional programs in IR GSCs via the H3K27Ac epigenetic modification. Next, to test whether EP300 modulates the IR state through a direct or indirect mechanism, we performed CUT&RUN in IR GSCs using an EP300 antibody and identified 2800 regions occupied by EP300 (SEACR peakCalling using a 0.001 q-value cutoff) (Figure 5B). Importantly, we observed a strong H3K27Ac signal reduction around EP300 binding sites in EP300 KO GSCs suggestive of direct epigenetic regulation at these loci (Figure 5C). Importantly, this includes several IR signature genes found to be regulated by EP300 in our RNA-seq experiment (eg, CD44, CXCR4, and SERPINE1) (Figure 5D). We conclude that EP300 is directly involved in the epigenetic regulation of the IR transcriptional state.
Regulation of H3K27Ac by EP300 modulates the IR signature. (A) Heatmap of H3K27Ac CUT&RUN signal in control (AAVS1-targeting gRNA) and EP300 KO IR GSCs (G549) around regions of genes found to be transcriptionally down-regulated upon EP300 KO. (B) Doughnut plot displaying genomic distribution of EP300-binding sites. (C) Heatmap of H3K27Ac CUT&RUN signal in control (AAVS1-targeting gRNA) and EP300 KO IR GSCs (G549) around EP300 bound regions. (D) Representative genome browser image at the SERPINE1 locus displaying H3K27Ac signal in control (AAVS1-targeting gRNA) (Blue) and EP300 KO (Red) IR GSCs (G549), or EP300 binding signal (green) in WT IR GSCs (G549) from CUT&RUN experiments. (E) Dot plot displaying TF motifs significantly enriched in EP300 binding sites. (F) Dot plot displaying TF motifs significantly enriched in IR-GSC and Dev-GSC open chromatin regions identified by ATAC-seq.7
Analysis of EP300-bound regions revealed enrichment of JUN-AP1, FRA-1, and FRA-2 family binding motifs (Figure 5E). These TF families have previously been shown to drive expression of the mesenchymal GBM signature and are consistent with our screen results, revealing members of the JUN and FOS families as IR state regulators.23^,^33 We further assessed the motifs enriched within IR GSC enhancer regions using our H3K27Ac CUT&RUN dataset and identified significant enrichment of JUN and FOS family binding motifs in control samples, a signal that was lost in EP300 KO cells (Figure S5B). To validate our findings and emphasize the importance of these EP300-regulated TF-binding regions in modulating the IR phenotype across a larger set of GSCs, we analyzed previously published ATAC-seq data and identified open chromatin regions that were enriched in IR (19 independent patient cultures) and Dev (7 independent patient cultures) GSCs.7 We observed that the motifs enriched in EP300-bound regions (JUN and FOS family) overlapped with motifs enriched in the IR GSC open chromatin regions but not Dev GSC open chromatin regions (Figure 5F). We conclude that EP300 modulates the IR GSC phenotype through regulation of H3K27Ac levels and IR-specific genes transcriptional programs in cooperation with TFs that are required to maintain the state.
Discussion
Given the heterogeneity and plasticity of GBM tumors, we now understand why targeted single-agent therapies have failed to have a significant clinical impact. Further studies that elucidate how cellular heterogeneity is established and maintained in GSCs, and better characterization of the plasticity between cellular states, are needed to identify new therapeutic targets or alternative strategies that could more effectively harness the malignant cells that survive front-line therapy.
Within the Dev-IR axis in GSCs, considerable heterogeneity exists at genetic, epigenetic, transcriptional, and functional levels.6 Dev GSCs are able to convert into the IR state through different means; however, the mechanisms underlying maintenance of the IR state and IR-to-Dev transition are not fully understood. The CRISPR-Cas9 phenotypic screen presented in this study was designed to identify regulators of the IR state based on a well-established cell surface marker, CD44. Among the identified candidate IR state regulators were FOSL1 and JUN, which were previously shown to maintain the mesenchymal gene expression signature in GBM tumors. Interestingly, the screen identified the HAT and transcriptional coactivator EP300 as required for CD44 surface expression, raising the hypothesis that it is essential to maintain the IR state in GSCs. Epigenetic regulation and chromatin remodeler genes play a critical role in cell state transitions as well as the maintenance of cell states.34 In GBM, EP300 is required for radiation-induced state transition, contributing to a more aggressive and therapy-resistant phenotype.35 In the present study, we showed that EP300 KO leads to loss of the IR gene signature as well as loss of H3K27Ac signals around the genes downregulated upon EP300 KO, which reinforces the importance of EP300 in directly governing the IR state. Binding motifs for TFs (JUN/FOS) known to drive IR/Mes signatures were significantly enriched at EP300-binding sites. Furthermore, these same motifs were enriched at active enhancers in IR GSCs, a signal that was lost upon EP300 KO. Our finding shows that EP300 is needed to maintain the transcriptional network of IR-related genes through 2 processes: (1) Interaction with TF facilitating their binding to the DNA to activate the IR program and (2) through maintaining H3K27Ac within enhancer regions of IR-related genes.
Mesenchymal cells typically express genes related to EMT, a process associated with tumor progression and invasion.36 EP300 was previously linked to EMT in several cancers and contributes to tumor progression. In triple-negative breast cancer, EP300 regulates the cancer stem cell phenotype and contributes to the tumor-invasive phenotype.37 In hepatocellular carcinoma, EP300 induces EMT and invasion of tumor cells through activation of Elk1-aPKC-ι signaling.38 Furthermore, EP300 induces invasion, migration, and EMT in oral squamous cell carcinoma through activation of a TGF-βRII/EP300/Smad4 cascade.39 In another study that demonstrated Smad3/TGF-β1-mediated regulation of a mesenchymal GSC signature, EP300 was found to interact with Smad3 in mesenchymal but not Proneural GSCs.40 Moreover, it was shown that inhibition of EP300 in these cells reduces self-renewal.40 In immortalized GBM cell lines, knockdown of EP300 was shown to increase invasion, a finding that contrasts with our study, albeit in a different cellular context.41 In this study, we directly demonstrate the importance of EP300 function in maintaining the IR gene signatures and validate that this signature includes genes important for EMT. Interestingly, the loss of the IR signature upon EP300 perturbation was not accompanied by an upregulation of the Dev signature. A deeper characterization of the cellular state resulting from EP300 KO will be the focus of future studies.
Importantly, our study showed that KO of Ep300 in a mouse GBM model delayed the development of tumors, suggesting that EP300 plays a critical role in tumor initiation and/or progression. These results provide a mechanistic basis for testing the efficacy of existing EP300 inhibitors in human studies, with the notion that EP300 activity may be especially important in the context of GBM tumors dominantly expressing a mesenchymal signature.
In this study, we focused on identifying genes important for the IR state with the hypothesis that strategies directed to drive GSCs out of this aggressive state would interfere with tumor progression. Our findings show that the epigenetic regulator EP300 governs the expression of several genes differentially expressed between the IR and Dev subtypes nominating EP300 as a master regulator of the IR state. The results showing that inhibition of EP300 function interfered with GSC IR phenotypes (invasion and sphere-forming capacity, a proxy for self-renewal) without perturbing cell proliferation, suggest that targeting cell state may be a viable therapeutic opportunity beyond focusing on genes important for growth. While Dev GSCs are also highly tumorigenic and can give rise to IR/Mes cells, inhibiting EP300 activity may constrain plasticity to an extent that improves outcomes even in Dev/PN high tumors. Importantly, EP300 inhibitors such as Pocenbrodib (NCT06785636), Inobrodib42 (NCT04068597, NCT03568656), EP31670 (NCT05488548), and OPN-6602 (NCT06433947)43^,^44 are all in various stages of clinical trials for cancer treatment and, given these results, should be considered for testing their efficacy in GBM.
Supplementary Material
vdag002_Supplementary_Data
The reference list from the paper itself. Each links out to its DOI / PubMed record.
- 1Wang Q , Hu B, Hu X, et al. Tumor evolution of glioma-intrinsic gene expression subtypes associates with immunological changes in the microenvironment. Cancer Cell. 2017;32:42-56.e 6. 10.1016/j.ccell.2017.06.00328697342 PMC 5599156 · doi ↗ · pubmed ↗
- 2Neftel C , Laffy J, Filbin MG, et al. An integrative model of cellular states, plasticity, and genetics for glioblastoma. Cell. 2019;178:835-849.e 21. 10.1016/j.cell.2019.06.02431327527 PMC 6703186 · doi ↗ · pubmed ↗
- 3Lan X , Jörg DJ, Cavalli FMG, et al. Fate mapping of human glioblastoma reveals an invariant stem cell hierarchy. Nature. 2017;549:227-232. 10.1038/nature 2366628854171 PMC 5608080 · doi ↗ · pubmed ↗
- 4Singh SK , Hawkins C, Clarke ID, et al. Identification of human brain tumour initiating cells. Nature. 2004;432:396-401. 10.1038/nature 0312815549107 · doi ↗ · pubmed ↗
- 5Dirkse A , Golebiewska A, Buder T, et al. Stem cell-associated heterogeneity in glioblastoma results from intrinsic tumor plasticity shaped by the microenvironment. Nat Commun. 2019;10:1787-1716. 10.1038/s 41467-019-09853-z 30992437 PMC 6467886 · doi ↗ · pubmed ↗
- 6Richards LM , Whitley OKN, Mac Leod G, et al. Gradient of developmental and injury response transcriptional states defines functional vulnerabilities underpinning glioblastoma heterogeneity. Nat Cancer. 2021;2:157-173. 10.1038/s 43018-020-00154-935122077 · doi ↗ · pubmed ↗
- 7Guilhamon P , Chesnelong C, Kushida MM, et al. Single-cell chromatin accessibility profiling of glioblastoma identifies an invasive cancer stem cell population associated with lower survival. Elife. 2021;10:e 64090. 10.7554/e Life.64090 · doi ↗
- 8Pollard SM , Yoshikawa K, Clarke ID, et al. Glioma stem cell lines expanded in adherent culture have tumor-specific phenotypes and are suitable for chemical and genetic screens. Cell Stem Cell. 2009;4:568-580. 10.1016/j.stem.2009.03.01419497285 · doi ↗ · pubmed ↗