Association between the C-reactive protein to albumin ratio and unplanned readmission in ulcerative colitis: insights from a cohort study
Junyi Zhan, Tianqi Wang, Xiaobin Zhao, Jiaqi Zhu, Shiyu Ji, Yujie Zhao, Dongli Wang

TL;DR
This study found that higher C-reactive protein to albumin ratio (CAR) is linked to more unplanned hospital readmissions in ulcerative colitis patients, suggesting CAR could help predict readmission risk.
Contribution
The study introduces CAR as a novel predictive biomarker for unplanned readmissions in ulcerative colitis patients.
Findings
Each 1-unit increase in CAR was associated with a 126.9% higher risk of unplanned readmission.
CAR showed good predictive performance across multiple follow-up periods with AUC values above 0.77.
A non-linear relationship and threshold effect were identified between CAR and readmission risk.
Abstract
This study aimed to investigate the association between the C-reactive protein to albumin ratio (CAR) and unplanned readmissions in patients with ulcerative colitis (UC) and to evaluate its potential value as a predictive indicator. This study included 412 patients with UC who were hospitalized at the Affiliated Hospital of Shandong University of Traditional Chinese Medicine between June 2017 and June 2024. Cox proportional hazards models were used to evaluate the relationship between CAR, C-reactive protein (CRP), albumin (ALB), and unplanned readmission in patients with UC. Kaplan-Meier survival curves were plotted to analyze the differences in unplanned readmission rates across different value ranges. Restricted Cubic Splines (RCS) were employed to explore the dose-response relationship between these three variables and unplanned readmissions. Additionally, a subgroup analysis was…
Genes, proteins, chemicals, diseases, species, mutations and cell lines named across the full text — each resolved to its canonical identifier and authoritative record.
Click any figure to enlarge with its caption.
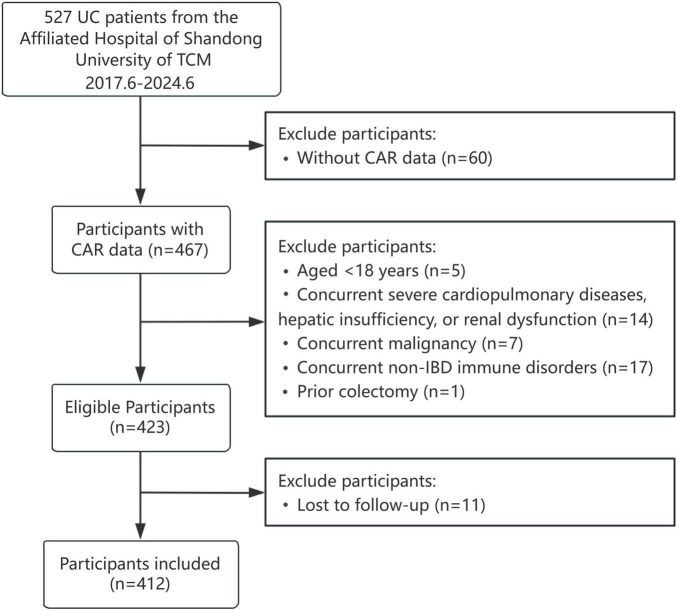 FIGURE 1
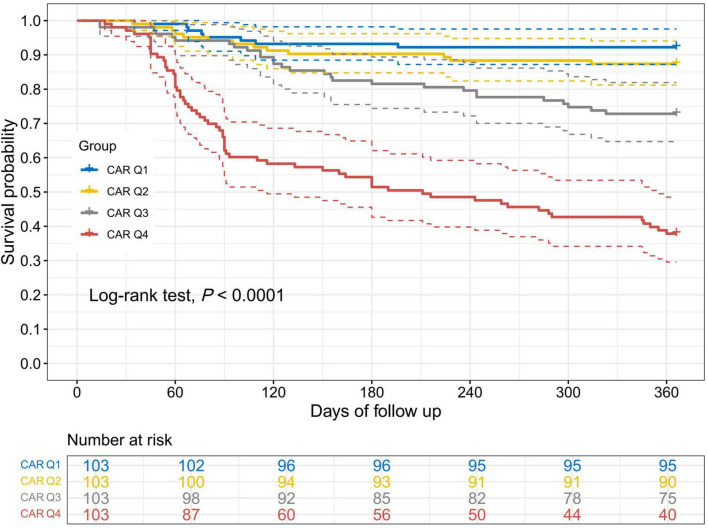 FIGURE 2
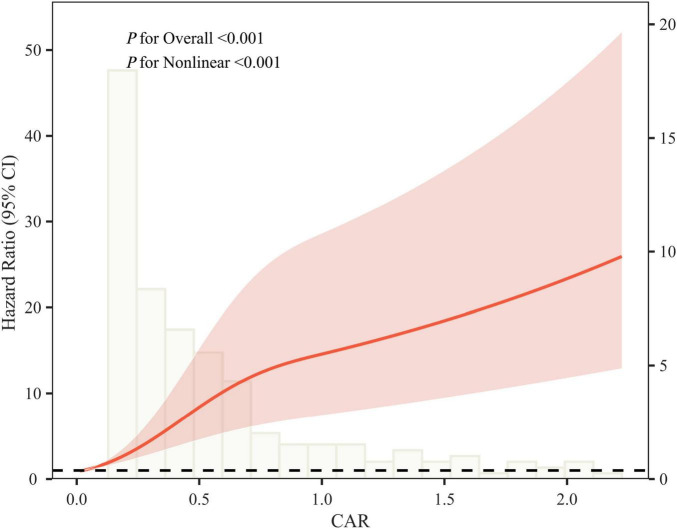 FIGURE 3
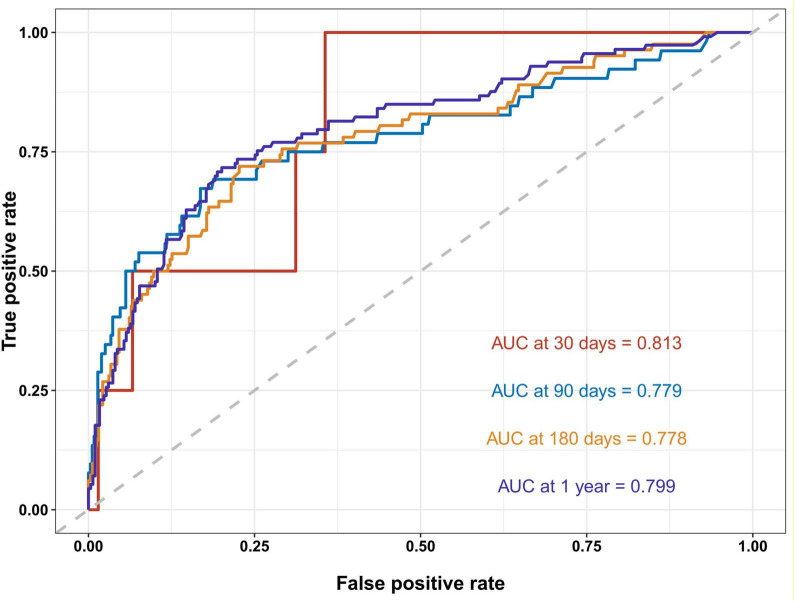 FIGURE 4
| Characteristics | CAR | ||||
|---|---|---|---|---|---|
| <0.063 | 0.063–0.157 | 0.157–0.459 | >0.459 | ||
| Age (yr) | 47.53 ± 13.32 | 45.18 ± 14.47 | 49.42 ± 14.72 | 44.23 ± 12.07 | 0.003 |
| Sex, | 0.879 | ||||
| Female | 60 (58.25) | 60 (58.25) | 62 (60.19) | 65 (63.11) | |
| Male | 43 (41.75) | 43 (41.75) | 41 (39.81) | 38 (36.89) | |
| Alcohol, | 0.994 | ||||
| No | 93 (90.29) | 94 (91.26) | 93 (90.29) | 93 (90.29) | |
| Yes | 10 (9.71) | 9 (8.74) | 10 (9.71) | 10 (9.71) | |
| Hypertension, | 0.01 | ||||
| No | 92 (89.32) | 98 (95.15) | 87 (84.47) | 99 (96.12) | |
| Yes | 11 (10.68) | 5 (4.85) | 16 (15.53) | 4 (3.88) | |
| Smoke, | 0.481 | ||||
| No | 95 (92.23) | 88 (85.44) | 92 (89.32) | 92 (89.32) | |
| Yes | 8 (7.77) | 15 (14.56) | 11 (10.68) | 11 (10.68) | |
| Diabetes, | 0.49 | ||||
| No | 100 (97.09) | 101 (98.06) | 99 (96.12) | 97 (94.17) | |
| Yes | 3 (2.91) | 2 (1.94) | 4 (3.88) | 6 (5.83) | |
| Heart disease, | 0.303 | ||||
| No | 97 (94.17) | 98 (95.15) | 99 (96.12) | 102 (99.03) | |
| Yes | 6 (5.83) | 5 (4.85) | 4 (3.88) | 1 (0.97) | |
| Clinical typing, | 0.875 | ||||
| new-onset | 14 (13.59) | 13 (12.62) | 17 (16.50) | 15 (14.56) | |
| Recurrent type | 89 (86.41) | 90 (87.38) | 86 (83.50) | 88 (85.44) | |
| Colonoscopy examination, | 0.034 | ||||
| Relief period | 9 (8.74) | 7 (6.80) | 6 (5.83) | 0 (0.00) | |
| Active phase | 94 (91.26) | 96 (93.20) | 97 (94.17) | 103 (100.00) | |
| Increased defecation, | <0.001 | ||||
| Normal | 32 (31.07) | 24 (23.30) | 16 (15.53) | 10 (9.71) | |
| Mild | 29 (28.16) | 28 (27.18) | 36 (34.95) | 13 (12.62) | |
| Moderate | 33 (32.04) | 27 (26.21) | 26 (25.24) | 27 (26.21) | |
| Severe | 9 (8.74) | 24 (23.30) | 25 (24.27) | 53 (51.46) | |
| Hematochezia condition, | 0.349 | ||||
| Normal | 13 (12.62) | 14 (13.59) | 17 (16.50) | 11 (10.68) | |
| Mild | 36 (34.95) | 35 (33.98) | 30 (29.13) | 24 (23.30) | |
| Moderate | 47 (45.63) | 45 (43.69) | 42 (40.78) | 52 (50.49) | |
| Severe | 7 (6.80) | 9 (8.74) | 14 (13.59) | 16 (15.53) | |
| Use of 5-ASA, | 0.092 | ||||
| No | 20 (19.42) | 24 (23.30) | 25 (24.27) | 12 (11.65) | |
| Yes | 83 (80.58) | 79 (76.70) | 78 (75.73) | 91 (88.35) | |
| Use of immunosuppressive agents, | 0.457 | ||||
| No | 100 (97.09) | 97 (94.17) | 101 (98.06) | 98 (95.15) | |
| Yes | 3 (2.91) | 6 (5.83) | 2 (1.94) | 5 (4.85) | |
| Use of probiotics, | 0.019 | ||||
| No | 61 (59.22) | 66 (64.08) | 61 (59.22) | 45 (43.69) | |
| Yes | 42 (40.78) | 37 (35.92) | 42 (40.78) | 58 (56.31) | |
| Use of GCS, | <0.001 | ||||
| No | 94 (91.26) | 88 (85.44) | 79 (76.70) | 63 (61.17) | |
| Yes | 9 (8.74) | 15 (14.56) | 24 (23.30) | 40 (38.83) | |
| Mucosal biopsy, | <0.001 | ||||
| Normal | 6 (5.83) | 1 (0.97) | 0 (0.00) | 0 (0.00) | |
| Mild | 35 (33.98) | 28 (27.18) | 33 (32.04) | 14 (13.59) | |
| Moderate | 51 (49.51) | 56 (54.37) | 49 (47.57) | 50 (48.54) | |
| Severe | 11 (10.68) | 18 (17.48) | 21 (20.39) | 39 (37.86) | |
| Extent of disease, | 0.1 | ||||
| E1 | 36 (34.95) | 32 (31.07) | 32 (31.07) | 20 (19.42) | |
| E2 | 32 (31.07) | 37 (35.92) | 38 (36.89) | 33 (32.04) | |
| E3 | 35 (33.98) | 34 (33.01) | 33 (32.04) | 50 (48.54) | |
| Use of biologics, | 0.879 | ||||
| No | 100 (97.09) | 99 (96.12) | 98 (95.15) | 98 (95.15) | |
| Yes | 3 (2.91) | 4 (3.88) | 5 (4.85) | 5 (4.85) | |
| Platelet count (×109/L) | 251.00 (91.00) | 248.00 (115.00) | 269.00 (119.00) | 316.00 (166.00) | <0.001 |
| Hemoglobin (g/L) | 129.00 (22.00) | 128.00 (28.00) | 134.00 (29.00) | 118.00 (36.00) | <0.001 |
| White blood cell count (×109/L) | 5.57 (2.30) | 5.51 (2.54) | 6.62 (2.76) | 7.45 (4.66) | <0.001 |
| Alanine aminotransferase (U/L) | 14.00 (9.00) | 14.00 (9.00) | 14.00 (13.00) | 12.00 (15.00) | 0.592 |
| Aspartate aminotransferase (U/L) | 17.00 (7.00) | 17.00 (8.00) | 18.00 (8.00) | 15.00 (8.00) | <0.001 |
| Total bilirubin (μmoI/L) | 12.40 (6.10) | 10.90 (6.50) | 10.70 (6.40) | 9.70 (4.00) | <0.001 |
| C-reactive protein (mg/L) | 1.30 (1.00) | 3.60 (1.50) | 9.90 (7.20) | 31.20 (27.30) | <0.001 |
| Albumin (g/L) | 40.83 ± 3.99 | 38.47 ± 5.02 | 39.70 ± 5.02 | 35.68 ± 6.24 | <0.001 |
| C-reactive protein to albumin ratio | 0.03 (0.03) | 0.10 (0.05) | 0.26 (0.16) | 0.85 (0.84) | <0.001 |
| Readmission, | <0.001 | ||||
| No | 95 (92.23) | 90 (87.38) | 75 (72.82) | 39 (37.86) | |
| Yes | 8 (7.77) | 13 (12.62) | 28 (27.18) | 64 (62.14) | |
| Variables | Model 1 | Model 2 | Model 3 | ||||
|---|---|---|---|---|---|---|---|
| HR(95%CI) | HR(95%CI) | HR(95%CI) | |||||
| CAR | CAR | 2.24 (1.94, 2.60) | <0.001 | 2.27 (1.94, 2.64) | <0.001 | 2.27 (1.88, 2.75) | <0.001 |
| CAR (Quartile) | |||||||
| Q1 | Reference | Reference | Reference | ||||
| Q2 | 1.66 (0.69, 4.02) | 0.257 | 1.68 (0.69, 4.04) | 0.251 | 1.32 (0.53, 3.24) | 0.552 | |
| Q3 | 3.79 (1.73, 8.31) | 0.001 | 3.77 (1.72, 8.28) | 0.001 | 3.14 (1.40, 7.04) | 0.005 | |
| Q4 | 11.86 (5.68, 24.77) | <0.001 | 12.02 (5.74, 25.17) | <0.001 | 11.38 (5.21, 24.88) | <0.001 | |
| <0.001 | <0.001 | <0.001 | |||||
| CRP | CRP | 1.03 (1.02, 1.03) | <0.001 | 1.03 (1.02, 1.03) | <0.001 | 1.03 (1.02, 1.03) | <0.001 |
| CRP (Quartile) | |||||||
| Q1 | Reference | Reference | Reference | ||||
| Q2 | 1.21 (0.52, 2.80) | 0.656 | 1.22 (0.53, 2.82) | 0.648 | 1.08 (0.46, 2.54) | 0.862 | |
| Q3 | 2.94 (1.42, 6.06) | 0.004 | 2.92 (1.41, 6.03) | 0.004 | 2.85 (1.36, 5.96) | 0.005 | |
| Q4 | 9.18 (4.71, 17.90) | <0.001 | 9.30 (4.76, 18.17) | <0.001 | 8.43 (4.11, 17.26) | <0.001 | |
| <0.001 | <0.001 | <0.001 | |||||
| ALB | ALB | 0.94 (0.91, 0.97) | <0.001 | 0.93 (0.90, 0.97) | <0.001 | 0.94 (0.90, 0.98) | 0.002 |
| ALB (Quartile) | |||||||
| Q1 | Reference | Reference | Reference | ||||
| Q2 | 0.51 (0.31, 0.82) | 0.006 | 0.49 (0.30, 0.80) | 0.005 | 0.47 (0.27, 0.80) | 0.005 | |
| Q3 | 0.37 (0.22, 0.63) | <0.001 | 0.36 (0.21, 0.61) | <0.001 | 0.40 (0.22, 0.71) | 0.002 | |
| Q4 | 0.43 (0.26, 0.70) | 0.001 | 0.41 (0.24, 0.68) | 0.001 | 0.48 (0.26, 0.90) | 0.023 | |
| <0.001 | < 0.001 | 0.013 | <0.001 | ||||
| Outcome | Unplanned readmission |
|---|---|
| Line effect | 2.14 (1.76, 2.60) < 0.001 |
| Inflection point (W) | 0.654 |
| <W segment effect 1 | 46.66 (17.57, 123.95) < 0.001 |
| >W segment effect 2 | 1.41 (1.08, 1.83) 0.011 |
| Log likelihood ratio | <0.001 |
| Variable | HR(95%CI) | ||
|---|---|---|---|
| Overall | 2.24 (1.94, 2.60) | <0.001 | |
| Sex | 0.26 | ||
| Female | 2.43 (1.97, 2.99) | <0.001 | |
| Male | 2.14 (1.71, 2.66) | <0.001 | |
| Age 60 | 0.26 | ||
| No | 2.17 (1.85, 2.55) | <0.001 | |
| Yes | 4.02 (2.33, 6.94) | <0.001 | |
| Smoke | 0.823 | ||
| No | 2.21 (1.87, 2.60) | <0.001 | |
| Yes | 2.21 (1.55, 3.16) | <0.001 | |
| Alcohol | 0.876 | ||
| No | 2.23 (1.91, 2.59) | <0.001 | |
| Yes | 2.40 (1.37, 4.20) | 0.002 | |
| Hypertension | 0.011 | ||
| No | 2.22 (1.91, 2.59) | <0.001 | |
| Yes | 8.14 (2.81, 23.62) | <0.001 | |
| Diabetes | 0.843 | ||
| No | 2.25 (1.93, 2.63) | <0.001 | |
| Yes | 2.62 (1.27, 5.41) | 0.009 | |
| Heart disease | 0.974 | ||
| No | 2.23 (1.93, 2.59) | <0.001 | |
| Yes | 1.90 (0.01, 682.14) | 0.83 | |
| Use of 5-ASA | 0.681 | ||
| No | 2.04 (1.47, 2.81) | <0.001 | |
| Yes | 2.30 (1.93, 2.74) | <0.001 | |
| Use of GCS | 0.379 | ||
| No | 2.39 (1.96, 2.91) | <0.001 | |
| Yes | 1.89 (1.48, 2.42) | <0.001 | |
| Use of immunosuppressive agents | 0.747 | ||
| No | 2.26 (1.95, 2.62) | <0.001 | |
| Yes | 1.84 (0.62, 5.42) | 0.271 | |
| Use of probiotics | 0.899 | ||
| No | 2.27 (1.87, 2.76) | <0.001 | |
| Yes | 2.21 (1.74, 2.81) | <0.001 | |
| Use of biologics | |||
| No | 2.41 (2.07, 2.81) | <0.001 | 0.369 |
| Yes | 1.40 (0.23, 8.40) | 0.714 | |
Peer Reviews
No public reviews on file for this paper yet. If you reviewed it on a platform where reviews are public (OpenReview, ICLR, NeurIPS, ICML), you can paste yours below so the community can read it here.
Videos
No videos yet. Explain this paper in a talk, walkthrough, or lecture? Add one.
Taxonomy
TopicsInflammatory Bowel Disease · Inflammatory Biomarkers in Disease Prognosis · Nutrition and Health in Aging
Introduction
1
Ulcerative colitis (UC) is a chronic, recurrent inflammatory bowel disease (1, 2). Global epidemiological data from 2023 indicates approximately 5 million people worldwide suffer from UC, with incidence rates continuing to rise globally (1). Current clinical treatments for UC, such as anti-inflammatory drugs, immunosuppressants, and biologics, can effectively alleviate clinical symptoms. However, due to the chronic, protracted, and recurrent nature of the disease, patients still face a significant long-term disease burden and reduced quality of life (3, 4).
The annual readmission rate for UC patients reaches as high as 46% (5, 6). Unplanned readmission serves as a critical indicator for assessing disease control quality, typically suggesting inadequate disease management or suboptimal care following initial discharge. This not only exacerbates the health burden on patients but is also significantly associated with increased mortality risk, prolonged hospitalization duration, and higher healthcare costs (6, 7). Consequently, there is an urgent need to identify clinical indicators with strong predictive value for unplanned readmission in UC patients.
C-reactive protein (CRP) is closely associated with mucosal inflammation severity and disease activity, serving as a vital biomarker for UC disease monitoring and management (8–10). Albumin (ALB) is a commonly used laboratory indicator for assessing nutritional status and chronic inflammation severity (11). Low albumin levels are strongly correlated with the risk of colectomy (12), disease recurrence (13), and mortality (14). The C-reactive protein to albumin ratio (CAR) simultaneously reflects inflammation, nutritional status, and immune function, and is considered a more stable and sensitive prognostic assessment tool than either single indicator alone (15, 16). Recent studies indicate that CAR has been used to evaluate UC disease severity (17) and predict treatment response (18), demonstrating promising clinical application potential.
Current research on the relationship between CAR and readmission risk in UC patients remains limited. Therefore, this study, based on a large single-center cohort with a 7-year follow-up, aims to investigate the association between CAR and unplanned readmission in UC patients and evaluate its predictive value.
Materials and methods
2
Study participants
2.1
This retrospective cohort study utilized data from patients hospitalized for UC at the Affiliated Hospital of Shandong University of TCM between June 2017 and June 2024. All participants were followed up for 1 year through telephone interviews, outpatient visits, and inpatient medical records.
The inclusion criteria were as follows: (1) age ≥ 18 years; (2) diagnosis in accordance with the American College of Gastroenterology guidelines (19); and (3) availability of CRP and ALB measurements. The exclusion criteria were as follows: (1) age < 18 years; (2) comorbid severe cardiopulmonary disease, hepatic insufficiency, or renal dysfunction; (3) current malignancy; (4) concomitant non-IBD immune disorders; and (5) prior colectomy.
Of the 527 participants initially screened, 115 were excluded based on the above criteria, yielding a final analytical cohort of 412 individuals, as detailed in Figure 1.
Participant selection process flowchart.
The study was conducted in accordance with the principles of the Declaration of Helsinki and was approved by the ethics committee of the Affiliated Hospital of Shandong University of TCM (Approval No. 2024-152-ky). Written informed consent was obtained from all participants or their legal guardians at the time of initial hospitalization.
Definition of CAR and unplanned readmission
2.2
CAR was defined as the ratio of serum CRP (mg/L) to serum albumin (g/L).
Unplanned readmission referred to any unscheduled hospitalization at our institution caused by acute exacerbation of UC or inadequate clinical management (20). Planned admissions for follow-up surveillance, enteral nutrition, or scheduled medication infusion were excluded. Each case of suspected unplanned readmission was independently assessed by two senior physicians, each with over 10 years of clinical experience. Any discrepancies in evaluation were resolved through discussion until a consensus was reached.
Covariates
2.3
Several clinical characteristics were assessed in this study, including demographics, comorbidities, medication use, and laboratory tests. Demographic data consisted of sex, age, smoking history, and alcohol use. comorbidities included hypertension, diabetes, and cardiovascular disease. Medication use encompassed 5-aminosalicylic acid (5-ASA), immunosuppressants, probiotics, and glucocorticoids (GCS). Laboratory tests involved hemoglobin, platelet count (PLT), white blood cell count (WBC), alanine aminotransferase (ALT), aspartate aminotransferase (AST), total bilirubin, CRP, and ALB. Clinical data were independently collected and cross-verified by two trained administrators.
Statistical analysis
2.4
All statistical analyses were conducted using R 4.3.2 and DecisionLine 1.0. Continuous variables were expressed as mean ± standard deviation if normally distributed, or as median (IQR) if not. Categorical variables were summarized as frequencies and percentages (%). Group comparisons were carried out using Student’s t-test for normally distributed continuous variables and the Mann-Whitney U test for non-normally distributed variables. For categorical variables, either Pearson’s chi-square test or Fisher’s exact test was applied, depending on expected frequencies.
Cox proportional hazards models were employed to evaluate the associations among CAR, CRP, and ALB levels and unplanned readmission in UC patients. Differences in readmission rates across quartiles of each variable were evaluated using Kaplan-Meier survival curves and compared with the log-rank test. Restricted Cubic Splines (RCS) was used to explore potential dose-response relationships between these three variables and unplanned readmission. The likelihood ratio test was applied to assess non-linearity and identify potential threshold effects. For subgroup analyses, patients were stratified by sex, age, smoking history, alcohol use, comorbidities, and medication use, and interaction effects were assessed. The predictive performance of CAR, CRP, and ALB for unplanned readmission was evaluated using receiver operating characteristic (ROC) curves and the area under the curve (AUC). A two-tailed P < 0.05 was considered statistically significant.
Results
3
Baseline characteristics
3.1
This study included 412 participants with a mean age of 46.59 ± 13.78 years, comprising 247 men and 165 women. The median CRP level was 6.00 (15.85) mg/L, and the mean albumin level was 38.67 ± 5.46 g/L. Compared with patients without unplanned readmission, those with unplanned readmission tended to have higher CRP and lower ALB (Supplementary Figure 1). There were no significant intergroup differences in the history of 5-ASA, biologics, or immunosuppressants. The use of probiotics gradually decreased with increasing CAR quartile. The use of GCS gradually increased with increasing CAR quartile. During the 1-year follow-up period, 113 unplanned readmission events occurred, corresponding to a rate of 27.43%. Among patients with UC who experienced unplanned readmission, worsening disease severity was the primary cause, accounting for 105 (92.92%) cases. No mortality was observed during the follow-up period.
As shown in Table 1, participants were stratified into four groups according to quartiles of the CAR: Q1: < 0.063; Q2: 0.063–0.157; Q3: 0.157–0.459; Q4: > 0.459. A statistically significant trend toward increased unplanned readmission rates was observed with ascending CAR quartiles (P < 0.05). Patients with high CAR levels may exhibit a higher prevalence of hypertension, a greater proportion of disease activity, and increased bowel movement frequency, particularly in the severe bowel movement frequency group, where the proportion significantly increases. Concurrently, they may present with elevated PLT, WBC, and AST levels, along with reduced hemoglobin and albumin levels. Furthermore, patients with a high CAR may exhibit elevated CRP and total bilirubin levels.
Supplementary Table 1 presents the characteristics of UC patients grouped by unplanned readmission status within 1 year of follow-up. Compared to those without unplanned readmission, UC patients who experienced unplanned readmission had significantly higher WBC counts, PLT counts, AST levels, CRP levels, and CAR values, as well as lower albumin levels (P < 0.05). In addition, they exhibited a higher rate of GCS use.
Association between the CAR and unplanned readmission in UC patients
3.2
As shown in Table 2, a significant association was observed between the CAR and unplanned readmission in UC patients across all three models (P < 0.001). In the fully adjusted Model 3, each unit increase in the CAR was associated with a 126.9% increase in the risk of unplanned readmission. When participants were categorized by CAR quartiles, those in the Q3 and Q4 groups showed significantly higher risks of unplanned readmission compared to the Q1 group, with a statistically significant trend across quartiles (P < 0.001).
Table 3 presents the associations of CRP and ALB with unplanned readmission in UC patients. CRP was significantly associated with unplanned readmission across all models (P < 0.001). In the fully adjusted Model 3, each 1 mg/L increase in CRP was associated with a 2.7% increase in readmission risk. Similarly, ALB was also significantly associated with unplanned readmission across all models (P < 0.05). In Model 3, each 1 g/L increase in ALB was associated with a 6.1% decrease in readmission risk. When analyzed by quartiles, both CRP and ALB exhibited significant trends for readmission risk (P < 0.05). Supplementary Table 2 presents the final Cox proportional hazards model for the association between CAR and unplanned readmission in UC patients.
Kaplan-Meier survival curves demonstrated significant differences in unplanned readmission rates among groups stratified by CAR, CRP, and ALB quartiles over follow-up time (Log-rank test, P < 0.001). Specifically, higher readmission rates were observed in the high CAR group (Figure 2), high CRP group (Supplementary Figure 2A), and low ALB group (Supplementary Figure 2B).
Kaplan Meier survival curve analysis of unplanned readmission rate in patients with UC based on CAR quartiles. CAR, C-reactive protein to albumin ratio. Kaplan-Meier curves stratified by CAR quartiles showed a clear gradient, with higher CAR associated with lower readmission-free survival over 1 year.
RCS regression and threshold effect analysis
3.3
The RCS curve revealed a positive correlation between the CAR and unplanned readmission in UC patients (P for overall < 0.001), with a significant non-linear relationship (P for non-linear < 0.001) (Figure 3).
Triple spline analysis of CAR and unplanned readmission risk within 1 year after discharge in patients with ulcerative colitis. CAR, C-reactive protein to albumin ratio. Spline analysis demonstrated a significant, non-linear dose-response relationship between CAR and the 1-year risk of unplanned readmission. The risk changed more steeply at lower CAR levels and continued to vary at higher values (P for overall < 0.001; P for non-linear < 0.001).
Threshold effect analysis identified an inflection point at 0.654 in the regression model for unplanned readmission in UC. Using a piecewise Cox regression model, effect sizes were calculated on either side of the inflection point. To the left of the inflection point, each unit increase in CAR was associated with a marked increase in the risk of unplanned readmission (HR = 46.66, 95% CI: 17.57-123.95, P < 0.001). In contrast, beyond the inflection point, the effect of CAR on readmission risk was attenuated (HR = 1.41, 95% CI: 1.08–1.83, P = 0.011) (Table 3).
Supplementary Figures 3A, B present the RCS curves illustrating the associations of CRP and ALB with unplanned readmission in UC patients. CRP exhibited a non-linear positive correlation with readmission, while ALB showed a linear negative correlation.
Subgroup analysis and model evaluation
3.4
As shown in Table 4, subgroup analysis suggested a potential interactive effect between hypertension and CAR on unplanned readmission in UC patients (P for interaction = 0.011). Specifically, hypertensive individuals exhibited a significantly higher risk of unplanned readmission, where each unit increase in CAR conferred an 8.14-fold increase in the risk (HR = 8.14, 95% CI: 2.81–23.62, P < 0.001). In other subgroups, the association between CAR and unplanned readmission remained generally consistent.
The AUC for predicting unplanned readmission using CAR was 0.813 at 1 month, 0.779 at 3 months, 0.778 at 6 months, and 0.799 at 1 year, indicating a robust predictive performance (Figure 4). In addition, we further evaluated the predictive performance of CRP alone and ALB alone for unplanned readmission in patients with UC. The AUCs of CRP at 1, 3, 6 months, and 1 year were 0.798, 0.771, 0.774, and 0.798, respectively (Supplementary Figure 4A), whereas the corresponding AUCs of ALB were 0.745, 0.706, 0.642, and 0.603, respectively (Supplementary Figure 4B).
ROC curves for unplanned readmission of UC at 1, 3, 6 months, and 1 year. AUC, area under the curve. CAR showed consistently good discrimination across follow-up time points, with AUCs ranging from 0.778 to 0.813.
Discussion
4
UC is a chronic inflammatory bowel disease characterized by symptoms such as diarrhea, abdominal pain, and hematochezia. UC typically presents with a fluctuating course, with patients frequently alternating between periods of remission and acute flare-ups. In the management of UC, unplanned readmission is a crucial indicator for assessing disease activity and treatment efficacy. This study is the first to establish a significant association between CAR and unplanned readmission in patients with UC. In the fully adjusted model, each unit increase in CAR was associated with a 126.9% increase in the risk of unplanned readmission. Compared to the lowest quartile (Q1), the highest quartile (Q4) of CAR was associated with an 11.38-fold increase in the risk of unplanned readmission (P < 0.001) (Table 2). This study also confirmed a non-linear relationship between CAR and unplanned readmission, revealing a pronounced dose-response effect that suggests that CAR serves as a reliable biomarker for predicting unplanned readmission.
Multiple studies have confirmed that CAR is closely associated with disease activity, endoscopic severity, acute severe status, and prognosis of biological therapy and surgery in UC. Ailing Liu et al. (21) found that CAR positively correlates with UC disease activity and endoscopic severity, demonstrating superior overall diagnostic performance compared to traditional serological markers such as CRP and ESR (AUC up to 0.918, optimal threshold approximately 0.06). In a large endoscopic grading cohort, CAR was significantly correlated with the Mayo Endoscopic Score (MES) and independently predicted moderate-to-severe endoscopic activity in multivariate models, particularly in patients with extensive colitis. However, its predictive value for mucosal healing and clinical remission is limited, suggesting that its primary utility lies in identifying and stratifying severe disease activity (17, 18). Header et al. (16) demonstrated that dynamic changes in CAR in Egyptian patients with acute severe ulcerative colitis (ASUC) have significant translational implications, with CAR ≥ 0.60 accurately identifying severe disease states (AUC ≈ 0.985). Con et al. (22) demonstrated that CAR measured on day 3 after infliximab (IFX) rescue therapy effectively stratified the 1-year risk of colectomy, outperforming traditional clinical scores (Mayo score, Travis score, Ho index) in multiple comparisons. Insufficient CAR decline indicates poor response to IFX and an increased risk of future surgical intervention.
Elevated CAR levels are closely associated with an increased risk of unplanned readmission in patients with UC, with potential biological mechanisms explained through three pathways: individual inflammatory responses, malnutrition, and compromised immunity. CRP, a non-specific inflammatory marker synthesized by the liver, reflects persistent systemic inflammation when elevated (23), indicating incomplete repair of the intestinal mucosal barrier (24). Decreased albumin levels result not only from chronic inflammation suppressing hepatic synthesis (25) but also correlate closely with intestinal protein loss and malnutrition (26, 27). Hypoalbuminemia weakens epithelial repair and immune defense functions, making patients more susceptible to infection and recurrent inflammation (28). Furthermore, the synergistic effects of inflammatory activation and reduced albumin levels may lead to immune dysfunction, such as impaired lymphocyte function and diminished antioxidant capacity.
Analysis using Kaplan-Meier survival curves demonstrated significant differences in unplanned readmission rates among UC patients grouped by quartiles of CAR, CRP, and ALB (log-rank test, P < 0.001). Further RCS regression analysis revealed a non-linear relationship between CAR and unplanned readmission. The study demonstrated a clear dose-response relationship between increasing CAR and unplanned readmission risk, with the risk increasing after CAR reached a certain threshold (0.654). Prior to the CAR inflection point (0.654), even a slight elevation significantly increased the risk of unplanned readmission, suggesting that imbalances in the inflammation-nutrition-immunity pathway may amplify adverse outcomes in patients with UC. Post-inflection, the risk increase flattened, potentially reflecting patients’ acute critical condition. Previous studies (21) reported CAR≈0.6 as a stratification threshold for severe illness. This demonstrates that the CAR effectively distinguishes risk groups, particularly exhibiting a high risk-identification capability within the moderate-to-severe range. For patients with extremely high CAR values, greater emphasis should be placed on post-discharge prognostic management and close follow-up rather than relying solely on sustained CAR elevation to assess risk gradients.
Subgroup analysis revealed that CAR significantly influenced unplanned readmissions in patients with hypertension (P = 0.011). Extensive research indicates hypertension correlates with inflammation and immune responses (29–32). This finding underscores the necessity of considering hypertension when evaluating the prognostic significance of CAR in patients with UC. Finally, ROC curve analysis revealed CAR’s strong predictive performance for unplanned readmission. The CAR demonstrated AUC values of 0.813, 0.779, 0.778, and 0.799 at the 1-month, 3-month, 6-month, and 1-year follow-up periods, respectively, indicating good-to-excellent predictive performance. In addition, we separately evaluated the independent predictive performance of CRP and ALB, and found that CRP showed relatively stable discriminative ability across follow-up time points, whereas the predictive performance of ALB gradually declined over time. Overall, CAR demonstrated the best predictive performance, with a more pronounced advantage for early readmission prediction (1–3 months). With longer follow-up, however, the incremental gain of CAR over CRP became smaller, possibly because CRP more consistently reflects inflammatory burden, whereas ALB is more susceptible to nutritional status, intestinal protein loss, and hemodilution due to intravenous fluid administration, thereby diminishing its contribution to longer-term readmission prediction (33–35).
This study is the first to establish a significant association between CAR and unplanned readmissions in UC patients. The efficacy of CAR as a predictive tool was comprehensively validated through Cox proportional hazards models, Kaplan-Meier survival curves, and RCS regression analysis. RCS analysis revealed a non-linear dose-response relationship between CAR and the risk of unplanned readmission, with a marked deceleration in risk increase when CAR reached 0.654, underscoring the importance of managing and monitoring high-risk patients with UC. Using ROC curve analysis, this study found that CAR demonstrated good predictive capability for unplanned readmission in both short-term (1 and 3 months) and long-term (6 months and 1 year) periods, with AUC values of 0.813, 0.779, 0.778, and 0.799, respectively. Additionally, subgroup analysis revealed a stronger association between CAR and unplanned readmission risk in patients with hypertension, further exploring the applicability of CAR in predicting unplanned readmission for UC across different populations.
Limitations
5
However, this study had certain limitations. First, as a retrospective study, it carries potential retrospective and selection biases. Future validation through prospective multicenter studies is needed to further confirm the efficacy of the CAR in predicting unplanned readmissions among patients with UC. Second, although this study considered multiple relevant variables affecting CAR’s predictive power for readmissions, some potential confounding factors may still exist. Therefore, future studies should design more comprehensive questionnaires and conduct prospective investigations to explore the relationship between the CAR and other relevant variables in greater depth. Finally, while this study confirmed that 95% of unplanned readmissions were due to UC reactivation, some patients were readmitted for other reasons. Consequently, future research should explore additional prognostic indicators to comprehensively evaluate the association between CAR and other potential factors.
Conclusion
6
The results of this study indicate that CAR exhibits a significant non-linear association and dose-response relationship with unplanned readmissions in patients with UC. After multivariate adjustment, CAR levels remained positively correlated with UC readmission rates in a non-linear manner. Furthermore, CAR demonstrated a strong predictive value for unplanned readmissions at 1 month, 3 month, 6 months, and 1 year. In summary, CAR serves as a novel biomarker for predicting unplanned readmissions in patients with UC, holding significant value for post-hospitalization management of these individuals.
The reference list from the paper itself. Each links out to its DOI / PubMed record.
- 1Le Berre C Honap S Peyrin-Biroulet L. Ulcerative colitis. Lancet. (2023) 402:571–84. 10.1016/s 0140-6736(23)00966-2 37573077 · doi ↗ · pubmed ↗
- 2Voelker R. What is ulcerative colitis? JAMA. (2024) 331:716. 10.1001/jama.2023.23814 38306113 · doi ↗ · pubmed ↗
- 3Raine T Bonovas S Burisch J Kucharzik T Adamina M Annese V ECCO guidelines on therapeutics in ulcerative colitis: medical treatment. J Crohns Colitis. (2022) 16:2–17. 10.1093/ecco-jcc/jjab 178 34635919 · doi ↗ · pubmed ↗
- 4Attauabi M Madsen G Bendtsen F Seidelin J Burisch J. Incidence, disease burden, and clinical presentation of patients newly diagnosed with inflammatory bowel disease in a population-based inception cohort. J Crohns Colitis. (2025) 19:jjae 176. 10.1093/ecco-jcc/jjae 176 39565294 · doi ↗ · pubmed ↗
- 5Kruger A Hinton A Afzali A. Index severity score and early readmission predicts increased mortality in ulcerative colitis patients. Inflamm Bowel Dis. (2019) 25:894–901. 10.1093/ibd/izy 297 30247551 · doi ↗ · pubmed ↗
- 6Weissman S Sharma S Fung B Aziz M Sciarra M Swaminath A Increased mortality and healthcare costs upon hospital readmissions of ulcerative colitis flares: a large population-based cohort study. Crohns Colitis 360. (2021) 3:otab 029. 10.1093/crocol/otab 029 36776672 PMC 9802231 · doi ↗ · pubmed ↗
- 7Miyatani Y Micic D. Revisiting the risk of hospital readmission in severe ulcerative colitis. Inflamm Bowel Dis. (2024) 30:688–9. 10.1093/ibd/izad 212 37682866 · doi ↗ · pubmed ↗
- 8Dorofeyev A Holub S Babayeva G ÀnaniinÎ. Application of intellectual monitoring information technology in determining the severity of the condition of patients with inflammatory bowel diseases. Wiad Lek. (2021) 74:481–6. 10.36740/W Lek 20210311833813454 · doi ↗ · pubmed ↗