Microglial heterogeneity: influence of human 2D, 3D, and co-culture models on gene expression and immune function
Fazeleh Etebar, Anthony R. White, Hazel Quek

TL;DR
This study shows how different culture conditions affect human microglial cell diversity and immune function, revealing new cell states and signaling patterns.
Contribution
The paper identifies novel microglial states and demonstrates how culture dimensionality and co-culture influence their heterogeneity and immune responses.
Findings
Four microglial states were identified, including IFN-responsive, chemokine-enriched, metabolically active, and proliferative states.
3D cultures showed greater cellular diversity and metabolic activity compared to 2D cultures.
Co-culture increased proliferative microglia and immune communication via CCL2/CCL5/CCL7, CSF1, and VEGF/FLT1 pathways.
Abstract
Microglia, the resident immune cells of the central nervous system, exhibit substantial phenotypic and functional diversity shaped by local microenvironmental cues. While advanced in vitro human microglial models exist, the influence of culture dimensionality and cellular context on microglial state composition remains poorly defined. Here, we analyzed single-cell RNA sequencing datasets from human monocyte-derived microglia (MDMi) cultured under two-dimensional (2D) and three-dimensional (3D) monoculture, as well as 3D neural–glial co-culture conditions. Across platforms, four microglial states were identified, including interferon (IFN)-responsive, chemokine-enriched, metabolically active, and proliferative states, with pronounced environment-dependent transcriptional shifts. 2D cultures were dominated by IFN-responsive microglia characterized by elevated IFITM2 and IFITM3 expression,…
Genes, proteins, chemicals, diseases, species, mutations and cell lines named across the full text — each resolved to its canonical identifier and authoritative record.
Click any figure to enlarge with its caption.
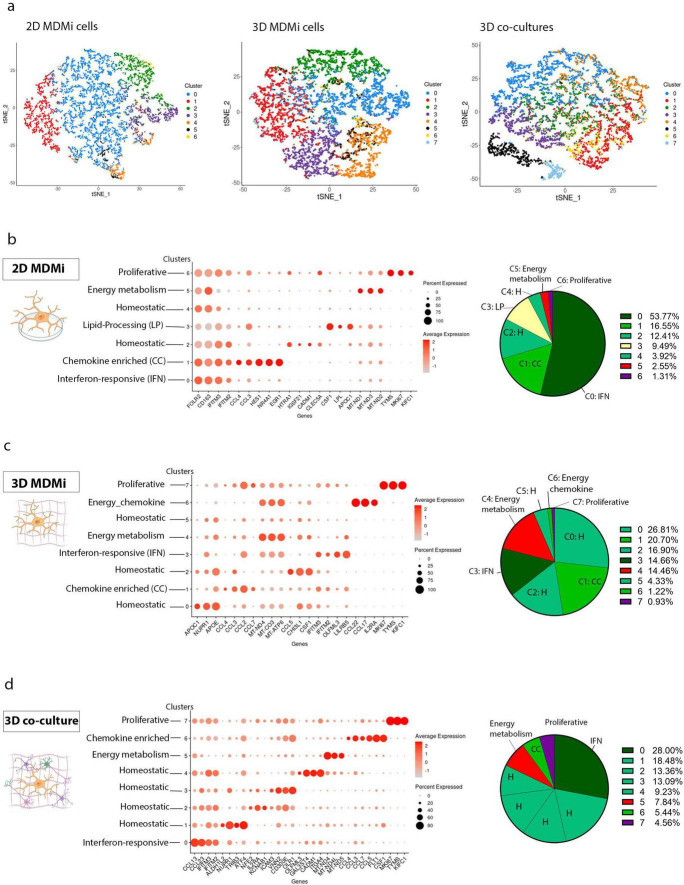 FIGURE 1
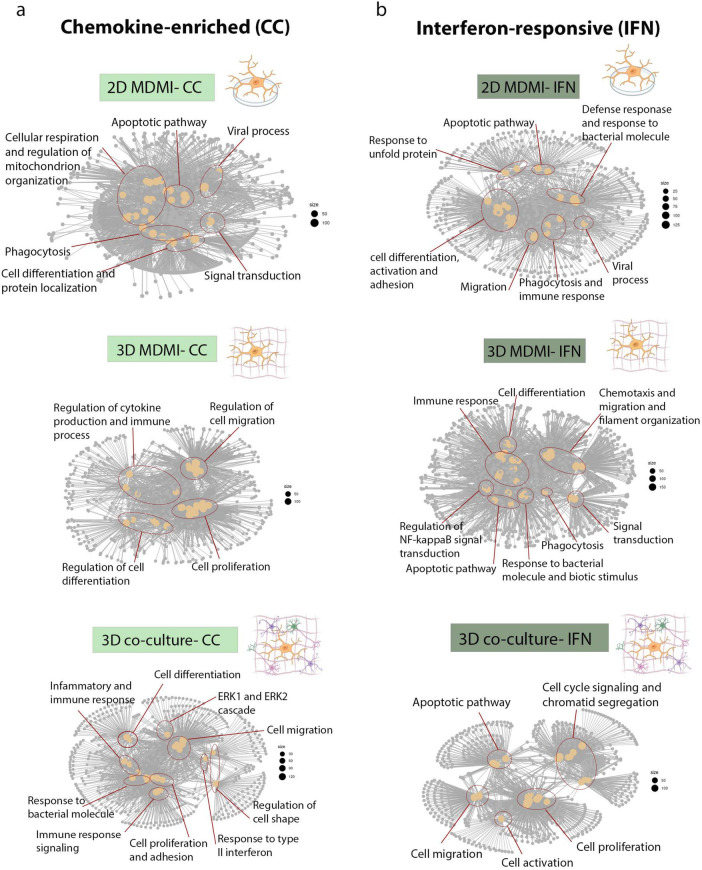 FIGURE 2
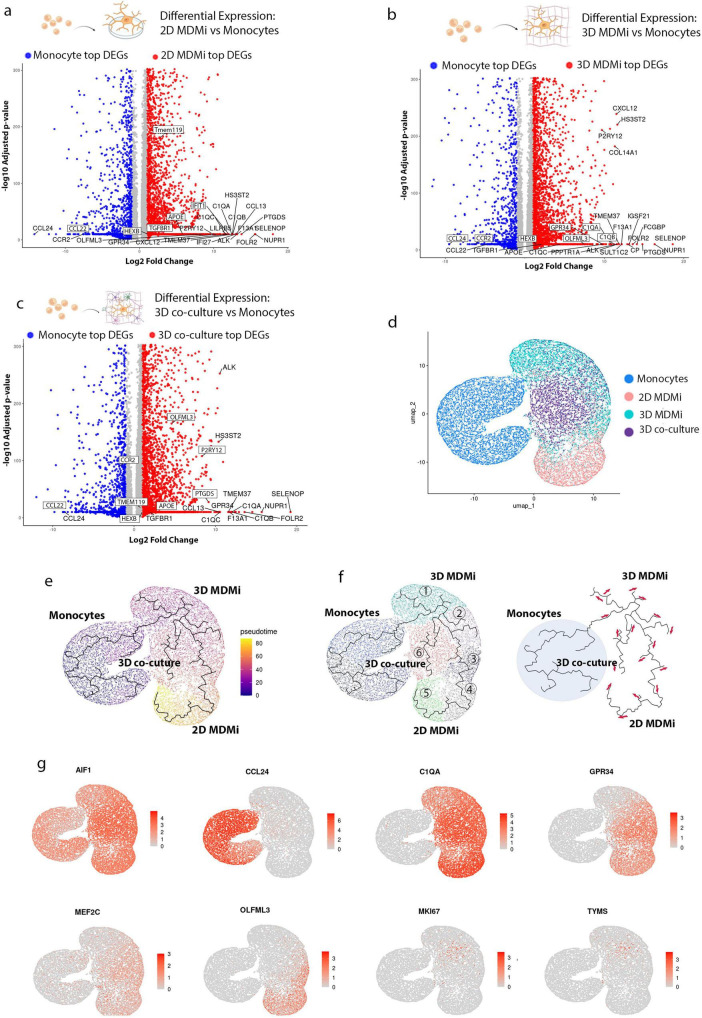 FIGURE 3
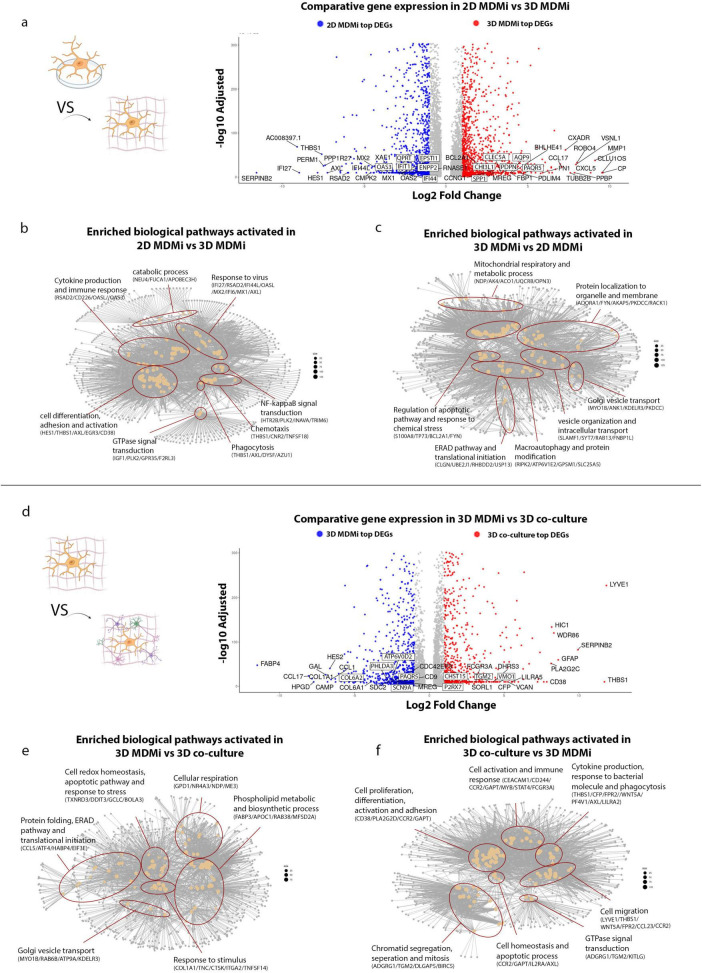 FIGURE 4
Peer Reviews
No public reviews on file for this paper yet. If you reviewed it on a platform where reviews are public (OpenReview, ICLR, NeurIPS, ICML), you can paste yours below so the community can read it here.
Videos
No videos yet. Explain this paper in a talk, walkthrough, or lecture? Add one.
Taxonomy
TopicsNeuroinflammation and Neurodegeneration Mechanisms · Single-cell and spatial transcriptomics · Immune cells in cancer
Introduction
1
Chronic neuroinflammation, driven largely by microglia, plays a pivotal role in the progression of neurodegenerative diseases such as Alzheimer’s disease (AD), Parkinson’s disease (PD), and amyotrophic lateral sclerosis (ALS). As the resident immune cells of the central nervous system (CNS), microglia exhibit significant phenotypic and functional diversity (Hammond et al., 2019; Masuda et al., 2019; Ochocka et al., 2021; Paolicelli et al., 2022), adopting context-dependent states that can exert neuroprotective or neurotoxic effects depending on disease stage and microenvironmental cues (Michell-Robinson et al., 2015, Colonna and Butovsky, 2017; Friedman et al., 2018; Lloyd et al., 2024). Despite increasing knowledge of microglia’s role in these conditions, accurately modeling this diversity in vitro remains a challenge due to the limitations of current culture systems.
Conventional two-dimensional (2D) culture systems are widely used due to their simplicity and scalability; yet they impose physical constraints that alter metabolic state, functional behavior and give rise to transcriptionally distinct sub-populations (Cadiz et al., 2022; Cuní-López et al., 2023). The lack of extracellular matrix architecture and spatial organization limits cell–cell communication and limits the development of microglial transcription states associated with tissue context. In contrast, three-dimensional (3D) cultures better mimic native tissue environments, supporting spatial organization, improved cellular interactions and in vivo-like tissue architecture (Shamir and Ewald, 2014; Moysidou et al., 2021; Sharaf et al., 2023). Despite their growing use, the impact of dimensionality alone on microglial identity, subtype composition and differentiation trajectories remain unclear. Recent advances in human microglial modeling have highlighted the importance of environmental context in shaping transcriptional and functional states (Haenseler et al., 2017; Depp et al., 2025; Fumagalli et al., 2025). Microglia exposed to defined cytokine milieus, extracellular matrix properties and cellular neighbors adopt gene expression programs and metabolic profiles that more closely resemble ex vivo human microglia (Gosselin et al., 2017; Mancuso et al., 2019; Dolan et al., 2023). 3D culture and co-culture with neural or glial cells promote ramified morphologies, sustained viability and engagement of immune and homeostatic pathways that are poorly captured in 2D monocultures (Schafer et al., 2023; Zhang et al., 2023). Nevertheless, variability in differentiation protocols, matrix composition and co-culture strategies continues to limit cross-study comparability, and systematic evaluations of how dimensionality and cellular context interact to shape microglial differentiation are scarce.
Human primary microglia are difficult to obtain at scale and while induced pluripotent stem cell-derived microglia (iMG) have expanded modeling capacity, differentiation efficiency and maturation state can vary across protocols and donor lines. Monocyte-derived microglia-like cells (MDMi) provide a complementary, accessible human model that retains donor-specific genetic and environmental information, enables longitudinal sampling and is compatible with 3D matrices and multicellular co-culture systems (Ohgidani et al., 2014; Ryan et al., 2017; Cuní-López et al., 2024). Building on prior work establishing patient-derived MDMi platforms (Cuní-López et al., 2024), we reasoned that both culture dimensionality (2D vs. 3D) and cellular context (monoculture versus neural–glial co-culture) would act as key determinants of microglial state composition, maturation dynamics and pathway engagement, even in healthy donor-derived cells.
Here, we leveraged previously characterized MDMi cultured under defined 2D, 3D, and 3D neural-glial co-culture conditions and applied further in-depth analyses to interrogate how microglia adapt to distinct in vitro environments. By mapping transcriptional states and differentiation trajectories across culture platforms, we aimed to define how dimensionality and cellular context shape microglial identity at baseline. This framework informs the selection of human microglial models for mechanistic studies, disease modeling and therapeutic discovery.
Materials and methods
2
Monocyte-derived microglia-like cell generation and culture conditions
2.1
Human monocyte-derived microglia-like cells (MDMi) were generated from peripheral blood monocytes as previously described (Quek et al., 2022; Cuní-López et al., 2024). Briefly, monocytes isolated from healthy donor peripheral blood were differentiated in RPMI-1640 medium supplemented 10 ng/mL GM-CSF and 100 ng/mL IL-34 and maintained under two-dimensional (2D) monoculture, three-dimensional (3D) monoculture or 3D neural–glial co-culture conditions. In 3D cultures, cells were embedded within a Matrigel matrix to provide spatial context, while 3D co-cultures incorporated ReNcell VM–derived neural components that differentiate into mixed neuronal and glial populations.
Prior to single-cell RNA sequencing, cells were dissociated using a non-enzymatic detachment method using a cell recovery solution (Corning, 354253) and fluorescence-activated cell sorting (FACS) was performed to isolate CD11b^+^ cells, thereby excluding leukocytes, neural and glial components. Sorted cells were immediately fixed and processed using the Chromium Next GEM Single Cell Fixed RNA Kit (10x Genomics) according to the manufacturer’s instructions. For scRNA-seq, MDMi were harvested at day 14 in 2D monoculture and at approximately day 30–35 in 3D monoculture and 3D neural–glial co-culture conditions, consistent with the experimental timelines used to generate the GSE255718 dataset (Cuní-López et al., 2024). Detailed experimental protocols are provided in the referenced publication, and no modifications were introduced for the present analysis.
Single-cell RNA sequencing data resource, processing, QC metrics, and clustering
2.2
Single-cell RNA sequencing libraries were generated as described previously (Cuní-López et al., 2024). Briefly, libraries were prepared using the Chromium Next GEM Single Cell Fixed RNA Kit (10x Genomics) and sequenced on an Illumina NextSeq 2000 platform. Raw sequencing data were processed using Cell Ranger v7.0.0 (10x Genomics) (Zheng et al., 2017), including demultiplexing, alignment to the human reference genome, and generation of gene–cell count matrices. For the present study, Cell Ranger–generated count matrices were used as the starting point for all downstream analyses. Filtered feature–barcode matrices were imported into R (v4.0.5) (R Core Team, 2019) using the Read10X function and assembled into Seurat objects using CreateSeuratObject (Hao et al., 2021).
Raw gene expression matrices were processed using Seurat. Cells were filtered based on standard quality control metrics, including the number of detected genes per cell, total UMI counts, and the proportion of mitochondrial transcripts. Cells with fewer than 200 detected genes or more than 6,000 detected genes were excluded to remove low-quality cells and potential doublets. Quality control thresholds were applied uniformly across all samples to minimize systematic bias between experimental groups. Following quality control, 12,244 monocytes (from 12,248), 6,472 2D MDMi (from 7,003), 7,736 3D MDMi (from 7,838), and 6,211 3D co-culture MDMi (from 6,426) were retained for downstream analyses (Supplementary Table 1).
Gene expression values were log-normalized and highly variable genes were identified using Seurat’s standard workflow. Data were scaled to minimize the influence of highly expressed genes prior to dimensionality reduction. Principal component analysis (PCA) was performed, followed by non-linear embedding using Uniform Manifold Approximation and Projection (UMAP) or t-distributed stochastic neighbor embedding (t-SNE) for visualization. Graph-based clustering was conducted using Seurat’s FindClusters function, with optimal resolution determined using the Clustree package (Zappia and Oshlack, 2018) to avoid over- or under-clustering. Individual samples were processed independently through quality control and normalization prior to aggregation for downstream analyses. Samples were subsequently aggregated using Seurat’s merge() function while retaining sample identity metadata (orig.ident) to enable assessment of potential sample-driven effects.
Identifying differentially expressed genes, cell subtypes and pathway enrichment
2.3
Differentially expressed genes (DEGs) between clusters within each sample were identified using Seurat’s ‘FindMarkers’ function with the default Wilcoxon rank-sum test for pairwise comparisons. Resulting p-values were adjusted for multiple testing using the Benjamini–Hochberg false discovery rate (FDR) correction. Significantly differentially expressed genes were defined as having an adjusted p < 0.05) and log FC > 0.5. Each transcriptionally distinct cluster was subsequently examined to define microglial subtypes based on the expression of canonical marker genes and functional gene signatures. All quantitative differential gene expression statistics underlying dot plots, heat maps and volcano plots are provided in Supplementary Tables 2–5 to enable direct numerical comparison independent of visual scaling.
To gain biological insight into the molecular/biological functions of each subtype, DEGs were analyzed for functional enrichment in pathways and Gene Ontology (GO) terms. Enrichment analysis was performed using an overrepresentation test implemented in the package clusterProfiler (Wu et al., 2021), with significance determined by adjusted p < 0.05. Annotation and mapping of gene identifiers (e.g., Entrez ID, Ensembl ID, gene description) were carried out using the AnnotationHub package (Morgan and Shepherd, 2017).
Sample aggregation and pseudotime trajectory mapping of microglial states
2.4
Individual samples were processed independently through quality control and normalization and subsequently aggregated using Seurat’s merge() function while retaining sample identity metadata. Because all samples were generated using the same platform, chemistry, and processing pipeline and were processed in parallel, no strong technical batch effects were detected. Data integration methods were therefore not applied, as they may remove genuine biological variability, particularly in highly plastic immune cell populations (Luecken and Theis, 2019; Stuart et al., 2019; Marsh et al., 2022). To examine transition between microglial states and influence of 2D and 3D culture conditions, aggregated scRNA-seq data were used for comparative analysis. Filtered Seurat objects were merged using the merge function, ensuring each cell retained its corresponding sample identifier. Data were normalized using NormalizeData, variable genes were identified via FindVariableFeatures, and expression values were scaled with ScaleData to reduce technical variation across datasets. Dimensionality reduction was performed using PCA (RunPCA), followed by visualization through UMAP and t-SNE). All dimensionality reductions were based on the variable features identified during preprocessing. Cluster visualization and sample-specific comparisons were generated using DimPlot, and expression of key markers was examined using FeaturePlot.
To infer dynamic differentiation processes, pseudotime trajectory analysis was conducted using Monocle3 (Trapnell et al., 2014). This analysis enabled reconstruction of developmental trajectories and identification of transcriptional transitions among microglial populations. The integrated Seurat object was converted to a cell_data_set format, and cell clustering and trajectory learning were performed using the cluster_cells and learn_graph functions. The resulting trajectory was visualized with plot_cells, overlaid onto the UMAP representation. A principal node within the monocyte population was designated as the root for pseudotime ordering using order_cells, enabling visualization of temporal progression and branching of microglial states. Cells were color-coded by pseudotime to illustrate differentiation trajectories and state transitions across 2D, 3D and co-culture conditions.
Results
3
Four major microglial subtypes identified in 2D and 3D models highlight culture-driven pathway changes
3.1
Single-cell RNA sequencing was performed on CD11b^+^ monocyte-derived microglia generated from healthy donors and cultured under 2D, 3D and 3D neural–glial co-culture conditions, as previously established (Cuní-López et al., 2024). To isolate the effects of culture conditions on microglial transcriptional states, analyses were performed independently of disease context. Using an in-depth, unified clustering and annotation framework, we systematically interrogated microglial heterogeneity across culture environments. Clusters were identified independently for each culture condition using unsupervised clustering (Figure 1a) and annotated post hoc based on established microglial marker gene expression (Figures 1b–d). This analysis revealed transcriptional diversity that had not been fully captured previously, identifying four recurrent microglial states including chemokine-enriched (CC), interferon (IFN)-responsive, metabolically active and proliferative, that together comprised the dominant cellular populations across all models (Figures 1a–d). A chemokine-enriched population, characterized by CCL4 and CCL3 expression, was consistently observed across all systems, though its abundance and transcriptional composition differed, comprising 16.6% of cells in 2D cultures (Figure 1b), 20.7% in 3D cultures (Figure 1c), and 5.4% in 3D co-cultures (Figure 1d). This cluster displayed environment-specific transcriptional rewiring—in 3D monoculture, cells upregulated CCL7 and CCL2, while the 3D co-culture environment induced expression of CCL7, CCL5, FLT1, and CSF1, genes associated with immune cell recruitment, angiogenic signaling and microenvironmental crosstalk. Consistent with prior reports that microglial transcriptional states are highly sensitive to cellular context, we observed environment-dependent changes in chemokine and cell-cell interaction pathways, with co-culture conditions preferentially engaging immune recruitment–associated signaling (e.g., CCL2/CCL5/CCL7) (Xue et al., 2021; Gullotta et al., 2023) and microenvironmental/vascular crosstalk (e.g., CSF1 and VEGF/FLT1-associated signaling) (Cakir et al., 2019; Sun et al., 2022). Together, these context-dependent changes illustrate how culture architecture and cellular interaction selectively shape microglial chemokine pathways, revealing transcriptional mechanisms that can confer functional heterogeneity that was obscured in earlier analyses.
Comparative analysis of microglial subtypes in 2D, 3D, and 3D co-culture models. (a) The t-SNE plots depict the clustering of microglial cells based on transcriptomic profiles across the 2D (n = 6,472 cells), 3D (n = 7,736 cells), and 3D co-culture (n = 6,211 cells). Numeric cluster IDs reflect unsupervised clustering performed independently for each culture condition and do not imply correspondence across models; biological cluster identities are defined based on marker gene expression shown in the accompanying dot plots. (b–d) Dot plots illustrate gene expression patterns within each identified microglial cluster in 2D, 3D, and 3D co-culture model, with dot size indicating the percentage of cells expressing a given gene and color intensity reflecting the average expression level. Pie charts on the left represent the proportional distribution of the microglial subtypes including proliferative, energy metabolism, chemokine-enriched (CC), and interferon-responsive (IFN) within each culture model.
Immediate-early genes (IEGs), such as FOS and JUN, encode AP-1 transcription factors that are rapidly induced via MAPK signaling in response to environmental and immune cues (Shaulian and Karin, 2002). In our dataset, modest enrichment of AP-1/IEG expression in 2D cultures, particularly within cluster 1, is consistent with rigid substrates and limited 3D cell–cell and extracellular matrix interactions, which promote integrin- and MAPK-dependent transcriptional programs (Discher et al., 2005; Glass et al., 2010; Baker and Chen, 2012). Cluster 1 was primarily defined by an interferon-responsive program (IFITM2, IFITM3, C1QA–C), with FOS and JUN present at low levels and not driving cluster identity, consistent with an immune-alert microglial state rather than dissociation-induced stress (Supplementary Figure 1; Marsh et al., 2022).
The IFN-responsive subtype dominated the 2D model (53.8%), characterized by elevated IFITM2 and IFITM3 expression and declined markedly in 3D (14.7%) and 3D co-culture (28%) conditions. Conversely, the 3D model exhibited a more balanced composition of IFN-responsive (14.7%), chemokine-enriched (20.7%) and metabolically active (14.5%) microglia, reflecting greater transcriptional diversity. A metabolically active microglial population was identified across all models, characterized by elevated mitochondrial gene expression, including MT-ND1, MT-ND2 and MT-ND3, together with immune-regulatory markers FOLR2 and CD163, indicating increased metabolic activity and energy demand. This population accounted for 2.55% of cells (cluster 5) in 2D culture, 14.46% (cluster 4) and 1.22% (cluster 6) in 3D culture and 7.84% (cluster 5) in 3D co-culture (Figures 1b–d). Within the 3D model, cluster 6 also expressed CCL22, CCL17 and IL2RA, consistent with immune-metabolic coupling within the transcriptional profile (Figure 1c).
Interestingly, the 3D co-culture system contained the largest proportion of proliferative microglia (4.56% vs. 1.31% in 2D and 0.93% in 3D), defined by MKI67, TYMS and KIFC1 expression, suggesting that the neural environment supports expansion of a cell-cycle-active compartment (Figure 1d). A distinct 2D-specific cluster enriched for CSF1, LPL and APOC1 exhibited a lipid-metabolic and phagocytic gene signature, consistent with a transcriptionally activated or disease-associated microglial state (Figure 1b); as previously described in neurodegenerative and inflammatory contexts (Keren-Shaul et al., 2017; Krasemann et al., 2017; Shimizu and Prinz, 2025). Comprehensive expression profiles for all clusters are provided in Supplementary Figures 2–4. Together, these analyses show that microglia acquire distinct transcriptional states across culture environments.
Microglial pathway enrichment patterns differ across culture environments
3.2
To determine how subtype-specific differences translate into broader transcriptional programs, we performed pathway enrichment analysis across 2D, 3D and 3D co-culture microglial models. In 2D culture, chemokine-enriched microglia were associated with pathways governing immune surveillance, including viral responses, phagocytosis, mitochondrial organization and apoptotic regulation. Transitioning to a 3D matrix increased the representation of genes involved in cytokine production, immune activation, immune activation and cellular motility, indicating a transcriptional shift toward immune-signaling pathway. Notably, the 3D co-culture model showed further enrichment of pathways linked to ERK1/ERK2 signaling, bacterial pattern recognition and type II interferon responses. Additional gene set enrichment indicated involvement of pathways regulating cell proliferation, adhesion and differentiation, highlighting transcriptional complexity within the 3D co-culture environment (Figure 2a).
Pathway enrichment networks of chemokine-enriched and interferon-responsive microglial subtypes across culture models. (a) The network diagrams illustrate enriched top 30 biological pathways activated in chemokine enriched subtype across models. (b) The network diagrams illustrate enriched 30 top biological pathways activated in Interferon responsive subtype across models. Node size reflects the number of genes contributing to each enriched GO term, while edges indicate shared genes between pathways.
IFN-responsive microglia in 2D culture displayed enrichment for immune defense, phagocytosis and viral response pathways. In 3D conditions, these cells showed increased representation of genes programs linked to chemotaxis, cytoskeletal reorganization, NF-κB signaling and broader inflammatory responses. Within 3D co-cultures, further enrichment of pathways related to cell cycle progression, chromatid segregation and migration reflected activation of proliferative and surveillance-associated gene networks (Figure 2b). Together, these results show that increasing culture complexity (from 2D to 3D and then to co-culture), broadens and strengthens transcriptional programs. We next asked whether these changes alter the core molecular identity of microglia by examining conserved and model-specific gene expression signatures across environments.
Culture environment preserves core microglial identity while shaping transcriptional diversity
3.3
Differentially expressed gene (DEG) analysis revealed that key microglial genes—including SELENOP, NUPR1, FOLR2 and C1QA—were consistently expressed across 2D, 3D and 3D co-culture systems compared to monocytes, highlighting their central roles in immune regulation and maintenance of microglial identity (Figures 3a–c). This pattern is consistent with prior studies defining these genes as core components of human microglial transcriptional and immune-regulatory programs (Gosselin et al., 2017; Hammond et al., 2019; Masuda et al., 2019). Complement- and chemokine-associated genes such as C1QB and CXCL12 were likewise conserved across 2D and 3D models, indicating preservation of a stable immune-associated transcriptional signature.
Differential gene expression and pseudotime trajectory of monocyte-to-microglia differentiation across in vitro culture models. (a–c) Volcano plots illustrating the top upregulated (red) and downregulated (blue) genes in microglia from each model compared to monocytes. (d) The UMAP plot illustrates the transcriptomic aggregation of monocytes and microglial cells across the 2D, 3D, and 3D co-culture models. (e) UMAP visualization of the pseudotime trajectory depicting monocyte-to-microglia differentiation across the three in vitro models. Pseudotime values mapped onto cells, colored from early (dark blue) to late (yellow) differentiation stages. (f) Left: UMAP plot with annotated trajectory clusters (1–6), corresponding to distinct phases of differentiation or cellular states. Right: Trajectory structure with directional arrows indicating the progression along pseudotime. (g) The UMAPs plots (right) show expression patterns of key genes, including AIF1, CCL24, C1QA, GPR34, MEF2C, OLFML3, MKI67, and TYMS.
The culture environment additionally influenced other transcriptional programs, with 3D conditions promoting increased expression of FCGBP and IGSF21, genes previously associated with cell–cell communication and extracellular matrix-related processes (Hedegaard et al., 2020). These findings indicate that while the core molecular identity of microglia is largely preserved across models, the magnitude and composition of transcriptional variation are strongly shaped by culture environment.
To explore transcriptional heterogeneity across environments, we applied pseudotime trajectory analysis to integrated single-cell datasets from monocytes, 2D, 3D and 3D co-culture systems (Figure 3d). This approach reconstructed lineage trajectories and captured transitional states across environments. In 2D cultures, cells followed a relatively linear trajectory, consistent with a more uniform transcriptional state. By contrast, 3D and 3D co-cultures exhibited multiple branches, reflecting enhanced transcriptional heterogeneity and the presence of diverse microglial states (Figures 3e,f).
Lineage markers were consistent across trajectories, with sustained expression of the myeloid marker AIF1 and canonical microglial markers such as C1QA, confirming microglial lineage identity in line with prior single-cell studies defining these genes as core components of the microglial transcriptional program (Masuda et al., 2019). In contrast, CCL24 was enriched at early pseudotime, consistent with progenitor-like or transitional myeloid states as previously reported (Van Hove et al., 2019).
Genes including GPR34 and OLFML3 were enriched in distinct trajectory branches, highlighting environment-dependent microglial transcriptional programs (Grabert et al., 2016). Notably, proliferation-associated genes (TYMS, MKI67) were enriched in terminal branches of the 3D co-culture trajectory, consistent with the emergence of proliferative microglial states in complex, tissue-like conditions (Hammond et al., 2019; Masuda et al., 2019; Figure 3g).
Environmental context drives distinct transcriptional programs in human microglial models
3.4
To determine how culture architecture and cellular context shape microglial transcriptional identity, we compared gene expression and pathway activity across MDMi cultured in 2D, 3D monoculture and 3D neural–glial co-culture systems. By integrating differential gene expression and pathway enrichment analyses, we aim to resolve how dimensionality alone, as well as the presence of neural and glial components, influences microglial activation, metabolic and intercellular communication. This unified framework enabled direct comparison of microglial transcriptional programs across progressively complex in vitro environments, providing mechanistic insight into how microenvironmental cues drive microglial heterogeneity and putative functional specialization.
In 2D cultures, upregulated genes such as THBS1, RSAD2, MX2, and PERM1 (Figure 4a, blue) were associated with activation of interferon, cytokine and NF-κB–related transcriptional programs, consistent with interferon-responsive microglial signatures observed in single-cell studies of immune-activated states previously reported (Lopez-Atalaya and Bhojwani-Cabrera, 2025; Tang et al., 2025). Pathway enrichment further revealed processes related to cell differentiation and adhesion, suggesting microglial adaptation to 2D culture environment (Figure 4b). In contrast, 3D cultures display pronounced up-regulation of CXADR, ROBO4, CCL17, CXCL5, and MMP1 (Figure 4a, red), indicative of engagement of extracellular-matrix remodeling, immune-cell recruitment and metabolic activation—a pattern aligned with context-dependent microglial transcriptional diversity described in recent reviews of microglia heterogeneity (Fumagalli et al., 2025). Enriched pathways in 3D included mitochondrial respiration, vesicle organization and protein transport, reflecting enhanced transcriptional signatures linked to metabolic and secretory capacity. Collectively, these analyses highlight that 2D cultures preferentially support stress- and immune-primed states, whereas 3D models promote metabolically active and transcriptionally diverse programs, providing a molecular context for the microglial heterogeneity observed in previous analyses (Figure 4c).
Comparative gene expression and functional pathway analysis between microglial culture models. (a) Volcano plot showing differentially expressed genes between 3D and 2D cultures. Genes significantly upregulated in 3D cultures are shown in red, while those upregulated in 2D cultures are shown in blue. (b) Network diagram displaying the top 100 enriched biological pathways activated in 2D cultures compared to 3D cultures. (c) Network diagram displaying the top 100 enriched biological pathways activated in 3D cultures compared to 2D cultures. (d) Volcano plot showing differentially expressed genes between 3D co-culture and 3D monoculture. Genes significantly upregulated in the 3D co-culture are shown in red, while those upregulated in 3D monoculture are shown in blue. (e) Network diagram of the top 100 enriched pathways activated in 3D monoculture relative to 3D co-culture. (f) Network diagram of the top 100 enriched pathways activated in 3D co-culture relative to 3D monoculture. Genes shown in volcano plots meet differential expression criteria (adjusted p < 0.05 and |log2FC| ≥ 0.3); complete DEG statistics and top regulated genes are provided in Supplementary Data. Node size in Network diagrams reflects the number of genes contributing to each enriched GO term, while edges indicate shared genes between pathways.
Building on the environment-dependent effects, we next compared microglial transcriptional profiles between 3D monoculture and a 3D neural–glial system incorporating ReNcell VM, a human neural progenitor line that spontaneously differentiates into a mixed population of neurons and glial (predominantly astrocytes) (Cuní-López et al., 2024), thereby providing a more complex neural-glial context.
In the 3D monoculture condition, upregulated genes including FABP4, COL1A1, CAMP, and SDC2 were associated with pathways involved in lipid metabolism and extracellular matrix remodeling (Figure 4d, blue), consistent with previously reported metabolically active or matrix-interacting myeloid and microglial populations (Gosselin et al., 2017; Chia et al., 2025; He et al., 2025). Gene set enrichment further indicated increased representation of transcriptional programs related to cellular respiration, phospholipid biosynthesis and protein folding, consistent with previously described stress-adaptive metabolic states in microglia (Gosselin et al., 2017; Ulland et al., 2017; Figure 4e).
In contrast, microglia within the 3D co-culture system exhibited broader transcriptional diversity, with pronounced enrichment of immune and cell communication–related pathways. Upregulation of LYVE1, SERPINB2, HIC1, and FCGR3A pointed to elevated immune responsiveness, phagocytic activity and inflammatory signaling (Figure 4d, red). Expression of GFAP and PLA2G2C further suggested astrocyte activation and lipid-mediated intercellular signaling, reflecting ongoing neuron-astrocyte-microglia cross-talk. Together, these findings indicate that incorporating ReNcell VM–derived neural components create a more complex transcriptional environment, enhancing immune-related gene expression and intercellular communication compared with 3D monocultures (Figure 4f). Consistent with these environment-dependent transcriptional differences, we also observed model-specific expression of genes that have been previously implicated in neurodegenerative disease pathways, suggesting that distinct culture contexts may differentially engage transcriptional programs that are relevant to, but not specific for, disease-associated states (Supplementary Figure 5).
Benchmarking MDMi clusters against human and mouse microglial reference datasets
3.5
We next benchmarked cluster-specific gene signatures from 2D, 3D, and 3D co-culture MDMi against ten independent human microglial reference datasets compiled by Oldham et al. (2008), Miller et al. (2010), Hawrylycz et al. (2012), Darmanis et al. (2015), Wehrspaun et al. (2015), Zhang et al. (2016), Galatro et al. (2017), Gosselin et al. (2017), Patir et al. (2019), and Olah et al. (2020). These reference lists comprise genes annotated to core human microglial identity and to canonical microglial states, including interferon-responsive, chemokine-enriched, metabolic, proliferative and border-associated–like programs, as defined in prior single-cell studies (Grabert et al., 2016; Hammond et al., 2019; Masuda et al., 2019). Across all culture conditions, the largest overlap was consistently observed with the primary human microglia dataset from Olah et al., with cluster-level overlaps ranging from 139–483 genes in 2D, 133–597 genes in 3D and 252–557 genes in 3D co-culture (Supplementary Table 6).
Notably, 3D and 3D co-culture models showed both higher overlap and a broader distribution of overlapping genes across clusters compared with 2D cultures. In 3D MDMi, clusters 2 and 3 each overlapped with more than 500 microglial genes from Olah et al., whereas in 3D co-culture four clusters (1, 3, 4, and 5) overlapped with more than 430 genes. In contrast, 2D clusters showed more restricted overlap, with only clusters 2 and 3 exceeding 450 overlapping genes (Supplementary Tables 6, 7 and Supplementary Figure 6a). These results indicate that 3D-based models capture a larger fraction of established human microglial gene expression.
Given the high overlap with human microglial reference signatures, we next examined the expression of homeostatic and disease-associated microglia (DAM) genes across MDMi clusters (Supplementary Figures 6b–d), using the mouse DAM signature (Keren-Shaul et al., 2017) and recently reviewed (Fumagalli et al., 2025). Genes including HEXB, CST3, and C1QA/C1QB were broadly expressed across clusters in all three culture conditions, indicating stable microglial gene expression across models. By contrast, DAM-associated genes showed heterogeneous, cluster-restricted expression rather than uniform activation, with representative markers such as TREM2 and LPL varying between clusters and culture conditions. Overall, these data show that MDMi preserve key microglial features, and that more complex culture environments drive them into a wider range of microglia-like states that activate established human microglial gene programs.
Discussion
4
Microglia display remarkable heterogeneity shaped by developmental origin, regional cues, and environmental context (Yang et al., 2013; Dando et al., 2016, Grabert et al., 2016; De Biase et al., 2017; Ayata et al., 2018; Dubbelaar et al., 2018; Hammond et al., 2019; Marsh et al., 2022; Stogsdill et al., 2022; Yaqubi et al., 2023). To capture this complexity, in vitro models have evolved from 2D cultures to iPSC-derived microglia, 3D systems and 3D co-cultures that better reflect human microglial transcriptional signatures and behavior (Park et al., 2018; Liu et al., 2022; Stöberl et al., 2023; Tujula et al., 2025). Building on prior work and our development of patient-derived MDMi systems, this study shows that culture dimensionality and neural context profoundly influence microglial transcriptional profiles, even under homeostatic conditions (Ohgidani et al., 2014; Ryan et al., 2017; Sellgren et al., 2017; Park et al., 2023; Cuní-López et al., 2024; Gonul et al., 2025; Llaves-López et al., 2025; Risby-Jones et al., 2025).
In 2D systems, microglia were dominated by an IFN-responsive state (53.77%), characterized by elevated IFITM2 and IFITM3, markers of antiviral surveillance and innate immune priming (Diamond and Farzan, 2013; Zhou et al., 2013; Fensterl and Sen, 2015). The upregulation of IFITM3, a member of the microglial “sensome,” highlights its specialized role in sensing pathogen- and danger-associated molecular patterns (Hickman et al., 2013), and has also been shown to be upregulated in glial cells under AD-related neuroinflammation, supporting its role in mediating immune responses in disease contexts (Hur et al., 2020). The predominance of this state in 2D indicates that the cultures maintain microglia in a more uniform, immune-alert condition, likely reflecting the absence of native extracellular matrix (ECM) cues. In contrast, 3D and co-culture systems diversified the microglial landscape, generating metabolic and proliferative subtypes alongside chemokine-enriched populations. These findings suggest that 3D environments provide spatial and biochemical complexity required to support microglial transcriptional state diversity.
Chemokine-enriched microglia were consistently identified across models but exhibited distinct transcriptional features depending on culture context. In 2D cultures, these microglia expressed antiviral and immune-surveillance genes, whereas in 3D and co-culture systems they upregulated CCL4, CCL3, CCL7, and CSF1, consistent with enhanced inflammatory signaling, immune-cell recruitment and matrix interaction. These chemokines have been implicated in neuroinflammation through modulation of BBB integrity and immune cell trafficking (Estevao et al., 2021), highlighting the influence of the microenvironment on immune signaling pathways (Cherry et al., 2020).
Notably, 3D systems contained a higher proportion of metabolically active and proliferative microglia, characterized by increased mitochondrial and biosynthetic gene programs. Although metabolic variation among microglial subtypes remains underexplored, several studies support the influence of local cues on microglial energy-related transcriptional states. For instance, studies have shown that hippocampal and cerebellar microglia exhibit greater expression of metabolic genes than those in cortex and striatum, reflecting region-specific energy demands (Grabert et al., 2016). Similarly, microglia co-culture within human dorsal or ventral forebrain spheroids displays distinct metabolic pathway activity (Song et al., 2019; Zhang et al., 2023). Our findings therefore align with the broader literature indicating that 3D or multicellular contexts promote energy-demanding, adaptive transcriptional programs associated with increased metabolic activity.
Across all models, conserved microglial markers such as SELENOP, NUPR1, FOLR2, C1QA, F13A1, ALK, CCL13, CXCL12, C1QB, HS3ST2, and TMEM37 were consistently expressed, reaffirming their fundamental role in maintaining microglial identity. However, only the 3D and 3D co-culture conditions uniquely induce expression of cell-cell interactions and extracellular matrix components, including FCGBP and IGSF21, consistent with enhanced cell attachment, growth and differentiation in spatially structured systems (Baker and Chen, 2012; Hedegaard et al., 2020). The 3D co-culture model further distinguished itself by upregulating genes such as LYVE1, SERPINB2, and HIC1, indicative of active cross-talk with neighboring neural and glial cells. These results align with previous findings that 3D co-culture systems recapitulate key tissue-relevant features, including multicellularity and neuronal-glial interactions (Moysidou et al., 2021; Wareham and Calkins, 2025), reinforcing the physiological relevance of this model. Expression of genes such as LYVE1, CD163, and CD38 likely reflects the intrinsic plasticity of monocyte-derived microglia and the influence of complex 3D and co-culture environments, which are known to promote macrophage-like, reactive, or inflammatory transcriptional programs. Similar transcriptional states have been reported in in vitro microglial and macrophage models exposed to extracellular matrices or inflammatory cues (Wen et al., 2023).
Pseudotime trajectory analysis provided complementary evidence that culture dimensionality influences microglial transcriptional progression and state complexity (Cheng et al., 2023). Microglia in 2D cultures followed a largely linear trajectory consistent with a more constrained and uniform transcriptional profile, whereas 3D and co-culture conditions exhibited branching trajectories, indicating increased transcriptional diversity and alternative state transitions. These patterns are consistent with prior observations that microglial transcriptional states can progress through multiple transitional programs. In 3D, enrichment of genes associated with cytokine signaling, immune pathways and cellular motility was observed, while 3D co-cultures further showed increased representation of ERK1/2 signaling and bacterial recognition-related pathways. Collectively, these findings suggest that 3D monoculture and co-culture systems support more dynamic transcriptional state transitions, providing a framework for modeling context-dependent microglial adaptations observed in neurodegeneration or injury.
Together with prior work, our findings support the use of advanced human in vitro systems, particularly 3D and co-culture models, to capture key aspects of microglial biology that are poorly represented in simpler systems. Comparative studies have shown that human primary and iPSC-derived microglia exhibit more robust inflammatory and phagocytic responses than immortalized or murine models (Maguire et al., 2022; Woolf et al., 2025). Consistent with this, MDMi expressed canonical microglial markers absent in monocytes, supporting their utility as an accessible human platform for studying microglia-associated pathways.
Current gaps and outlook
4.1
The conclusions of this study apply specifically to monocyte-derived microglia-like cells, and differences in microglial developmental origin are likely to further shape transcriptional identity. While transcriptomic analyses are critical for defining cellular heterogeneity, complementary functional validation is required to link transcriptional diversity to biological outcomes. Functional assays, including phagocytosis, cytokine and chemokine secretion, oxidative stress responses and synaptic pruning, will be necessary to determine whether the microglial states identified here correspond to functionally distinct phenotypes. Integrating such phenotypic readouts with transcriptomic profiling will provide a more comprehensive understanding of microglial behavior across different culture environments. Consistent with this, prior studies have shown that gene expression profiles alone do not fully predict cellular function, underscoring the importance of correlating molecular signatures with functional outputs (Cakir et al., 2022).
The reference list from the paper itself. Each links out to its DOI / PubMed record.
- 1Ayata P. Badimon A. Strasburger H. Duff M. Montgomery S. Loh Y. (2018). Epigenetic regulation of brain region-specific microglia clearance activity. Nat. Neurosci. 21 1049–1060. 10.1038/s 41593-018-0192-3 30038282 PMC 6090564 · doi ↗ · pubmed ↗
- 2Baker B. Chen C. (2012). Deconstructing the third dimension: How 3D culture microenvironments alter cellular cues. J. Cell. Sci. 125 3015–3024. 10.1242/jcs.079509 22797912 PMC 3434846 · doi ↗ · pubmed ↗
- 3Cadiz M. Jensen T. Sens J. Zhu K. Song W. Zhang B. (2022). Culture shock: Microglial heterogeneity, activation, and disrupted single-cell microglial networks in vitro. Mol. Neurodegener. 17:26. 10.1186/s 13024-022-00531-1 35346293 PMC 8962153 · doi ↗ · pubmed ↗
- 4Cakir B. Kiral F. R. Park I.-H. (2022). Advanced in vitro models: Microglia in action. Neuron 110 3444–3457. 10.1016/j.neuron.2022.10.004 36327894 · doi ↗ · pubmed ↗
- 5Cakir B. Xiang Y. Tanaka Y. Kural M. Parent M. Kang Y. (2019). Engineering of human brain organoids with a functional vascular-like system. Nat. Methods 16 1169–1175. 10.1038/s 41592-019-0586-5 31591580 PMC 6918722 · doi ↗ · pubmed ↗
- 6Cheng S. Brenière-Letuffe D. Ahola V. Wong A. Keung H. Gurung B. (2023). Single-cell RNA sequencing reveals maturation trajectory in human pluripotent stem cell-derived cardiomyocytes in engineered tissues. i Science 26:106302. 10.1016/j.isci.2023.106302 36950112 PMC 10025988 · doi ↗ · pubmed ↗
- 7Cherry J. Meng G. Daley S. Xia W. Svirsky S. Alvarez V. (2020). CCL 2 is associated with microglia and macrophage recruitment in chronic traumatic encephalopathy. J. Neuroinflammation 17:370. 10.1186/s 12974-020-02036-4 33278887 PMC 7718711 · doi ↗ · pubmed ↗
- 8Chia S. Li M. Li Z. Tu H. Lee J. Qiu L. (2025). Single-nucleus transcriptomics reveals a distinct microglial state and increased MSR 1-mediated phagocytosis as common features across dementia subtypes. Genome Med. 17:92. 10.1186/s 13073-025-01519-4 40826098 PMC 12359983 · doi ↗ · pubmed ↗