Slc6a9 is distributed in glial cells and neurons across several nervous system regions, whereas Slc6a5 is more restricted to neurons in the caudal brain
Mikaela M. Ceder, Malin C. Lagerström

TL;DR
This study maps the distribution of two glycine transporter genes in mouse brains and peripheral organs, revealing differences in cell types and sex-related expression patterns.
Contribution
The study provides new insights into the spatial and sex-dependent expression patterns of Slc6a9 and Slc6a5 in the mouse nervous system.
Findings
Slc6a9 is broadly expressed in glial cells and neurons across multiple brain regions.
Slc6a5 is more restricted to neurons in the caudal brain.
Sex-dependent differences in expression were observed for both genes in various brain regions and organs.
Abstract
The glycinergic system constitutes a main source of inhibitory regulation in the central nervous system. Glycine transporters (GLYT1 and GLYT2), encoded by Slc6a9 and Slc6a5, respectively, are responsible for glycine reuptake and clearance from the synaptic cleft, thereby maintaining neurotransmitter homeostasis. Emerging evidence from pharmacological and mechanistic studies has highlighted GLYTs as promising therapeutic targets for psychiatric disorders and persistent pain. Nevertheless, data on anatomical and cellular distribution of GLYTs and sex-dependent differences in GLYT expression remain limited. To address this gap, the aim of this study was to examine the Slc6a9 and Slc6a5 mRNA expression across mouse brain regions and peripheral organs using three complementary approaches focusing on mRNA expression: re-analysis of single-cell RNA sequencing data, quantitative RT-PCR, and…
Genes, proteins, chemicals, diseases, species, mutations and cell lines named across the full text — each resolved to its canonical identifier and authoritative record.
Click any figure to enlarge with its caption.
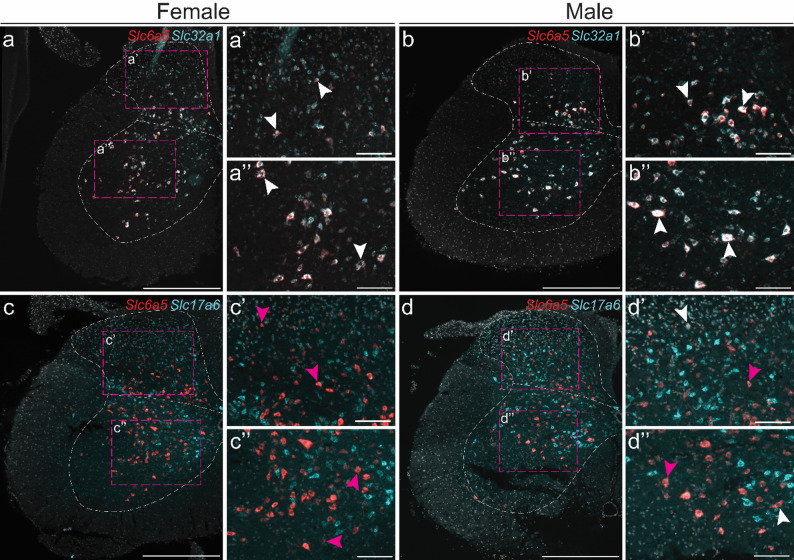 Figure 10
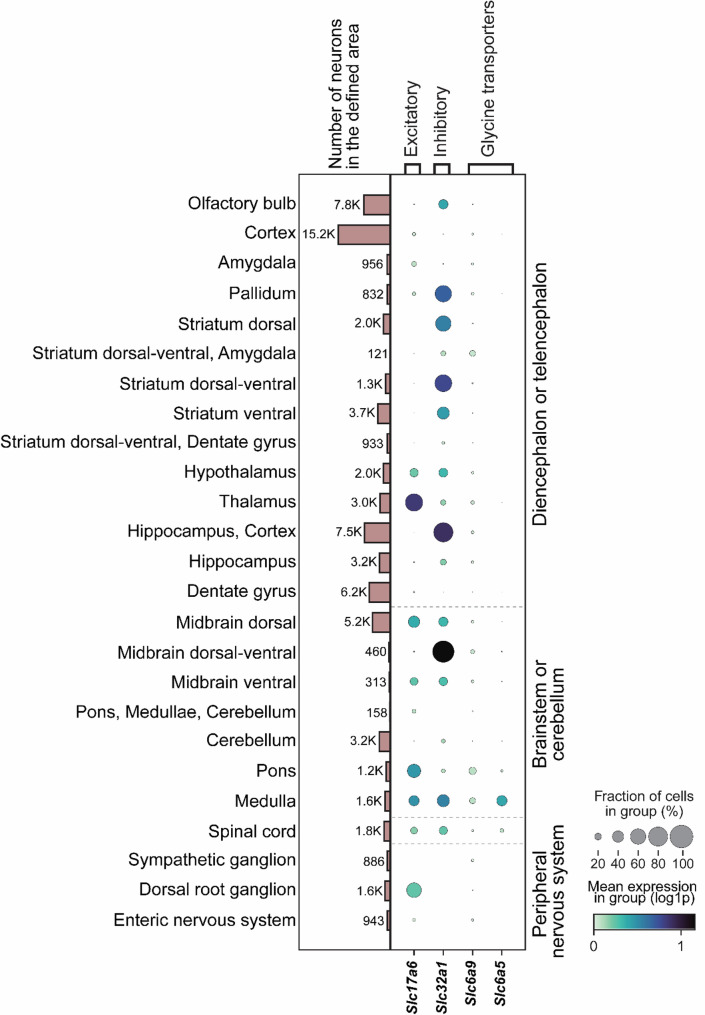 Figure 1
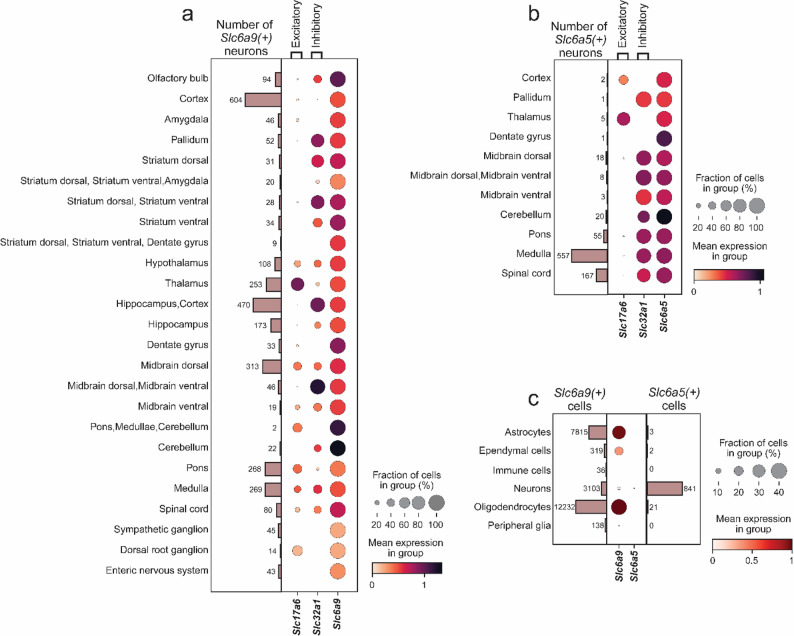 Figure 2
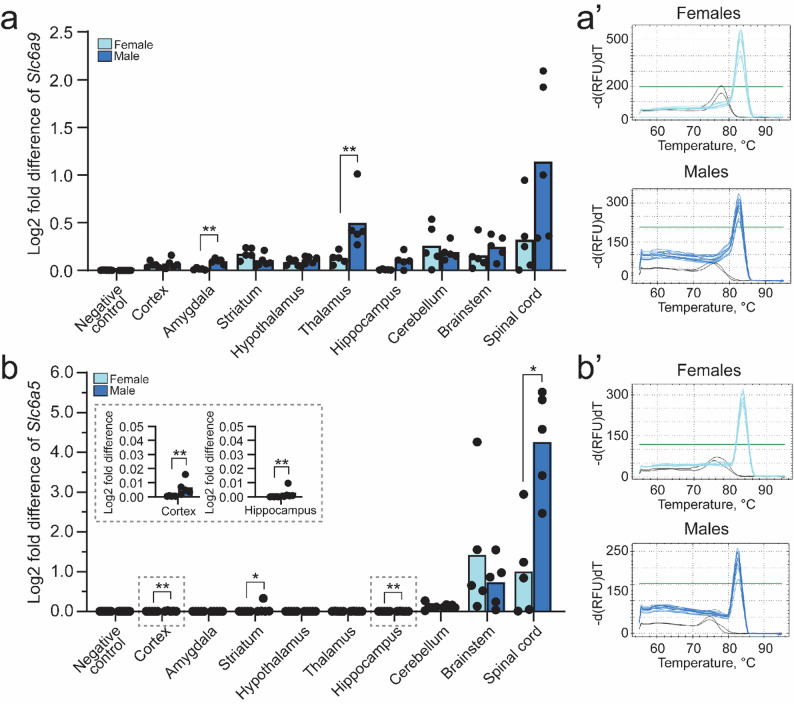 Figure 3
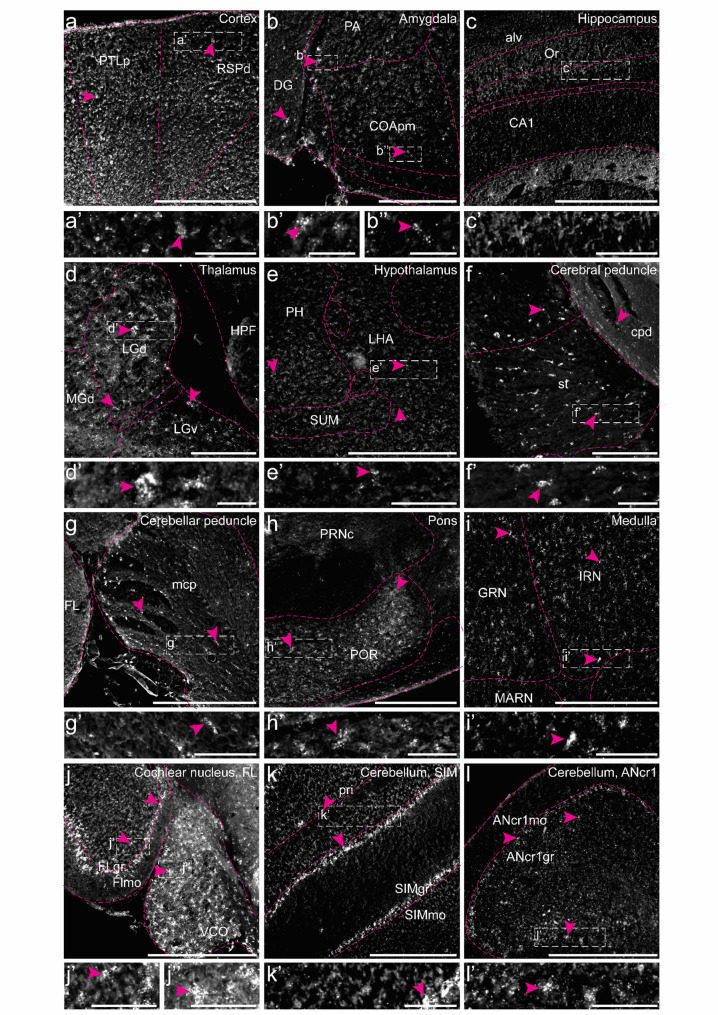 Figure 4
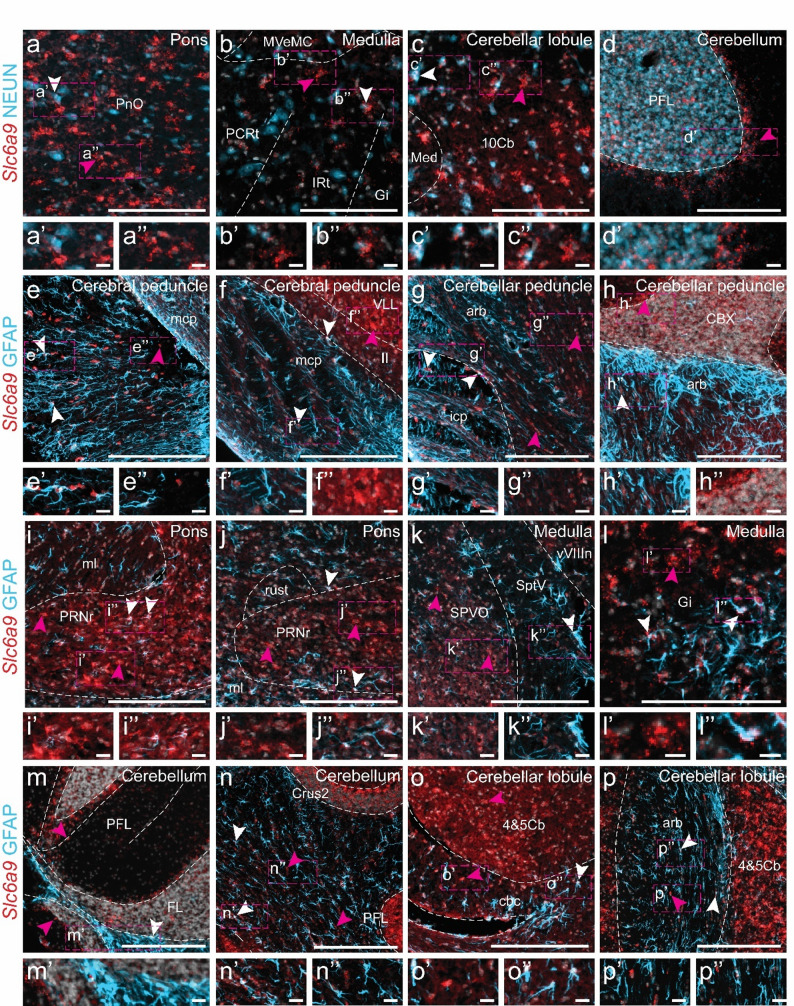 Figure 5
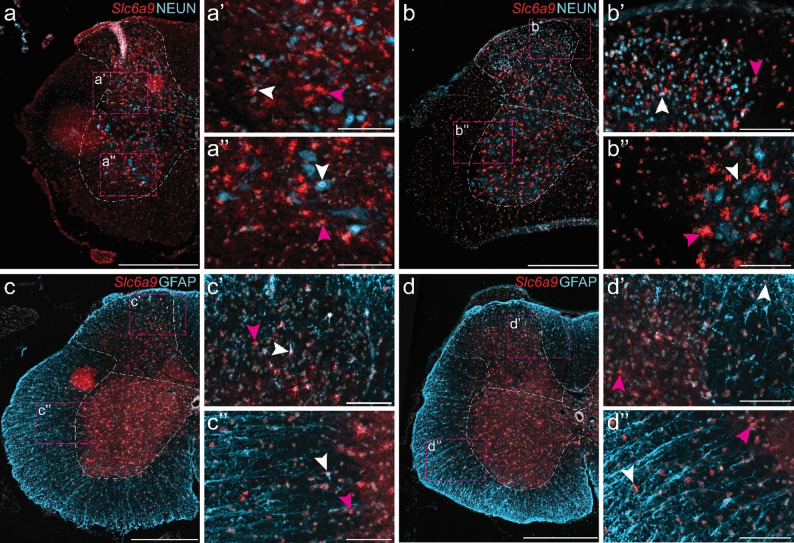 Figure 6
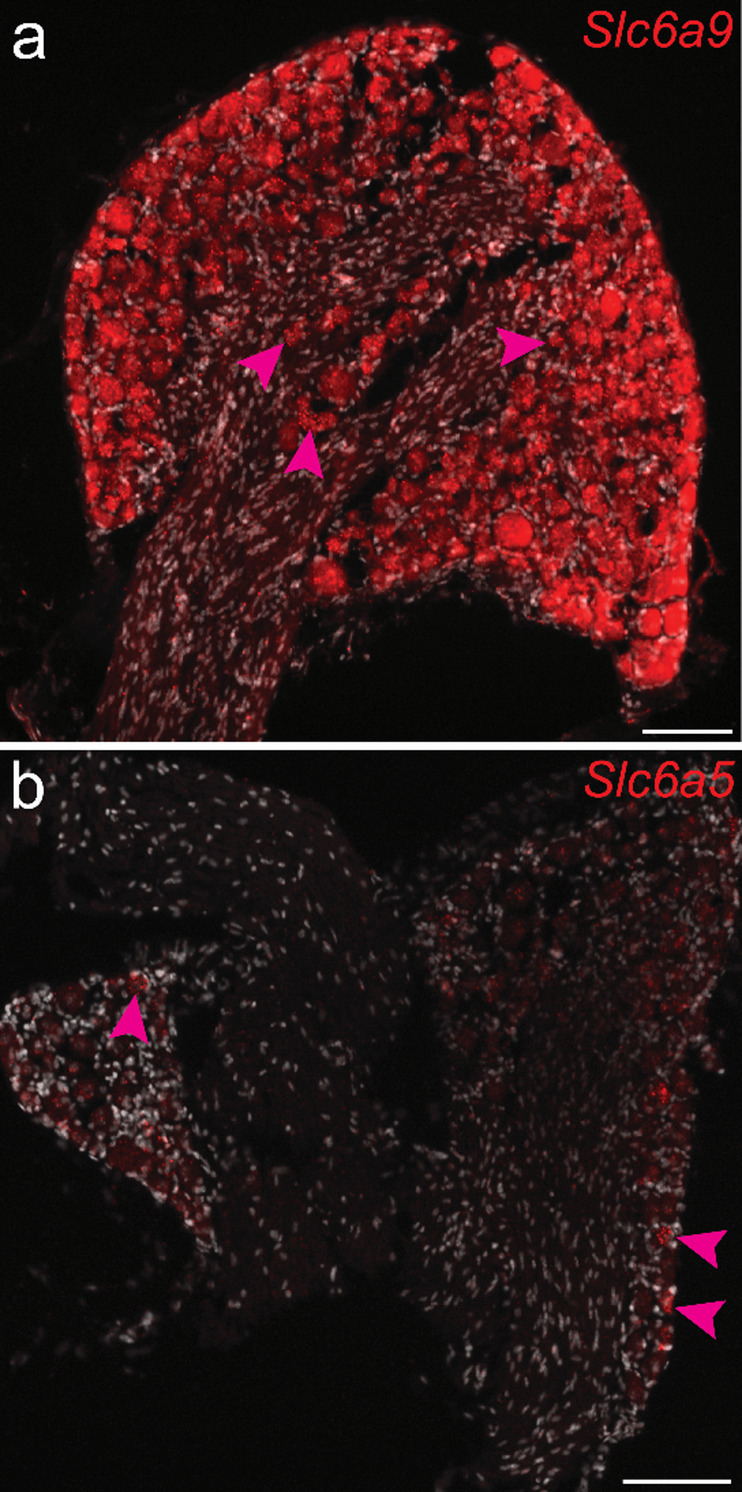 Figure 7
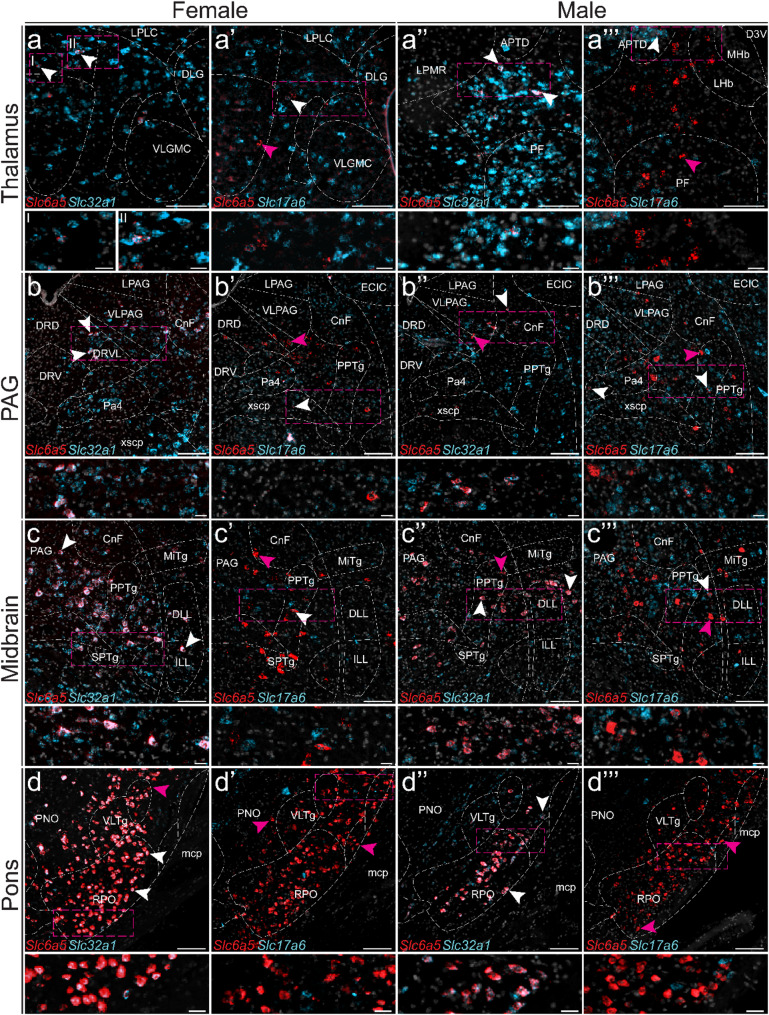 Figure 8
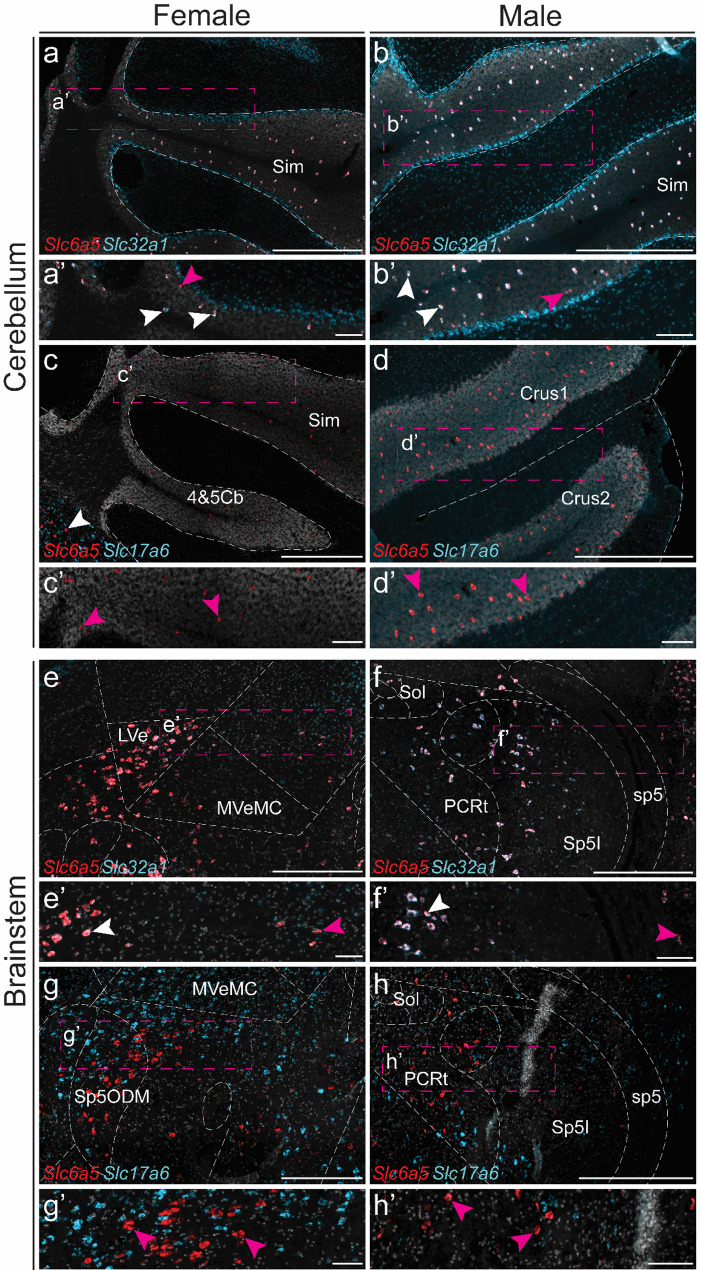 Figure 9
- —Uppsala University
Peer Reviews
No public reviews on file for this paper yet. If you reviewed it on a platform where reviews are public (OpenReview, ICLR, NeurIPS, ICML), you can paste yours below so the community can read it here.
Videos
No videos yet. Explain this paper in a talk, walkthrough, or lecture? Add one.
Taxonomy
TopicsNeuroscience and Neuropharmacology Research · Neurogenesis and neuroplasticity mechanisms · Amino Acid Enzymes and Metabolism
Introduction
The glycinergic system serves a dual role as both a major source of inhibitory signalling [1–3] and an essential excitatory modulator [4–7] in the central nervous system. Glycine is packaged into synaptic vesicles by the vesicular inhibitory amino acid transporter (VIAAT) [8], and released from presynaptic terminals following depolarization. Upon release, glycine binds to chloride-permeable pentameric ligand-gated ion channels, leading to hyperpolarization of the postsynaptic neuron [1–3]. Furthermore, in brain regions like the cortex and hippocampus, glycine acts as a N-methyl-D-aspartate (NMDA) receptor co-agonists, where it is required alongside glutamate to enable e.g., excitatory neurotransmission and synaptic plasticity [4–7]. Reuptake and clearance from the synaptic cleft are subsequently mediated by glycine transporters (GLYT1 and GLYT2), ensuring neurotransmitter homeostasis [9, 10]. Together, these mechanisms enable complex processes such as motor and sensory functions [11–13], as well as learning and memory formation [13–16].
The GLYTs belong to the sodium- and chloride-dependent neurotransmitter transporter (SLC6) family of solute carriers [17] and are broadly conserved across vertebrates [18]. GLYT1, later designated as Slc6a9, was first identified and characterized in mice in the early 1990s [19]. In humans, GLYT1 has been associated with essential hypertension [20], and adolescent idiopathic scoliosis [21], while genetic knockout of GLYT1 in mice leads to lethality within 12 h of birth [22]. Furthermore, mutations in the GLYT1 gene results in Glycine transporter 1 encephalopathy, identified by startle-like responses, respiratory failure and severe hypotonia during early infancy [23]. Polymorphisms of SLC6A9 have been associated with psychiatric disorders such as schizophrenia and major depressive disorder [24–27], showcasing that the glycine signalling has other key functions beyond its role in hyperpolarization in the central nervous system. GLYT1 is predominantly expressed in glia cells, and in the brain, SLC6A9 is distributed across multiple regions, including the cerebral cortex, olfactory bulb, hippocampal formation, basal ganglia, thalamus, hypothalamus, midbrain, pons, medulla oblongata, cerebellum, pituitary gland, retina and white matter in humans, pigs, and mice [28], as well as in the developing mouse spinal cord [29]. These expression patterns are largely consistent with the mapping of Slc6a9 mRNA expression generated by the Allen Brain Institute (https://mousespinal.brain-map.org/imageseries/show.html?id=100069899, https://mouse.brain-map.org/gene/show/14440) [30, 31].
GLYT2 was first identified in rodents in 1993 and is abundantly expressed in caudal regions of the brain and the spinal cord [32]. Knockout of GLYT2 in mice, resulting in reduced glycine transport in the brainstem and spinal cord, produces a lethal phenotype similar to human hyperekplexia [33]. In mice, Slc6a5 expression is prominent in the cerebellum, pons, medulla oblongata and spinal cord (https://mousespinal.brain-map.org/imageseries/detail/100024105.html, https://mouse.brain-map.org/gene/show/68410) [30, 31], as well as the pontine reticular formation and periaqueductal grey (PAG) [20, 21], with lower levels detected in the midbrain [28, 29]. Moreover, pharmacological inhibition of GLYT2 have been demonstrated to ameliorate mechanical allodynia [34]. Emerging evidence from studies on transport mechanisms, cellular pathways, and pharmacological interventions, particularly in psychiatric disorders and chronic pain, highlights the importance of GLYTs as potential therapeutic targets, where GLYT1 and GLYT2 inhibitors would potentiate the modulatory role of glycine in these neuronal circuits [35–37]. Despite this, data on sex-dependent differences in GLYT expression remains scarce. Considering the well-established sex differences in psychiatric disorders and pain [38–41], understanding these variations could aid the prediction of adverse effects. To address this gap, we investigated the mRNA expression of Slc6a9 and Slc6a5 across the mouse nervous system and peripheral organs using different complementary mRNA-based approaches: re-analysis of a single-cell RNA sequencing (scRNA-seq) dataset [42], quantitative RT-PCR (qRT-PCR), and RNAscope. Furthermore, sex-dependent differences in mRNA expression were assessed using qRT-PCR.
Methods
Pre-processing of Zeisel et al. (2018) single-cell RNA sequencing dataset
The expression of Slc17a6 (vesicular glutamate transporter 2), Slc32a1 (vesicular inhibitory amino acid transporter), Slc6a9 and Slc6a5 in neurons in the nervous system was analysed using the scRNA-seq ‘15all.loom’ dataset [42], obtained from http://linnarssonlab.org/ as previously described [43, 44]. The original Zeisel et al. dataset comprises expression profiles of 27,998 genes across 160,796 single cells derived from wild-type outbred strains CD-1 (Charles River) and Swiss (Janvier), as well as Vgat-Cre; tdTomato mice to target inhibitory neurons, and Wnt1-Cre; R26Tomato mice to isolate neurons from the peripheral and enteric nervous systems [42]. Data analysis was performed using SCANPY 1.9.1 [45] in Python 3.8.8, with the full code detailed in https://github.com/HannahMWeman/glra3-expression-analysis-in-the-nervous-system [43, 44, 46]. To assess the expression of Slc6a9 and Slc6a5 in glial cells, as well as investigating Slc6a9 or Slc6a5 co-expressing both Slc17a6 and Slc32a1 (triple positive cells), the code can be found at https://github.com/MikaelaCeder/analysis-glycine-transporter-expression.ipynb. The prevalence of Slc6a5 and Slc6a9 expression (defined as log1p > 0.1) was calculated for each nervous system region as described in [43]. Furthermore, the expression patterns of Slc17a6 and Slc32a1, well-established markers for excitatory and inhibitory neurons [47, 48], respectively, were examined in all Slc6a5- and Slc6a9-positive neurons (833 and 3,076 neurons, respectively) across the different nervous system regions using visualization and occurrence-based analyses.
Animals
All animal procedures were approved by the regional animal research ethics committee (Uppsala djurförsöksetiska nämnd) and conducted in accordance with the Swedish Animal Welfare Act (SFS 2018:1192), the Swedish Animal Welfare Ordinance (SFS 2019:66), and the Regulations and General Advice for Laboratory Animals (SJVFS 2019:9, Saknr L 150) (permit numbers C419/12, C39/16, and 5.8.18–01428/2023). Reporting followed the ARRIVE guidelines 2.0 Essential 10, where applicable. Both female and male C57BL/6J mice (Taconic, Denmark) were included in the study. Mice were housed with littermates in individually ventilated cages (floor area ~ 501 cm²; maximum five mice per cage) containing bedding and environmental enrichment. Housing conditions were maintained at 20–24 °C with 45–65% humidity under a 12-h light/dark cycle (lights on at 06:00). Food (diet pellets, Ssniff, Sweden) and tap water were provided ad libitum. All procedures were designed to minimize stress, and euthanasia was performed during the light phase.
Quantitative RT-PCR
Tissues from five adult male C57BL/6J mice (10–14 weeks) were previously collected and processed as described in [49, 50]. In addition, tissues from five adult females (14 weeks) and five adult males (10–11 weeks) were collected, prepared, and analysed according to [43]. In short, the C57BL/6J mice were euthanized via cervical dislocation, without prior treatment, during the light period. Total RNA was isolated using the Absolutely RNA Mini Kit (Qiagen, Germany) and converted to cDNA with the High-Capacity RNA-to-cDNA Kit (Applied Biosystems, Invitrogen, USA), following the protocols outlined in [43].
Primers were designed using the ThermoFisher Scientific primer design tool, which is based on the Primer3 algorithm [51] or Beacon Design 8 (Premier Biosoft) for the reference genes Actb, Rpl19, Cyclo and Gapdh. All primer sequences were subsequently screened using BLAST and global alignment analyses [52] to minimize the risk of non-specific amplification. Slc6a5 forward 5′-tgcggccactcagattttct-3′, reverse 5′-tgttgactttgcgctcgttg-3′; Slc6a9 forward 5′-tgaccaccactgctcatgtc-3′, reverse 5′-agattttcctgggcagaggc-3′. Reference housekeeping genes: actin-related protein 1B (Actb) forward 5′-ccttcttgggtatggaatcctgtg-3′, reverse 5′-cagcactgtgttggcatagagg-3′; ribosomal protein L19 (Rpl19) forward 5′-aatcgccaatgccaactc-3′, reverse 5′-ggaatggacagtcacagg-3′; Peptidylprolyl isomerase A (Cyclo) forward 5′-tttgggaaggtgaaagaagg-3′, reverse 5′-acagaaggaatggtttgatgg-3′ and glyceraldehyde-3-phosphate dehydrogenase (Gapdh) forward 5′-gccttccgtgttcctacc-3′, reverse 5′-gcctgcttcaccaccttc-3.
Expression of Slc6a5 and Slc6a9 was quantified using qRT-PCR in a final reaction volume of 20 µl, as previously described [43, 44]. Reactions were performed on an iCycler real-time detection system (Bio-Rad, USA) under the following cycling conditions: initial denaturation at 95 °C for 30 s, followed by 45 cycles of 95 °C for 10 s, annealing at 55 °C for reference genes, 56 °C for Slc6a5, or 62 °C for Slc6a9 for 30 s, and extension at 72 °C for 30 s. Melting curve analysis was conducted by increasing the temperature from 55 to 95 °C in 0.5 °C increments with a 10 s dwell time and plate read at each step. All reactions were run in triplicate, with a negative control included on each plate. Cycle threshold (Ct) values were obtained using CFX Maestro software (Bio-Rad, USA), and primer efficiencies were calculated with LinRegPCR.
In situ hybridization and imaging
Tissue from four C57BL/6J mice (two females and two males, 10–14 weeks old) was prepared as described in [43, 44]. In short, the C57BL/6J mice were intraperitoneally injected with 0.2 to 0.3 ml (1:1) Ketamine (Ketalar, 50 mg/ml, Pfizer, Sweden) and Medetomidine (Domitor, 1 mg/ml, Orion Pharma, Sweden) and subsequently perfused with autoclaved ice-cold 1 × PBS. To minimize the risk of contamination and altered gene expression, the following steps were performed as quickly as possible in autoclaved ice-cold 1 × PBS; the whole brains and all divisions of the spinal cord were dissected and cleaned from meninges, followed by embedding in optimal cutting temperature (OCT) medium (Bio-Optica, Italy) and snap-frozen on dry ice in -80 °C isopentane (Sigma-Aldrich, Germany). Sections for female and male mice were chosen from anatomically matched regions, but minor differences in sectioning angle or tissue curvature might lead to slight visual shifts.
Fluorescent in situ hybridization was performed to detect the expression of Slc6a5 in combination with Slc17a6 and Slc32a1, or Slc6a9 in brain and spinal cord using the RNAscope Fluorescent Multiplex kit (cat. #323270, ACD, USA), following ACD guidelines for formaldehyde-fixed and frozen tissues and as described in [44]. The following probes were used: Slc6a5 (409741-C3), Slc6a9 (525151-C1), Slc17a6 (319171-C2), and Slc32a1 (319191-C2).
RNAscope was also combined with immunohistochemistry on a set of slides. Briefly, FISH was performed as above, except the protease IV step was limited to 5 min, and antigen retrieval was carried out according to ACD guidelines. Slides were blocked in Supermix (0.25% gelatine and 0.5% Triton X-100 in 1× PBS) for 1 h, then incubated with primary antibodies for 24–48 h at 4 °C. Secondary antibodies were applied in Supermix with 200 nM/ml DAPI for 2 h at room temperature (NEUN: donkey anti-mouse 647, Invitrogen A31571, 1:200; GFAP: donkey anti-rabbit 647, Invitrogen A31573, 1:200). Sections were washed three times with 1× PBST (0.1% Tween-20 in 1× PBS), embedded in Anti-Fade Fluorescence Mounting Medium (Abcam), and covered with glass slides (Menzel-Gläser). Slides were dried at 4 °C and stored at this temperature until imaging. Primary antibodies included NEUN (Millipore, MAB377) and GFAP (Cell Signaling Technology, D1F4Q).
Images of RNAscope-treated sections were acquired at 20× magnification using an Axio Imager.Z2 microscope (Zeiss, Germany) and Zeiss ZEN 3.3 (blue edition) software. Whole-section images were collected as tiled scans in the following channels: DAPI (50 ms), FITC (200 ms for Slc17a6 and Slc32a1; 500 ms for NEUN and GFAP), and Cy5 (500 ms). Image processing for figure representation was performed in ZEN 3.3, with targeted brain structures and outline of brain areas and nuclei identified using the Allen Mouse Brain Atlas (mouse.brain-map.org/experiment/thumbnails/100048576?image_type=atlas). Outlines in figures are approximations for guidance. All images were converted to colour-blindness-friendly pseudo-colours using ZEN 3.3 software.
Data handling and statistics
qRT-PCR: Melting curves were compared with negative controls to confirm amplification of a single product. Normalized and relative mRNA expression of Slc6a5 and Slc6a9 was calculated using the delta Ct method for multiple reference genes [53], with primer efficiency differences accounted for. Replicates requiring > 45 cycles for amplification and biological outliers were manually excluded prior to data visualization. Outliers were identified using the Grubbs test (α = 0.05) in GraphPad Prism version 10.0.4. Outliers are specified in the figure legends.
Log₂ fold differences were calculated using Actb as the calibrator and presented in combined scatter-bar plots (mean log₂ difference relative to Actb). Normality of qRT-PCR values for female and male mice was assessed using the Shapiro–Wilk test. Expressional differences relative to negative controls were evaluated using the Kruskal–Wallis and Mann–Whitney U tests. Sex-dependent differences for each tissue and primer were analysed using two-tailed Mann–Whitney U or unpaired t-tests, with and without outliers. Statistical significance was set at p < 0.05. All analyses were performed in GraphPad Prism version 10.0.4.
RNAscope: Images were processed for figure representation using Zeiss ZEN 3.3 (blue edition). Targeted brain structures were identified and outlined with reference to the Allen Mouse Brain Atlas (https://mouse.brain-map.org/experiment/thumbnails/100048576?image_type=atlas). All images were converted to colour-blindness-friendly pseudo-colours in ZEN 3.3. Quantification was performed using the Fiji Cell Counter plug-in [54], criterion for positive cells was ≥ 5 dots within the same cell.
Results
Slc6a9 is broadly expressed in both excitatory and inhibitory neurons in the nervous system, while Slc6a5 displays a more limited distribution
Both Slc6a9 and Slc6a5 exhibited lower expression than the reference markers Slc17a6 (excitatory neurons) and Slc32a1 (inhibitory neurons) (Figs. 1 and 2a and b). While GLYT1 has traditionally been considered glial [55], re-analysis of the Zeisel et al. (2018) dataset [42] identified Slc6a9-expressing neurons throughout the nervous system (Fig. 1), as well as in glial cells (Fig. 2c). Occurrences exceeding 10% were observed in the dorsal–ventral striatum, amygdala, dorsal–ventral midbrain, medulla, and pons (Fig. 1; Table 1), while Slc6a9 expression was present across all regions (Table 1). Slc6a5 expression was comparatively low, with occurrence exceeding 1% in the dorsal–ventral midbrain, cerebellum, pons, medulla, and spinal cord (Table 1). Notably, most regions annotated in the Zeisel et al. (2018) dataset [42] did not express Slc6a5 (Fig. 1; Table 1).
Fig. 1Slc6a9 is broadly expressed in both excitatory and inhibitory neurons in the nervous system, while Slc6a5 displays a more limited distribution. *Slc6a9 *and Slc6a5 expression was analysed in relation to the reference markers Slc17a6 (vesicular glutamate transporter) and Slc32a1 (vesicular inhibitory amino acid transporter) across defined regions of the central and peripheral nervous system in the Zeisel et al. (2018) dataset [42]. The dot plot illustrates expression patterns of the targeted genes in neurons within the annotated regions. Both Slc6a9 and Slc6a5 showed lower occurrence relative to Slc17a6 and Slc32a1. Slc6a9 was detected in all examined regions with varying prevalence, while Slc6a5-positive neurons were limited to the cortex, pallidum, thalamus, dentate gyrus, midbrain, cerebellum, pons, medulla, and spinal cord. Expression was defined as log1p > 0.1
Table 1. Regional occurrence of Slc6a9 and Slc6a5 expression across nervous system regions annotated in the single-cell RNA sequencing dataset from Zeisel et al. (2018) [42]. Genes were considered expressed if log1p > 0.1. ND = not detected; NaN = not a numberNervous system areaTotal number of cellsNumber of Slc6a9- expressing cellsRelative abundance of Slc6a9 expression in area (%)Number of Slc6a5- expressing cellsRelative abundance of Slc6a5 expression in area (%)Olfactory bulb7763941.21NDNaNCortex15,2056043.9720.01Amygdala956464.81NDNaNPallidum832526.2510.12Striatum dorsal1962311.58NDNaNStriatum dorsal–ventral, Amygdala1212016.53NDNaNStriatum dorsal–ventral1332282.10NDNaNStriatum ventral3676340.93NDNaNStriatum dorsal–ventral, Dentate gyrus93390.97NDNaNHypothalamus19811085.45NDNaNThalamus30292538.3550.17Hippocampus, Cortex75074706.26NDNaNHippocampus32101735.39NDNaNDentate gyrus6177330.5310.02Midbrain dorsal52043136.02180.35Midbrain dorsal–ventral4604610.0081.74Midbrain ventral313196.0730.96Pons, Medullae, Cerebellum15821.27NDNaNCerebellum3240220.68200.62Pons119626822.41554.60Medulla156626917.1855635.50Spinal Cord1790804.471679.33Sympathetic ganglion886455.08NDNaNDorsal root ganglion1580140.89NDNaNEnteric nervous system943434.56NDNaN Interestingly, neurons expressing Slc6a9 or Slc6a5 co-expressed Slc17a6 or Slc32a1 within the same nervous system regions (Fig. 2a, b). In most areas examined, and where prevalent, both Slc6a9 and Slc6a5 co-localized with Slc32a1 (Fig. 2a, b), indicating that glycine transporters are predominantly associated with inhibitory neurons, consistent with the role of Slc32a1 in packaging glycine into synaptic vesicles. However, comparable proportions of Slc6a9 were observed in excitatory and inhibitory neurons within the hypothalamus, midbrain, medulla, and spinal cord. Furthermore, Slc6a9 primarily co-localized with the excitatory marker Slc17a6 in the thalamus, pons, and dorsal root ganglion (DRG) (Fig. 2a). A similar pattern was observed for thalamic neurons in the Slc6a5 analysis (Fig. 2b), suggesting that glycine transporter-positive neurons in this region are largely excitatory. Apart from these exceptions, Slc6a5 was primarily co-expressed with Slc32a1 (Fig. 2b). However, a total of 19 neurons out of 3,076 were found to co-express Slc6a9, Slc17a6 and Slc32a1 in medulla (3 neurons), pallidum (1 neuron), spinal cord (1 neuron), midbrain (7 neurons), hypothalamus (2 neurons), thalamus (4 neurons) and cortex (1 neuron), and a total of 8 neurons out of 833 were found to co-express Slc6a5, Slc17a6 and Slc32a1 in medulla.
In addition, the occurrence of both glycine transporters was examined in the sequencing dataset focusing on the different cell categories of the nervous system annotated by Zeisel et al. (2018) [42]. Slc6a9 mRNA expression was found to occur in astrocytes (32%), ependymal cells (17%), oligodendrocytes (39%), central nervous system immune cells (i.e., microglia, 0.5%) and peripheral glia (1.2%), while the same occurrence in neurons was 4% (Fig. 2c, Additional file 1: Fig. S1a). Interestingly, Slc6a5 was found exclusively in neurons (1%), while the occurrence in glial cells was 0.1% or lower (ependymal cells 0.1%, oligodendrocytes 0.06%, astrocytes 0.01%, peripheral glia and central nervous system immune cells 0%) (Additional file 1: Fig S1b). To further validate the expression in glial cells, the co-occurrence of Slc6a9 or Slc6a5 with Gfap (astrocytic marker [56, 57]), Mbp (oligodendrocyte marker [58, 59]) and Foxj1 (ependymal cell marker [60, 61]) was analysed in the cerebellum and spinal cord (Additional file 1: Fig. S1c, d). These two regions were chosen because of a high occurrence of glial cells and the criterion of the code was to plot brain regions with more than five glial cells expressing one of the glycine transporters. Slc6a9 was found to primarily co-express Mbp and Gfap in the cerebellum (Additional file 1: Fig. S1c), while in the spinal cord, Slc6a9 was found to primarily co-express Foxj1 and Mbp (Additional file 1: Fig S1d). On the other hand, Slc6a5 was found to have minimum overlap with the glial markers in both the cerebellum and spinal cord (Additional file 1: Fig. S1c, d).
Taken together, these findings demonstrate that Slc6a9 and Slc6a5 are expressed in central nervous system neurons, with Slc6a9 being more prevalent throughout the nervous system areas, as well as in glial cells. Notably, both transporters are present in subsets of excitatory and inhibitory neurons.
Fig. 2Slc6a9-expressing neurons exhibit both excitatory and inhibitory molecular characteristics across several nervous system regions, whereas Slc6a5-expressing neurons are primarily inhibitory. Dot plots illustrate the occurrence of Slc6a9-expressing neurons and Slc6a5-expressing neurons, along with their co-expression with Slc17a6 and Slc32a1 across nervous system regions. (a) Slc6a9 was detected in both excitatory and inhibitory neurons, with some regions showing exclusively excitatory or inhibitory Slc6a9 neurons, while others included both types. (b) Slc6a5 occurred in excitatory and inhibitory neurons; however, in all regions except the cortex and thalamus, the majority of Slc6a5-positive cells co-expressed Slc32a1. c) Dot plots illustrate the occurrence of Slc6a9 and Slc6a5 in astrocytes, ependymal cells, CNS immune cells, neurons, oligodendrocytes and peripheral glia. Expression was defined as log1p > 0.1
Sex-dependent differences in mRNA expression of Slc6a9 and Slc6a5 were detected using qRT-PCR
Re-analysis of the single-cell dataset revealed abundant Slc6a9 expression and a more restricted Slc6a5 expression in the central and peripheral nervous system. The Zeisel et al. (2018) dataset [42], however, comprises pooled neurons from female and male mice, preventing the identification of sex-dependent differences. To address this, bulk tissue samples were collected from both female and male mice, and analysed by qRT-PCR to evaluate sex-dependent variation in gene expression.
Overall, Slc6a9 and Slc6a5 showed low expression in bulk tissue samples from the nervous system and peripheral organs (Fig. 3, Additional file 1: Fig. S2). However, all amplified samples exhibited a single melting peak with identical melting temperatures (Fig. 3a’–d’), confirming the reliability of the qRT-PCR results. To assess gene expression in specific tissues, comparisons were made with negative controls (Additional file 1: Table S1). For Slc6a9, expression was detectable above background levels in the striatum, hypothalamus, thalamus, cerebellum, brainstem, and spinal cord of female mice, whereas in male mice it was observed only in the thalamus, cerebellum, brainstem, and spinal cord. This pattern suggests a more caudal distribution compared with the single-cell analysis (Fig. 1). Consistent with the single-cell data, Slc6a5 expression was detectable above background levels in the brainstem and spinal cord of females, and in the striatum, cerebellum, brainstem, and spinal cord of males. Regarding visceral organs, Slc6a9 expression was observed in the thymus, lung, and spleen of female mice, but restricted to the liver in males (Additional file 1: Fig. S2). By contrast, Slc6a5 expression was not detectable above background levels in any of the internal organs examined (Additional file 1: Table S1).
When normalized relative Ct values were compared across central nervous system regions, sex-dependent differences were observed for Slc6a9 in the amygdala (p = 0.0079) and thalamus (p = 0.0079) (Fig. 3a), and for Slc6a5 in the cortex (p = 0.0079), hippocampus (p = 0.0079), striatum (p = 0.0317), and spinal cord (p = 0.0159) (Fig. 3b), with males consistently exhibiting higher expression levels than females. When comparing the normalized relative Ct values of Slc6a9 and Slc6a5 in relation to Actb, the analyses revealed that Slc6a5 expression in the spinal cord was nearly fourfold higher than Slc6a9 in males, but only twofold higher in females (Fig. 3a, b). In contrast, higher Slc6a5 expression relative to Slc6a9 was observed in the brainstem of females, suggesting sex-dependent differences in glycine transporter expression patterns in caudal brain regions.
In peripheral organs, higher Slc6a9 expression was observed in males in liver (p = 0.0079 without outlier; p = 0.0119 with outlier), intestine (p = 0.0159 without outlier; p = 0.0079 with outlier), spleen (p = 0.0179 without outlier; p = 0.0117 with outlier), and kidney (p = 0.0079 with and without outlier), whereas lower expression was detected in genitalia compared with females (Additional file 1: Fig. S2a). No sex-dependent differences in Slc6a9 were observed in the thymus or lung.
Although Slc6a5 expression could not be distinguished from negative controls in internal organs, sex-dependent differences were still detected in the thymus (p = 0.0952 without outlier; p = 0.0079 with outlier), lung (p = 0.0357 without outlier; p = 0.0079 with outlier), and intestine (p = 0.0159 without outlier; p = 0.0079 with outlier) (Additional file 1: Fig. S2b).
Taken together, qRT-PCR analyses revealed sex-dependent differences in the expression of the glycine transporters Slc6a9 and Slc6a5. In the central nervous system, higher expression was generally observed in males, with Slc6a9 differences detected in the amygdala and thalamus, and Slc6a5 differences in the cortex, hippocampus, striatum, and spinal cord. Slc6a5 expression was found to be markedly higher than Slc6a9 in the spinal cord, whereas relatively higher Slc6a5 expression was observed in the brainstem of females. In peripheral organs, Slc6a9 was broadly expressed and exhibited sex-dependent variation, whereas Slc6a5 expression was largely undetectable but still showed measurable sex differences in the thymus, lung, and intestine. Overall, Slc6a9 was more widely distributed than Slc6a5, and both transporters displayed distinct sex-dependent expression patterns.
Fig. 3 Sex-dependent differences in mRNA expression of Slc6a9 and Slc6a5 could be detected using qRT-PCR. Expression of Slc6a9 and Slc6a5 in adult female (n = 5) and adult male (n = 5) C57BL/6J mice were observed using qRT-PCR, with a cut-off of 45 cycles. Relative mRNA expression was calculated using the delta Ct method with three stable reference genes (Cyclo, Rpl19, Gapdh) and Actb was used as the calibrator. Stable reference genes were identified using the GeNorm protocol [53]. No biological outliers were identified for nervous system tissue samples using the Grubbs outlier test with α = 0.05 prior to analysis. The Log_2_ fold mean difference, with individual dots representing individual mice relative to Actb expression, is illustrated in the combined scatter-bar plot. Normality was assessed using the Shapiro-Wilk test. Difference between female and male mice for each tissue were calculated using a two-tailed Mann–Whitney U-test, where *p < 0.05, **p < 0.01. (a) Slc6a9 expression in central nervous system tissues of females and males, with differences in each region as follows: cortex (p = 0.6905), amygdala (p = 0.0079), striatum (p = 0.0952), hypothalamus (p = 0.2222), thalamus (p = 0.0079), hippocampus (p = 0.1508), cerebellum (p = 0.8413), brainstem (p = 0.4206), and spinal cord (p = 0.0556). (b) Slc6a5 expression in central nervous system tissues of females and males, with differences in each regions investigated. An enlargement with appropriate y-axis scaling is shown for the cortex and the hippocampus in the dashed box: cortex (p = 0.0079), amygdala (p = 0.1508), striatum (p = 0.0317), hypothalamus (p = 0.5476), thalamus (p = 0.1508), hippocampus (p = 0.0079), cerebellum (p = 0.6905), brainstem (p = 0.6905), and spinal cord (p = 0.0159). Representative melt peak images for females (light blue), males (blue) and negative controls (black) are shown in panels a’–b’
Histological analysis revealed that Slc6a9 is distributed throughout the central nervous system, predominantly in glial fibrillary acidic protein (GFAP)-positive cells
Slc6a9 has primarily been reported as expressed in glial cells located near glycinergic neurons [55, 62] and is known to be present in the cortex, hippocampus, brainstem, and spinal cord [55, 63]. However, re-analysis using scRNA-seq and qRT-PCR revealed that mRNA expression of this transporter occurs throughout the central nervous system, prompting further investigation of its spatial distribution. RNAscope confirmed that Slc6a9 was expressed in multiple brain regions in mice (Fig. 4). Specifically, Slc6a9-positive cells were detected in the grey matter of the cortex, amygdala, thalamus, hypothalamus, brainstem, and cerebellum (Fig. 4a–l) in both female and male mice. No expression was observed in the Cornu Ammonis (CA) of the hippocampus (Fig. 4f); however, Slc6a9 was detected in the dentate gyrus (Fig. 4g). In addition, Slc6a9-expressing cells were present in the cerebral and cerebellar peduncles (Fig. 4f, g). Fig. 4Histological analysis of Slc6a9 expression in the adult mouse brain using RNAscope. Expression was examined in the (a) cortex, (b) amygdala, (c) hippocampus, (d) thalamus, (e) hypothalamus, (f) cerebral peduncle, (g) cerebellar peduncle, (h) pons, (i) medulla, (j) cochlear nucleus, and (k–l) cerebellum. Representative images are shown from one male, with Bregma coordinates (a, c) − 2.18 mm, (b, d–f) − 2.92 mm, (g, h) − 4.24 mm, and (i–l) − 6.24 mm, enlargements in a’–l’ marked by dashed boxes. Slc6a9 signals are pseudo-coloured in light grey, and magenta arrows indicate examples of representative cells with expression (≥ 5 dots within the same cell). Scale bars: a–l 500 μm, enlargements 100 μm. Abbreviations: alv = alveus; ANcr1gr = Ansiform lobule crus 1, granular layer; ANcr1mo = Ansiform lobule crus 1, molecular layer; CA1 = Cornu Ammonis 1; COApm = cortical amygdalar area, posterior part, medial zone; cpd = cerebral peduncle; DG = dentate gyrus; FL = flocculus; FLgr = flocculus, granular layer; FLmo = flocculus, molecular layer; GRN = gigantocellular reticular nucleus; HPF = Hippocampal formation; IRN = intermediate reticular nucleus; LGd = dorsal lateral geniculate body; LGv = ventral lateral geniculate body; LHA = lateral hypothalamic area; MARN = magnocellular reticular nucleus; mcp = middle cerebellar peduncle; MGd = dorsal nucleus of medial geniculate body; Or = oriens layer of the hippocampus; PA = posterior amygdalar nucleus; PH = posterior hypothalamic nucleus; POR = periolivary region; pri = Purkinje cell layer; PRNc = pontine reticular nucleus; PTLp = posterior parietal association areas; RSPd = retrosplenial area, dorsal part; SIMgr = simple lobule, granular layer; SIMmo = simple lobule, molecular layer; st = stria terminalis; SUM = supramammillary nucleus; VCO = ventral cochlear nucleus Previous reports suggest that Slc6a9 is primarily located to glial cells, although expression has also been noted in certain neuronal populations [55, 64, 65]. To further investigate this, RNAscope was combined with immunohistochemistry using the neuronal marker NEUN and the astrocytic marker GFAP. Slc6a9 was detected in both NEUN- and GFAP-positive cells, as well as in NEUN- and GFAP-negative cells (Fig. 5), predominantly within the grey matter. This pattern indicates that Slc6a9 is expressed in both neurons and astrocytes, and may be expressed in neuronal populations not marked by NEUN or in other glial cell types (Fig. 5). Expression patterns were qualitatively similar in females and males (Fig. 5e–p), although differences in signal intensity between sections (Figs. 4 and 5) were observed, likely reflecting variability in assay efficiency and tissue quality. Consequently, no quantitative analysis was performed. Fig. 5. In situ hybridization and immunohistochemistry analysis of Slc6a9 co-expression with neuronal and astrocytic markers in the adult mouse brain. Fluorescent RNAscope for *Slc6a9 *(red) was combined with immunohistochemistry for NEUN (neuronal marker, light blue) or GFAP (astrocytic marker, light blue). Nuclei were stained with DAPI (light grey). Sections at Bregma (a, e, f, i, j) − 4.24 mm and (b–d, g, h, k–p) − 6.24 mm were used to assess co-expression with NEUN in the (a) pons, (b) medulla oblongata, (c) cerebellar lobule, and (d) paraflocculus (PFL) of cerebellum. Sections at the same Bregma levels were used to assess co-expression with GFAP in the cerebral peduncles of (e) female and (f) male mice, cerebellar peduncles of (g) female and (h) male mice, pons of (i) female and (j) male mice, medulla oblongata of (k) female and (l) male mice, paraflocculus/flocculus (FL)/crus 2 of (m) female and (n) male mice, and cerebellar lobule of (o) female and (p) male mice. Representative images are shown from two males, with similar expression observed in females, enlargements in a’–p’’ marked by dashed boxes. White arrows indicate examples of co-expressing cells, while magenta arrows highlight examples of cells expressing Slc6a9 only (≥ 5 dots within the same cell). Scale bar: a–p 100 μm, enlargements 20 μm. Abbreviations: 4&5Cb = fourth and fifth cerebellar lobules; 10Cb = tenth cerebellar lobule; arb = arbor vitae; cbc = cerebellar commissure; CBX = cerebellar cortex; Crus2 = crus 2 of the ansiform lobule; FL = flocculus; Gi = gigantocellular reticular nucleus; icp = inferior cerebellar peduncle; IRt = intermediate reticular nucleus; ll = lateral lemniscus; mcp = middle cerebellar peduncle; Med = medial (fastigial) cerebellar nucleus; ml = medial lemniscus; MVeMC = medial vestibular nucleus, magnocellular part; PCRt = parvicellular reticular nucleus; PFL = paraflocculus; PnO = pontine reticular nucleus, oral part; PRNr = pontine reticular nuclues; rust = rubrospinal tract; SptV = spinal tract of the trigeminal nerve; SPVO = spinal nucleus of the trigeminal, oral part; VLL = ventral nucleus of the lateral lemniscus; vVIIIn = vestibular nerve. Separate channels can be found in Additional file 1: Fig. S3
In the spinal cord, Slc6a9 was detected in both NEUN-positive and GFAP-positive cells (Fig. 6). While expression in NEUN-positive cells was sparse, GFAP-positive cells exhibited Slc6a9 expression in both the grey and white matter of the dorsal and ventral horns across all spinal cord divisions. Expression was observed in both female and male mice, with no apparent sex-related differences (Fig. 6). In addition, Slc6a9 was highly expressed in the DRG, whereas the second glycine transporter, Slc6a5, was detected only in a small subset of DRG cells (Fig. 7)
Fig. 6Co-expression of Slc6a9 with neuronal and astrocytic markers in the lumbar spinal cord of adult mice. RNAscope for Slc6a9 (red) was combined with immunohistochemistry for NEUN (neuronal marker, light blue) and GFAP (astrocytic marker, light blue) in female and male mice. Nuclei were stained with DAPI (light grey). (a–d) Representative images from one (a, c) female and one (b, d) male show lumbar spinal cord sections between L5 (b, c) and L6 (a, d). White arrows indicate examples of double-positive cells, while magenta arrows highlight examples of cells expressing Slc6a9 only (≥ 5 dots within the same cell). Scale bars: a–d 500 μm, enlargements 50 μm. Separate channels can be found in Additional file 1: Fig. S4
Fig. 7Expression of Slc6a9 and Slc6a5 in the dorsal root ganglia (DRG) of adult mice. RNAscope analysis in female and male mice revealed that both glycine transporters were expressed across all DRG divisions. (a, b) Representative images of (a) lumbar and (b) thoracic DRG from female mice, showing transporter signals in red and nuclei staining with DAPI (light grey). Magenta arrows indicate examples of expressing cells (≥ 5 dots within the same cell). Scale bars: 50 μm
Histological analysis revealed that Slc6a5 was predominantly expressed in the caudal regions of the brain and in the spinal cord, where it was mainly localized to inhibitory neurons, with limited expression observed in a subset of excitatory neurons
Slc6a5 expression has predominantly been reported in caudal brain regions [32, 66, 67], a pattern further corroborated by the scRNA-seq and qRT-PCR data presented here (Figs. 1, 2 and 3). In contrast, a recent study employing tdTomato reporter line-based genetic labelling suggested a broader distribution of Slc6a5 throughout the brain, although subsequent in situ analyses in male mice confirmed that expression was largely restricted to the thalamus and midbrain [67]. To refine the spatial localization of Slc6a5, fluorescent in situ hybridization (RNAscope) was performed. Furthermore, co-expression of Slc32a1 and Slc17a6 in Slc6a5-positive cells was assessed to determine their excitatory or inhibitory molecular characteristics.
A small number of Slc6a5-positive cells were detected in the thalamus, PAG, midbrain, and pons (Fig. 8). Within the thalamus, expression was observed around the lateral geniculate nucleus, the caudal portions of the lateral and medial posterior nuclei, and the anterior nuclei (Fig. 8a–a’’’). Additional expression was found in the ventrolateral PAG, the ventrolateral subnucleus of the dorsal raphe nucleus (Fig. 8b–b’’’), as well as in the vicinity of the cuneiform nucleus and the pedunculopontine tegmental nucleus (Fig. 8c–d’’’). These cells were present in both female and male mice, and most co-expressed the inhibitory marker Slc32a1, although Slc17a6-positive Slc6a5 neurons were detected (Fig. 8). In the thalamus, 74 ± 1% (female – range of analysed sects. 70–83%, n = 2 mice, 2 sections per mouse) and 77 ± 22% (male – range of analysed sects. 50–88%, n = 1 mouse, 3 sections) of the Slc6a5 labelled cells co-expressed Slc32a1, while only 15 ± 6% (female – range of analysed sects. 8–19%, n = 1 mouse, 3 sections) and 9 ± 4% (male – range of analysed sects. 4–100%, n = 2 mice, 4–5 section per mouse) of the Slc6a5 labelled cells co-expressed Slc17a6. In the PAG region, a majority of the Slc6a5 labelled cells co-expressed Slc32a1 (female – 88 ± 7%, range of analysed sects. 80–93%, n = 2 mouse, 3 sections per mouse; male – 87 ± 7%, range of analysed sects. 67–98%, n = 2 mice, 1–6 section per mouse); however, a proportion of the Slc6a5 labelled cells co-expressed Slc17a6 (female – 4 ± 2%, range of analysed sects. 0–12%, n = 2 mice, 2 sections per mouse; male – 7 ± 1%, range of analysed sects. 0–15%, n = 2 mice, 1–5 sections per mouse). Similar findings were observed in the midbrain (female – Slc6a5/Slc32a1 proportion: 74 ± 8%, range of analysed sects. 27–97%, n = 2 mice, sects. 2–4 per mouse; Slc6a5/Slc17a6 proportion: 2 ± 1%, range of analysed sects. 0–7%, n = 2 mice, 1–3 sections per mouse; male – Slc6a5/Slc32a1 proportion: 87 ± 7%, range of analysed sects. 60–95%, n = 2 mice, 1–10 sections per mouse); Slc6a5/Slc17a6 proportion: 5 ± 1% (range of analysed sects. 0–15%, n = 2 mice, 1–10 sections per mouse) and pons (female – Slc6a5/Slc32a1 proportion: 97 ± 2%, range of analysed sects. 91–100%, n = 2 mice, sects. 2–4 per mouse; Slc6a5/Slc17a6 proportion: 2 ± 1%, range of analysed sects. 1–3%, n = 1 mice, 3 sections per mouse; male – Slc6a5/Slc32a1 proportion: 86 ± 8%, range of analysed sects. 64–100%, n = 2 mice, 1–4 sections per mouse; Slc6a5/Slc17a6 proportion: 5 ± 1%, range of analysed sects. 2–11%, n = 2 mice, 1–7 sections per mouse) of female and male mice.
In the more caudal brain regions, RNAscope results were consistent with previous findings [32, 66, 67], with high expression observed in the cerebellum and brainstem (Fig. 9a–h). In both female and male mice, the majority of Slc6a5 labelled cells in the cerebellum co-expressed Slc32a1 (female – 89 ± 3%, range of analysed sects. 78–97%, n = 2 mice, 2 sections per mouse; male – 94 ± 1%, range of analysed sects. 87–99%, n = 2 mice, 2–3 sections per mouse) (Fig. 9a b), whereas almost no co-expression between Slc6a5 and the excitatory marker Slc17a6 was detected (female – 0.2 ± 0%, range of analysed sects. 0–0.3%, n = 2 mice, 2 section per mouse; male – 0 ± 0%, (range of analysed Sect. 0%, n = 2 mice, 2–3 sections per mouse) (Fig. 9c, d).
In the brainstem, RNAscope results aligned with scRNA-seq and qRT-PCR findings (Fig. 9e–h). Similar to the cerebellum, most Slc6a5 labelled cells in the brainstem were co-labelled with the inhibitory marker (female – 96 ± 2%, range of analysed sects. 88–99%, n = 2 mice, 1–3 sections per mouse; male – 96 ± 0.1%, range of analysed sects. 93–99%, n = 2 mice, 2–3 sections per mouse) (Fig. 9e, f). However, unlike the cerebellum, where no Slc17a6 co-expression was observed, approximately 20–50 Slc6a5-labelled/Slc17a6-labelled cells per section were identified in both female and male mice (female – 2 ± 0%, range of analysed sects. 1– 3%, n = 2 mice, 2 sections per mouse); male: 2 ± 0.2%, range of analysed sects. 1–4%, n = 2 mice, 2–3 sections per mouse) (Fig. 9g, h).
Fig. 8Histological analysis of Slc6a5 expression in thalamus and midbrain,* and its overlap with inhibitory and excitatory markers.* RNAscope was performed on sections of (a) thalamus, (b) periaqueductal grey (PAG), (c) midbrain, and (d) pons obtained from female and male mice to examine Slc6a5 expression (red) and its co-localization with the inhibitory marker Slc32a1 (encoding VIAAT, light blue) or the excitatory marker Slc17a6 (encoding VGLUT2, light blue). Nuclei were stained with DAPI (light grey). Representative images (a–d’’’) show overlap with Slc32a1 (a–d, a’–d’’) or Slc17a6 (a’–d’, a’’’–d’’’), enlargements marked by dashed boxes. White arrows indicate examples of overlapping cells, while magenta arrows highlight examples of Slc6a5-expressing cells (≥ 5 dots within the same cell). Sections were collected at Bregma levels (a–a’’’) − 2.70 mm, (b–c’’’) − 4.48 mm, and (d – d’’’) − 4.72 mm. Scale bars: 100 μm, enlargements 20 μm. Abbreviations: APTD = anterior pretectal nucleus, dorsal part; CnF = cuneiform nucleus; DLG = dorsal, lateral geniculate nucleus; DLL = dorsal nucleus of the lateral lemniscus; DRD = dorsal raphe nucleus, dorsal part; DRV = dorsal raphe nucleus, ventral part; DRVL = dorsal raphe nucleus, ventrolateral part; ECIC = external cortex of the inferior colliculus; ILL = intermediate nucleus of the lateral lemniscus; LHb = lateral habenular nucleus; LPAG = lateral periaqueductal gray; LPLC = lateral posterior thalamic nucleus, laterocaudal part; LPMR = lateral posterior thalamic nucleus, mediorostral part; mcp = middle cerebellar peduncle; MHb = medial habenular nucleus; MiTg = microcellular tegmental nucleus; Pa4 = paratrochlear nucleus; PAG = periaqueductal grey; PF = parafascicular thalamic nucleus; PNO = pontine reticular nucleus, oral part; PPTg = pedunculopontine tegmental nucleus; RPO = rostral periolivary region; SPTg = subpedencular tegmental nucleus; VLGMC = ventral lateral geniculate nucleus, magnocellular part; VLPAG = ventrolateral periaqueductal grey; VLTg = ventrolateral tegmental area; xscp = decussation of the superior cerebellar peduncle. Separate channels can be found in Additional file 1: Fig. S5
Fig. 9Slc6a5 expression analysis reveals a predominantly inhibitory subpopulation of cells in the cerebellum and brainstem. Fluorescent in situ hybridization was performed on sections at Bregma (e–h’) − 5.88 and (a–d’) − 6.64 mm from female and male mice to examine Slc6a5 expression (red) and its co-expression with inhibitory (Slc32a1, encoding VIAAT, light blue) or excitatory (Slc17a6, encoding VGLUT2, light blue) markers in the (a–d’) cerebellum and (e–h’) brainstem. Nuclei were stained with DAPI (light grey). Abbreviation: 4&5Cb = fourth and fifth cerebellar lobules; Crus1 = crus 1 of the ansiform lobule; Crus2 = crus 2 of the ansiform lobule; LVe = lateral vestibular nucleus; MVeMC = medial vestibular nucleus, magnocellular part; PCRt = parvicellular reticular nucleus; Sim = simple lobule; Sol = solitary tract; sp5 = spinal trigeminal tract; Sp5I = spinal trigeminal nucleus, interpolar part; Sp5ODM = spinal trigeminal nucleus, oral part, dorsomedial division. Representative images (a–h) show overlap with Slc32a1 in cerebellum (a–b, a’–b’) or Slc17a6 (c–d, c’–d’) and Slc32a1 in brainstem (e–f, e’–f’) or Slc17a6 (g–h, g’–h’), enlargements marked with dashed boxes. White arrows mark examples of double-positive cells, and magenta arrows mark examples of Slc6a5-only cells (≥ 5 dots within the same cell). Scale bars: 100 μm, enlargements 50 μm. Separate channels can be found in Additional file 1: Fig. S6
GLYT2-Cre cells in the spinal cord have been demonstrated to play a prominent role in the regulation of sensory information [68]. Spatial analysis using RNAscope revealed that Slc6a5-labelled cells could be found in both the dorsal and ventral part in all divisions of the spinal cord in both female and male mice (Fig. 10a–d, Additional file 1: Fig. S7–S11). Moreover, Slc6a5 expression was detected in a small subset of DRG cells (Fig. 7b), which contrasted with the scRNA-seq data (Figs. 1 and 2). This discrepancy may be attributable to technical limitations, as no Slc6a5-positive cells were captured during sample preparation or the expression of Slc6a5 was below the detection threshold in the Zeisel et al. (2018) dataset [42].
Previous studies have suggested that Slc6a5 functions as an inhibitory marker for glycinergic neurons [69, 70], and this interpretation is largely supported by our spinal cord data. The majority of Slc6a5-positive cells were found to co-express *Slc32a1 *in both the dorsal (female – 68 ± 1%, range of analysed sects. 32–87%, n = 2 mice, 11 sections per mouse; male – 63 ± 0.3%, range of analysed sects. 24–88%, n = 2 mice, 11 sections per mouse) and ventral part (female – 71 ± 2%, range of analysed sects. 35–98%, n = 2 mice, 11 sections per mouse; male – 66 ± 0.1%, range of analysed sects. 29–86%, n = 2 mice, 11 sections per mouse) of the spinal cord, a pattern that was consistent across all spinal cord divisions (Fig. 10a, b, Additional file 1: Fig. S7–S9). Nevertheless, a small subset of Slc6a5-positive cells co-expressed Slc17a6, the gene encoding vesicular glutamate transporter 2 (VGLUT2), in both the dorsal (female – 5 ± 0.1%, range of analysed sects. 2–19%, n = 2 mice, 8 sections per mouse; male – 5 ± 0.5%, range of analysed sects. 0–16%, n = 2 mice, 8 sections per mouse) and ventral (female – 6 ± 1%, range of analysed sects. 1–7%, n = 2 mice, 8 sections per mouse; males – 4 ± 0.1%, range of analysed sects. 0–12%, n = 2 mice, 8 sections per mouse) part of the spinal cord from female and male mice (Fig. 10c, d, Additional file 1: Fig. S7–S9), indicating that Slc6a5 is not exclusively associated with inhibitory populations. This observation aligns with findings from a larger RNA-sequencing study conducted by Häring and colleagues [71].
Fig. 10Histological analysis of the spatial expression of Slc6a5 in lumbar spinal cord. RNAscope was performed on (a, c) L4–L5 sections from female mice and (b, d) L4–L5 sections from male mice. (a–d) Representative images of the lumbar spinal cord show Slc6a5 (red), the inhibitory marker Slc32a1 (light blue), the excitatory marker Slc17a6 (light blue), and nuclei staining with DAPI (light grey). Dashed boxes indicate areas shown in enlargements (a’–d’’). White arrows mark examples of double-positive cells, while magenta arrows mark Slc6a5-only cells. Scale bars: 100 μm, enlargements 50 μm
Discussion
Here, we present a comprehensive analysis of Slc6a9 (GLYT1) and Slc6a5 (GLYT2) mRNA expression using three complementary mRNA-based approaches in female and male mice (Table 2). During the early 2010s, members of the SLC6 transporter family were systematically characterized and demonstrated to be conserved across vertebrates, where they are involved in essential physiological processes [72], including amino acid transport, osmotic homeostasis, and modulation of neurotransmitter signalling in both the peripheral and central nervous systems [73]. Beyond these roles, SLC6 transporters have been implicated in spermatogenesis [74], and in the intestine and kidneys they are considered critical for amino acid absorption and osmolyte reabsorption [17], underscoring their widespread expression. More recently, interest in glycine transporters as therapeutic targets has increased [5, 75–79]. Accordingly, gene expression data highlighting sex-dependent differences in a translational model organism may provide important insights for the development of safer and more precise treatment strategies.
Table 2. Summary of Slc6a9 and Slc6a5 expression in the central nervous system. Expression was considered present if values met or exceeded the following cut-offs: scRNA-seq log1p ≥ 0.1; qRT-PCR significantly expressed compared with negative control (excluding biological outliers); RNAscope ≥ 5 dots within the same cell. Symbols used: + Detected; - not detected; NS not significant against background levels, although one or more biological replicates showed expression; dark grey area not analysedTissue Slc6a9
Slc6a5 scRNA-seqqRT-PCRRNAscopescRNA-seqqRT-PCRRNAscope♀♂♀♂♀♂♀♂Cortex+NSNS+++----Amygdala+NSNS++-----Striatum++NS----+--Hypothalamus++NS++-----Thalamus++++++--++Hippocampus+NSNS-------Midbrain++++Cerebellum++++++-+++Brainstem++++++++++Spinal cord++++++++++DRG+++-++
The SLC6A9 and SLC6A5 expression patterns are similar across mammals
GLYT1 (SLC6A9) exhibits a broad expression profile across the human body. According to the HPA (https://www.proteinatlas.org/ENSG00000196517-SLC6A9/tissue) [63], both mRNA and protein expression have been detected in a wide range of tissues, including the brain, eye, endocrine organs, respiratory system, gastrointestinal tract, liver, pancreas, kidney, reproductive tissues (male and female), muscle, connective and soft tissues, skin, bone marrow, and lymphoid tissues. Furthermore, SLC6A9 mRNA has been identified in human enterocytes of the intestine [80], and in the prefrontal cortex [81]. This widespread distribution indicates that GLYT1 (https://www.proteinatlas.org/ENSG00000196517-SLC6A9/tissue) [63] potentially has physiological roles outside of the central nervous system. One such potential role that has been established is the link between glycine transporter 1 and haemoglobinization and iron homeostasis [82–84]. Another known physiological function where GLYT1 has a role is in the absorption and reabsorption of amino acids in the intestine and kidneys, maintaining systemic glycine homeostasis [85, 86]. Our bulk-tissue analysis showed sex-dependent differences in the mRNA expression of Slc6a9 in the intestine and kidneys, suggesting that there might be sex‑specific regulatory mechanisms governing glycine transport and homeostasis in peripheral tissues. Single-cell RNA sequencing demonstrated a broad range of cell types expressing SLC6A9, with particularly enhanced expression in horizontal cells, erythroid cells, bipolar cells, distal enterocytes, and suprabasal keratinocytes [87, 88]. Consistent with earlier studies, recent single-nucleus RNA sequencing has revealed enriched SLC6A9 expression in glial populations, particularly astrocytes, ependymal cells, and oligodendrocytes [87, 88], coherent with our findings in the re-analysis of the Zeisel et al. (2018) dataset. In rodents, Slc6a9 expression has been detected in the developing mouse spinal cord and in the adult rat liver, lung, spinal cord, cerebellum, hippocampus, and optic nerve [29]. These findings are consistent with our results, in which all three mRNA-detection methods consistently revealed widespread Slc6a9 expression in mice.
According to the HPA, RNA sequencing has revealed that SLC6A5 expression in humans is relatively limited, with mRNA detection in the caudal brain, endocrine tissues, respiratory system, and testis (https://www.proteinatlas.org/ENSG00000165970-SLC6A5/tissue) [63]. Mutations in the human SLC6A5 gene have been implicated in hyperekplexia [89]. Within the central nervous system, SLC6A5 has primarily been localized to inhibitory neurons [69, 70, 78]. Interestingly, GLYT2 has been identified in excitatory neurons of the pre-Bötzinger complex in rats [90], in the pontine reticular formation and PAG in mice [91, 92], and in the cochlear nuclei of humans and chimpanzees [93]. In addition, single-nucleus RNA analysis of the human brain demonstrated expression in inhibitory neurons of the cerebellum, the hippocampal CA4 region, and medial ganglionic eminence interneurons [87, 88]. These findings are consistent with our data, which indicates a predominantly caudal expression pattern in the mouse brain. However, Slc6a5 expression was not detected in the hippocampal CA regions. It should be noted that mice lack the CA4 region; nevertheless, we observed expression in close proximity to the dentate gyrus.
Beyond the nervous system, expression has been reported in human islet β-cells [94, 95]. Single-cell RNA sequencing has revealed that SLC6A5 is expressed in spermatids, oocytes, pituitary gland cells, and adrenal cortex cells (https://www.proteinatlas.org/ENSG00000165970-SLC6A5/single+cell). In visceral organs, Slc6a5 expression was detected by qRT-PCR in some biological replicates of intestine and testis, which is in line with previous reports [88].
Slc6a9 can be found in both neurons and glial cells
Slc6a9 has primarily been reported as expressed in glial cells located near glycinergic neurons [55, 62]. However, our combined in situ hybridization and immunohistochemistry showed that Slc6a9 is expressed in both NEUN-positive (neurons) and GFAP-positive (astrocytes) cells. This observation is consistent with previous RNA sequencing analyses [87, 88], and our re-analysis of the Zeisel et al. (2018) dataset [42] where Slc6a9 expression was found in neurons (Figs. 1 and 2). Moreover, Slc6a9 expression was identified in cells that did not express NEUN or GFAP, indicating additional Slc6a9-positive cellular subpopulations. This finding is further supported by earlier RNA sequencing data [42, 87, 88]. Importantly, NEUN does not label all neurons [96–101]. While it is a robust marker for cortical neurons, hippocampal CA1–CA3 neurons, cerebellar granule cells, and neurons of the brainstem and spinal cord, NEUN fails to label certain inhibitory or specialized neuronal populations, such as cerebellar Purkinje cells, olfactory bulb mitral cells, and subsets of interneurons in the cortex and hippocampus [96–101]. Members of the SLC6 family are secondary active co-transporters that utilize the sodium gradient to transport their substrates, and in some cases chloride ions [17, 19, 102]. Both GLYT1 and GLYT2 transport sodium ions, chloride ions, and glycine, but their biochemistry differs. GLYT1 couples glycine transport with two sodium ions and one chloride ion, whereas GLYT2 couples glycine transport with three sodium ions and one chloride ion [103]. Variances in transport stoichiometries may reflect their differences in expression patterns, with GLYT1 is primarily glial, whereas GLYT2 is neuronal [103].
Sex-dependent differences in expression of Slc6a5
Recently, Jiang et al. (2025) investigated the sex-specific distribution of GLYT2 neurons in the central nervous system of mice using the GlyT2-iCre mouse line in combination with the tdTomato reporter line [67]. Non-oestrus females were reported to exhibit higher GLYT2-tdTomato expression across 12 brain regions within the thalamus, midbrain, and hindbrain compared with males, whereas males showed higher expression in the ventral posteromedial nucleus and lateral cerebellar regions [67]. Our results for Slc6a5 indicated generally higher expression in males based on the bulk-tissue analysis using qRT-PCR (the cortex, striatum, hippocampus, and spinal cord), which is inconsistent with their tdTomato findings. However, it should be noted that tdTomato expression may not fully represent the adult GLYT2 population, which has been the focus of our study, as distinguishing between developmentally labelled and mature GLYT2 neurons remain challenging, a limitation acknowledged by Jiang et al. (2025) [67]. In addition, the authors performed RNAscope against Slc6a5 in male mice, where they observed a sparser expression pattern, consistent with our findings. RNAscope labelling was reported in the thalamus, midbrain, and hindbrain, regions in which expression was replicated in our study.
Slc6a9 and Slc6a5 co-localize with the glutamate transporter Slc17a6 in several brain regions
Most neurons expressing Slc6a9 or Slc6a5 were found to co-express Slc32a1, indicating that these cells are inhibitory. Glycine is released to hyperpolarize the postsynaptic neuron via interactions with pentameric ligand-gated ion channels [1–5] and the metabotropic glycine receptor, previously referred to as Gpr158 [104]. However, in certain regions, including the hypothalamus and caudal structures such as the midbrain, medulla, and spinal cord, Slc6a9 was expressed in comparable proportions across both excitatory and inhibitory neurons. In contrast, within the thalamus, pons, and DRG, Slc6a9 predominantly co-localized with the excitatory glutamatergic transporter Slc17a6. Comparable patterns were observed in the thalamic neurons during the Slc6a5 analysis. This demonstrates that subpopulations of Slc6a9- or Slc6a5-expressing neurons are excitatory and can utilize glutamate to influence the postsynaptic membrane. In this setting, the classical inhibitory transmitter glycine assumes an excitatory role by binding to its co‑agonist site on NMDA receptors, thereby enhancing receptor activation in the presence of glutamate or N-methyl-D-aspartate (NMDA) ([105], reviewed by [106]). This potentiation occurs through an increased frequency of NMDA channel opening [105]. Consequently, the presence of Slc6a9 in excitatory synapses may serve to regulate glutamatergic tone [107].
Methodological consideration
Minor discrepancies between the three analyses, as noted previously [43, 44], are likely attributable to differences in sample preparation and assay sensitivity. In the scRNA-seq dataset generated by Zeisel et al. (2018) [42], which represents one of the most comprehensive single-cells transcriptomic maps of the mouse nervous system, samples from both females and males were pooled during tissue dissociation and library preparation. This means that the resulting dataset represents a composite transcriptomic profile that precludes the disaggregation of sex-specific expression differences. A key distinction exists between the genetic foundations of the Zeisel et al. (2018) dataset [42], where a heterogenous mix of outbred (CD-1, Swiss) and mixed background (CD-1, C57BL/6J) transgenic mice was employed to capture a broad landscape of cellular diversity, the rest of our analysis was conducted exclusively on the inbred C57BL/6J strain. By utilizing a strictly inbred model, the background noise and genetic variability inherent in outbred populations were minimized, providing a highly controlled baseline for Slc6a9 and Slc6a5 expression [108–110]. However, it is important to note that the high-resolution cell-type mapping in the Zeisel et al. (2018) dataset might reflect a wider range of physiological states that are more homogenized in a pure C57BL/6J cohort. In addition to strain differences, the temporal windows of the Zeisel et al. (2018) dataset [42] and our analysis offer distinct physiological perspectives. The scRNA-seq dataset incorporates a developmental range, including juvenile postnatal days (P12–P30) and early adult stages (6–8 weeks), which may capture transient high-expression levels of Slc6a9 and Slc6a5 associated with late-stage maturation of the nervous and peripheral systems [111, 112]. In contrast, our bulk-tissue and spatial analysis utilized mice aged 10–14 weeks, representing a stable phase of biological maturity [113–115]. This allows our findings to reflect the glycine transporters’ expression in a steady-state adult physiology, though it may exclude the heightened plastic or developmental expression patterns present in the earlier time-points analysed by Zeisel et al. (2018). Furthermore, because the dataset was derived from captured single cells [42], certain cell populations may have been lost during sample preparation, which may be one of the reasons why the re-analysis of the scRNA-seq dataset and our RNAscope data are inconsistent, particularly in the DRG analysis of Slc6a5 expression. However, the discrepancy in age could also be a contributing factor. By contrast, qRT-PCR analysis was performed on bulk-prepared samples, in which whole tissue or larger regions were collected. This approach has both advantages and limitations. On the one hand, it ensures that a broader area is sampled, reducing the likelihood of missing specific expressing cells. On the other hand, regional variability in expression can be masked, as areas with lower expression may dilute signals from regions with higher expression. As a result, qRT-PCR may fail to capture subtle, region-specific differences.
Furthermore, scRNA-seq, qRT-PCR, and RNAscope differ in sensitivity and resolution. scRNA-seq provides broad transcriptome coverage but can miss low-abundance transcripts due to dropout events. qRT-PCR is highly sensitive and quantitative for specific genes but lacks spatial resolution. RNAscope offers single-cell spatial resolution with high sensitivity but is limited to targeted transcripts and sections. These methodological differences influence whether subtle, region-specific, or sex-dependent mRNA expression patterns are detected.
Conclusion
These findings indicate that both Slc6a9 and Slc6a5 are expressed across multiple brain regions, with Slc6a9 exhibiting a broader distribution in neurons and glial cells. Furthermore, both transporters were predominantly found to co-express the inhibitory vesicular amino acid transporter, especially Slc6a5; however, in certain regions co-expression with the excitatory vesicular glutamate transporter 2 was found. In regions where sex-dependent differences were observed, using qRT-PCR, males generally displayed higher expression levels than females, suggesting a potential role for sex-specific regulation of glycine transporters in cellular function and signalling.
Supplementary Information
Below is the link to the electronic supplementary material.
Supplementary Material 1
The reference list from the paper itself. Each links out to its DOI / PubMed record.
- 1Wang X, Yue M, Cheung JPY, Cheung PWH, Fan Y, Wu M, et al. Impaired Glycine neurotransmission causes adolescent idiopathic scoliosis. J Clin Invest. 2024;134(2).10.1172/JCI 168783 PMC 1078669837962965 · doi ↗ · pubmed ↗
- 2Sjostedt E, Zhong W, Fagerberg L, Karlsson M, Mitsios N, Adori C, et al. An atlas of the protein-coding genes in the human, pig, and mouse brain. Science. 2020;367(6482).10.1126/science.aay 594732139519 · doi ↗ · pubmed ↗
- 3Fillingim RB, King CD, Ribeiro-Dasilva MC, Rahim-Williams B, Riley JL 3. Sex, gender, and pain: a review of recent clinical and experimental findings. J Pain. 2009;10(5):447–85.10.1016/j.jpain.2008.12.001PMC 267768619411059 · doi ↗ · pubmed ↗
- 4Galambos AR, Papp ZT, Boldizsar I, Zador F, Koles L, Harsing LG Jr., et al. Glycine transporter 1 inhibitors: predictions on their possible mechanisms in the development of opioid analgesic tolerance. Biomedicines. 2024;12(2).10.3390/biomedicines 12020421 PMC 1088654038398023 · doi ↗ · pubmed ↗
- 5Karlsson M, Zhang C, Mear L, Zhong W, Digre A, Katona B, et al. A single-cell type transcriptomics map of human tissues. Sci Adv. 2021;7(31).10.1126/sciadv.abh 2169 PMC 831836634321199 · doi ↗ · pubmed ↗
- 6Dafsari HS, Kawalia A, Sprute R, Karakaya M, Malenica A, Herkenrath P, et al. Novel mutations in SLC 6A 5 with benign course in hyperekplexia. Cold Spring Harb Mol Case Stud. 2019;5(6).10.1101/mcs.a 004465 PMC 691315131604777 · doi ↗ · pubmed ↗
- 7Assareh N, Fenech C, Power R, Uddin MN, Otsu Y, Aubrey KR. Bidirectional modulation of nociception by Gly T 2(+) neurons in the ventrolateral periaqueductal Gray. e Neuro. 2023;10(6).10.1523/ENEURO.0069-23.2023 PMC 1027031837253591 · doi ↗ · pubmed ↗
- 8Moon J, Ahn JH, Won MH. Neu N expression in health and disease: a histological perspective on neuronal heterogeneity. Histol Histopathol. 2025:18965.10.14670/HH-18-96540697072 · doi ↗ · pubmed ↗