Reference values for umbilical cord arterial pH by mode of birth in preterm, term and postterm infants: a population-based cohort study
Noor Abdulahad, Tiia-Marie Sundberg, Mehreen Zaigham

TL;DR
This study establishes reference values for umbilical cord pH based on birth mode and gestational age, showing trends in acidosis levels among different birth types.
Contribution
The study provides population-based reference values for umbilical cord arterial pH by mode of birth and gestational age.
Findings
Umbilical cord arterial pH values vary significantly by mode of birth, with immediate Cesarean sections and instrumental births showing higher acidosis.
A negative linear relationship exists between gestational age and umbilical cord pH in non-instrumental vaginal births and emergency Cesarean sections.
Reference percentiles for umbilical cord pH are provided for different birth modes and gestational age groups.
Abstract
Umbilical cord arterial pH (UApH) is the most objective measurement of the metabolic condition of the infant at birth. However, studies have identified changes in UApH with advancing gestational age, as there is limited data examining UApH changes with different modes of birth. The objective was to establish reference values for UApH according to mode of birth and to investigate the influence of gestational age on changes in UApH across different modes of birth. A retrospective cohort study using data from Perinatal Revision South register, from seven maternity units in southern Sweden. Validated pH values from 103,115 infants were included. Cohort characteristics were reported collectively and for each mode of birth using numbers and percentages. Reference values were reported as 2.5th to 97.5th percentiles, with mean and median values. One-way ANOVA was used to investigate…
Genes, proteins, chemicals, diseases, species, mutations and cell lines named across the full text — each resolved to its canonical identifier and authoritative record.
Click any figure to enlarge with its caption.
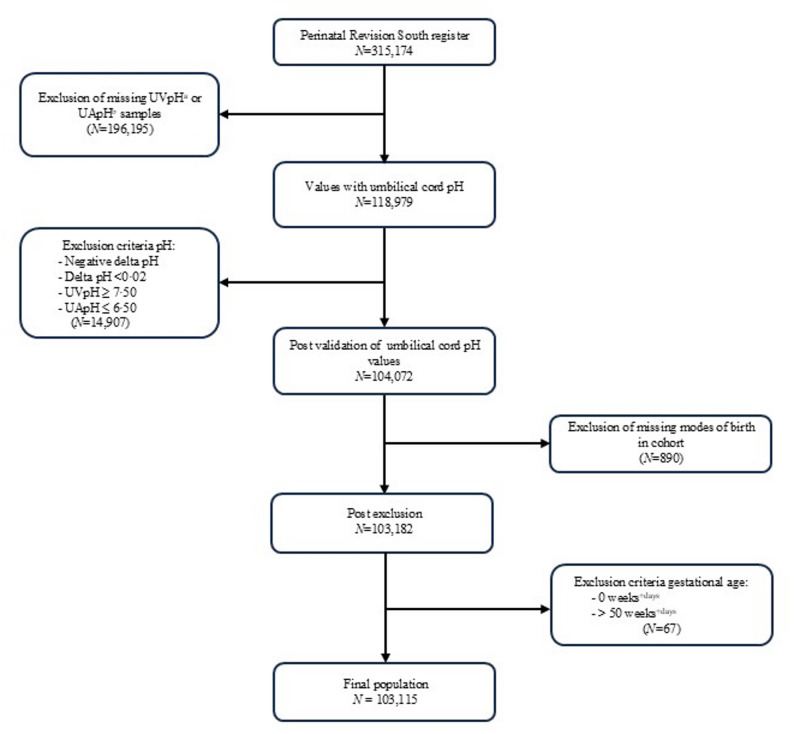 Figure 1
- —Lund University
Peer Reviews
No public reviews on file for this paper yet. If you reviewed it on a platform where reviews are public (OpenReview, ICLR, NeurIPS, ICML), you can paste yours below so the community can read it here.
Videos
No videos yet. Explain this paper in a talk, walkthrough, or lecture? Add one.
Taxonomy
TopicsNeonatal and fetal brain pathology · Pregnancy and preeclampsia studies · Neonatal Respiratory Health Research
Introduction
Timely interventions used appropriately in obstetric care can be crucial in preventing perinatal morbidity and mortality [1]. Obstetricians rely on skill and experience to achieve high-quality decision-making for interventions when medically indicated [2]. Nevertheless, distribution of modes of birth varies significantly between regions of the world, regardless of adjustments for maternal and perinatal characteristics [3].
The risk management and quality of obstetric care can be objectively measured by using umbilical cord blood pH [4]. These blood gases can be used to judge the metabolic condition of the infant at birth and can help in the early identification of infants suffering from birth asphyxia, a leading cause of neonatal mortality worldwide [5–7]. However, since the physiology of different modes of birth predisposes fetuses to varying degrees of hypoxia, from little to no hypoxia in planned Cesarean sections (CS) to high levels during vaginal birth, it is important for obstetricians to be aware of such differences when interpreting umbilical cord blood gas values [8, 9].
The most common medical conditions resulting in emergency CS are dystocia, and abnormal fetal heart rate monitoring [10]. Operative vaginal birth is mainly indicated during the second stage of labor due to dystocia and/or clinical signs suggesting fetal acidemia [11]. Use of forceps have declined in the last decades, and compared to vacuum extraction (VE) is correlated to higher incidence of obstetric sphincter injuries [11]. Apart from Apgar score, clinical assessment of the infant is made through analyzing various blood gas parameters of the umbilical cord blood samples, reflecting the acid-base status of the infant [5, 12, 13]. Umbilical cord arterial pH (UApH) has been shown to reflect the metabolic state of the infant during birth, associated strongly with short-term morbidity and mortality in infants suffering from birth asphyxia [14, 15]. The definition of pathological UApH in infants varies among different studies, ranging between < 7.00 to < 7.20 [16, 17].
Previous research has however found that umbilical cord blood pH is not similar across different modes of birth [8, 18]. Yoon et al. observed significant differences in umbilical cord pH between vaginal births and CS in a cohort of low-risk singleton term pregnancies, with a decline in pH noted in vaginal births [18]. However, a study evaluating reference values for umbilical cord blood gases in spontaneous vaginal births and CS found no significant differences in UApH between the two modes of birth [19]. Complicating the interpretation of umbilical cord pH levels further, variations have been identified with respect to GA, where an inverse association has been established [9, 8, 20]. Notably, these studies included only normal, vaginal births and infants presenting with high Apgar scores (≥ 7) [8, 20]. One study observed that changes in mean arterial pH values ranged from 7.29 ± 0.10 at 28–31 weeks of gestation to 7.23 ± 0.07 at 42 completed weeks of gestation [20]. A normal range for a vaginal birth in a term infant may therefore not be applicable to infants born through other modes of birth at different GA.
Our aim was to investigate changes in UApH across modes of birth in preterm, term, and postterm infants, in order to characterize mode-of-birth-specific UApH values. Further, we aimed to examine the association between GA and UApH within each mode of birth.
Methods
Study design and setting
We conducted a retrospective, population-based cohort study in the south of Sweden using data extracted from the Perinatal Revision South (PRS) register, a regional register containing obstetric and neonatal data from seven Maternity Units in southern Sweden covering the years from 1995 to 2015.
Study population
Obstetric and medical data from approximately 315,174 live births are recorded in the PRS database. The study included singleton births, including all GA, ranging from preterm (≤ 36 + 6) to term (37 + 0–41 + 1), and postterm (≥ 42 + 0) births. After data extraction from the database, initial exclusion criteria included multiple births and intrauterine fetal death. Thereafter, to ensure two-vessel sampling, all cases with missing cord arterial or venous pH were excluded. Blood gas values were rigorously validated using calculations of venoarterial differences (delta pH) between umbilical cord venous and arterial pH, excluding samples with delta pH < 0.02, assuring correct blood sampling [21]. Venous pH values of ≥ 7.50 and arterial values of ≤ 6.50 were considered erroneous and excluded. As the study was conducted according to mode of birth, cases with unreported mode of birth were eliminated. Finally, GA reported as 0 days or ≥ 50 weeks were considered unphysiological and excluded, resulting in a final study population of 103,115 cases. Exclusion criteria and cohort selection are presented in Fig. 1.
Fig. 1. Flow diagram over selection of study population through validation of pH values and exclusion of aberrant or missing data
Statistical analysis
Reference values for UApH were computed and presented based on mode of birth and GA (in weeks), with all preterm births collected into one group (≤ 36 + 6). Mode of birth were divided into vaginal non-instrumental, vaginal forceps, vaginal VE, elective CS, emergency CS and immediate CS. Subsequently, frequency tables were generated empirically, encompassing mean values, as well as the 2.5th, 5th, 50th, 95th, and 97.5th percentiles for UApH. Using total mean values across each mode of birth, one-way analysis of variance (ANOVA) was conducted to determine if differences in UApH existed for groups undergoing different modes of birth.
The association between GA and UApH was studied with simple linear regression. Associations were investigated according to each mode of birth separately, allowing for independent assessments. Thereafter, a multiple linear regression model was constructed, adjusting for birth weight as a second independent variable, generating adjusted calculations for changes in GA with UApH. A p-value of < 0.05 was considered statistically significant. Before statistical analysis, assumptions for each analysis were checked. All data analysis was performed using IBM SPSS Statistics 27.
Results
Baseline characteristics of the study population are outlined in Table 1. The majority of the study population consisted of non-instrumental vaginal birth, while immediate CS (768/103,115, 0.7%) and forceps-assisted births were more rarely observed. Details of baseline characteristics according to mode of birth are outlined in Table 2. Differences regarding parity were observed when considering the mode of birth. Most women that had a vaginal non-instrumental birth (45,351/80,957, 56.0%) and elective CS (4,185/6,295, 66.5%) were multiparous. Higher percentages of women in groups of all forms of CS were found to had undergone previous CS. A higher frequency of lower Apgar scores was noted in infants born through immediate CS, emergency CS and instrumental vaginal births. Missing values for BMI were reported in 41,558 cases, constituting 40% of the cohort.
Table 1. Demographic characteristics of total study populationTotal N %103,115100Maternal Age (years) < 201,9661.9 20–3481,12878.7 35–3916,76116.3 ≥ 403,2603.2Parity Primipara48,58647.1 Multipara54,52952.9Previous CS^a^ No97,77994.8 Yes5,3365.2Maternal BMI^b^ (kg/m^2^) < 18.51,4171.4 18.5–24.935,40934.3 25–29.9.916,37215.9 ≥ 308,3598.1 Missing41,55840.3Maternal Smoking (cigarettes/day) No97,04494.1 Yes (1–9)4,4244.3 Yes (≥ 10)1,6471.6Birth Start Spontaneous85,95283.4 Induction9,8499.6 CS7,3047.1 Missing100.0Mode of Birth Vaginal, non-instrumental80,95778.5 CS, elective6,2956.1 CS, emergency8,1807.9 CS, immediate7680.7 Vaginal, VE^c^6,4866.3 Vaginal, forceps4290.4Gestational Age (weeks^+days^) Extremely and very preterm (< 32^+ 0^)4420.4 Preterm (32^+ 0^−36^+ 6^)4,7874.6 Term (37^+ 0^−40^+ 6^)76,18773.9 Late term (41^+ 0^−41^+ 6^)16,16515.7 Postterm (≥ 42^+ 0^)5,5345.4Sex Female49,39547.9 Male53,64052.0 Unknown800.1Birth Weight (grams) < 25002,7922.7 2500–399980,07477.7 4000–449916,06315.6 ≥ 45004,1234.0 Missing630.15-minute Apgar Score 0–32060.2 4–68780.9 7–10102,01198.9 Missing200.0^a^*CS *Cesarean section, ^b^*BMI *Body Mass Index, ^c^VE: Vacuum Extraction
Table 2. Characteristics of study population per mode of birthVaginal, non instrumentalCS^a^ electiveCS emergencyCS immediateVaginalVE^b^Vaginal Forceps N % N % N % N % N % N %Total80,9571006,2951008,1801007681006,486100429100Maternal age (years) < 201,6962.1400.61021.2111.41141.830.7 20–3464,72680.04,14065.86,09774.557474.75,24980.934279.7 35–3912,37015.31,65626.31,57919.313517.695014.67116.6 ≥ 402,1652.74597.34024.9486.31732.7133.0Parity Primipara35,60644.02,11033.55,07162.041453.95,04577.834079.3 Multipara45,35156.04,18566.53,10938.035446.11,44122.28920.7CS previously No78,47996.94,80976.47,27989.068388.96,12494.440594.4 Yes2,4783.11,48623.690111.08511.13625.6245.6Maternal BMI^c^ (kg/m^2^) < 18.51,1511.4631.0821.0111.41001.5102.3 18.5–24.927,95734.51,92930.62,37629.028937.62,68241.417641.0 25.0–29.9.0.912,31515.21,14118.11,51918.616721.71,16417.96615.4 ≥ 30.05,9917.470511.21,04212.712015.64687.2337.7 Missing33,54341.42,45739.93,16138.618123.62,07231.914433.6Maternal smoking (cigarettes/day) No76,16894.15,92094.07,71994.468889.66,14894.840193.5 Yes (1–9)3,4674.32644.23464.2617.92664.1204.7 Yes (≥ 10)1,3221.61111.81151.4192.5721.181.9Birth start Spontaneous73,83191.2891.45,52567.554671.15,59386.236885.8 Induction7,1088.8140.21,62419.914919.489313.86114.2 CS110.06,19298.41,02912.6729.400.000.0 Missing70.000.020.010.100.000.0Gestational age (weeks^+days)^ Extremely and very preterm (< 32^+ 0^)1960.2120.22172.7152.010.010.2 Preterm (32^+ 0^−36^+ 6^)3,1973.92313.71,07613.2739.51902.9204.7 Term (37^+ 0^−40^+ 6^)60,95475.35,89393.64,44754.441153.54,19964.728366.0 Late term (41^+ 0^−41^+ 6^)12,88315.9871.41,47518.015820.61,47422.78820.5 Postterm (≥ 42^+ 0^)3,7274.6721.196511.811114.56229.6378.6Sex assigned at birth Female39,49848.83,07948.93,54743.430039.12,80043.217139.9 Male41,39751.13,21251.04,62756.646860.93,67856.725860.1 Unknown620.140.160.10080.100.0Birth weight (grams) < 25001,4921.81873.094411.5678.7921.4102.3 2500–399963,85478.95,05580.35,24464.156673.75,01877.433778.6 4000–449912,63915.673111.61,39817.110313.41,12317.36916.1 ≥ 45002,9373.63155.05867.2283.62463.8112.6 Missing350.070.180.140.570.120.55-minute Apgar Score 0–3830.170.1510.6435.6180.340.9 4–63540.4370.62342.9699.01682.6163.7 7–1080,50799.46,25199.37,88996.465685.46,29997.140995.3 Missing130.000.060.100.010.000.0^a^ *CS *Cesarean Section, ^b^*VE *Vacuum Extraction, ^c^*BMI *Body Mass Index
Tables 3, 4, 5, 6, 7 and 8 present UApH reference values according to mode of birth and GA in weeks. In vaginal non-instrumental births, a clear trend of decreasing UApH was found with advancing GA. The median UApH value for preterm births was 7.300 and for postterm births 7.220 (Table 3). In elective CS a similar trend was found but to a lesser extent, with a median arterial pH of 7.300 in preterm infants and 7.287 in late term gestations (Table 4). For emergency CS, median UApH for preterm gestations was 7.290 and 7.270 for postterm gestations (Table 5). Reference values for immediate CS were less consistent. However, a decline in median UApH with advancing GA was still found: 7.210 for preterm and 7.190 for postterm infants (Table 6). Consistent paradoxical trends between GA and UApH were found in the reference values for VE births, with a median UApH in preterm births was 7.190 compared to 7.160 in postterm births (Table 7). For forceps-assisted births, a decrease was found in UApH comparing preterm births (Median = 7.180) to late term gestations (Median = 7.145) (Table 8). However, for postterm gestations, median UApH was 7.170.
Table 3. Reference values for umbilical cord arterial pH for vaginal non-instrumental births relative to gestational age at birthGestational age (weeks^+days^) N 2.5th5thPercentiles (UApH^a^)50th (Median)95th97.5thMean (UApH)Total80,9577.0707.1007.2407.3507.3707.236< 32^+ 0^–36^+ 6^3,3937.0807.1597.3007.4127.4417.28937^+ 0^–37^+ 6^4,2047.0807.1157.2537.3607.3807.24738^+ 0^–38^+ 6^10,6967.0907.1207.2507.3607.3807.24639^+ 0^–39^+ 6^21,8077.0707.1107.2507.3507.3707.24140^+ 0^–40^+ 6^24,2477.0707.1007.2407.3507.3707.23241^+ 0^–41^+ 6^12,8837.567.0907.2307.3407.3607.223≥ 42^+ 0^3,7277.0407.0707.2207.3307.3507.212^a^*UApH *Umbilical cord arterial pH
Table 4. Reference values for umbilical cord arterial pH for elective Cesarean sections relative to gestational age at birthGestational age (weeks^+days^) N 2.5th5thPercentiles (UApH^a^)50th (Median)95th97.5thMean (UApH)Total6,2957.1107.1607.2907.3507.3607.279< 32^+ 0^–36^+ 6^2437.1317.1827.3007.3507.3707.28737^+ 0^–37^+ 6^6527.1037.1707.2907.3407.3507.27738^+ 0^–38^+ 6^38507.1107.1627.2907.3507.3607.28039^+ 0^–39^+ 6^12097.1007.1607.2907.3507.3607.27940^+ 0^–40^+ 6^1827.0797.1207.2907.3427.3507.27341^+ 0^–41^+ 6^877.0627.1117.2877.3567.3767.269≥ 42^+ 0^727.1857.2007.2917.3447.3597.289^a^*UApH *Umbilical cord arterial pH
Table 5. Reference values for umbilical cord arterial pH for emergency Cesarean sections relative to gestational age at birthGestational age (weeks^+days^) N 2.5th5thPercentiles (UApH^a^)50th (Median)95th97.5thMean (UApH)Total8,1807.0507.1107.2767.3507.3607.260< 32^+ 0^–36^+ 6^1,2937.0307.1007.2907.3517.3617.27037^+ 0^–37^+ 6^6477.0627.1307.2907.3507.3607.27238^+ 0^–38^+ 6^9617.0707.1307.2807.3507.3607.26539^+ 0^–39^+ 6^1,1917.0387.0907.2707.3407.3607.25340^+ 0^–40^+ 6^1,6487.0607.1077.2707.3407.3507.25341^+ 0^–41^+ 6^1,4757.0597.1107.2707.3407.3507.250≥ 42^+ 0^9657.0307.1107.2707.3407.3507.252^a^*UApH *Umbilical cord arterial pH
Table 6. Reference values for umbilical cord arterial pH for immediate Cesarean sections relative to gestational age at birthGestational age (weeks^+days^) N 2.5th5thPercentiles (UApH^a^)50th (Median)95th97.5thMean (UApH)Total7686.8236.8957.1807.3107.3307.155< 32^+ 0^–36^+ 6^886.6896.7307.2107.3267.3507.15837^+ 0^–37^+ 6^366.7906.8337.1457.332-7.13538^+ 0^–38^+ 6^696.8606.8767.1707.3057.3287.15039^+ 0^–39^+ 6^1376.8746.9207.1907.3207.3387.15840^+ 0^–40^+ 6^1696.7836.8907.1807.3007.3407.15441^+ 0^–41^+ 6^1586.8336.9007.1707.3107.3207.149≥ 42^+ 0^1116.8767.0107.1907.3007.3327.170Groups with too few cases did not yield any results^a^*UApH *Umbilical cord arterial pH
Table 7. Reference values for umbilical cord arterial pH for instrumental vaginal births using vacuum extraction relative to gestational age at birthGestational age (weeks^+days^) N 2.5th5thPercentiles (UApH^a^)50th (Median)95th97.5thMean (UApH)Total6,4866.9907.0207.1707.2907.3197.166< 32^+ 0^–36^+ 6^1917.0287.0507.1907.3107.3307.19037^+ 0^–37^+ 6^2686.9907.0327.1907.3297.3507.18338^+ 0^–38^+ 6^5676.9907.0207.1807.2907.3207.17239^+ 0^–39^+ 6^13626.9877.0217.1707.3017.3207.17040^+ 0^–40^+ 6^20026.9907.0207.1707.2907.3107.16441^+ 0^–41^+ 6^14746.9897.0307.1707.2807.3107.162≥ 42^+ 0^6227.0007.0307.1607.2787.2907.157^a^*UApH *Umbilical cord arterial pH
Table 8. Reference values for umbilical cord arterial pH for instrumental vaginal births using forceps relative to gestational age at birthGestational age (weeks^+days^) N 2.5th5thPercentiles (UApH^a^)50th (Median)95th97.5thMean (UApH)Total4296.9687.0007.1707.3007.3207.160<32^+ 0^–36^+ 6^217.0007.0007.1807.280-7.16737^+ 0^–37^+ 6^196.9006.9007.160--7.15638^+ 0^–38^+ 6^356.8506.9787.1507.326-7.14739^+ 0^–39^+ 6^956.9806.9987.1707.3207.3387.16340^+ 0^–40^+ 6^1346.9937.0207.1807.2907.3067.17441^+ 0^–41^+ 6^886.8176.9447.1457.2867.3077.141≥ 42^+ 0^376.9397.9497.1707.311-7.157Groups with too few cases did not yield any results^a^*UApH *Umbilical cord arterial pH
Comparable total UApH values were observed for vaginal non-instrumental births, elective as well as emergency CS. Median UApH for vaginal non-instrumental births was 7.240, 7.290 for elective CS, and 7.276 for emergency CS. Consequently, lower values of UApH were found in infants born by immediate CS (Median = 7.180), VE (Median = 7.170), and forceps-assisted births (Median = 7.170). One-way ANOVA showed significant differences in UApH across modes of birth disregarding GA (P < 0.001).
Simple linear regression investigating changes in UApH with increasing GA at birth showed a negative linear relationship across all modes of birth but one, immediate CS (Table 9). A significant decrease in UApH was observed with increasing GA in vaginal non-instrumental births, emergency CS and VE births. When adjusting for birth weight in the multiple regression analyses, significant negative associations remained. There was a small increase in R^2^ indicating that birth weight as a predictor accounted for a small proportion of the variance in UApH and GA accounted for the majority.
Table 9. Simple and multiple linear regression analysis showing influence of gestational age (days) on umbilical cord arterial pH in each mode of birthUnadjustedAdjusted^a^ N Coefficient95% CI^b^P-value R ^2^ Coefficient95% CIP-value R ^2^ Vaginal non-instrumental80,957− 0.0009− 0.0010 to− 0.0009< 0.0010.016− 0.0008− 0.0008 to− 0.0007< 0.0010.017CS^c^ elective6,295− 0.0002− 0.0004 to 0.000040.1090.0000.00002− 0.00001 to 0.00040.0650.007CS emergency8,180− 0.0004− 0.0004 to− 0.0003< 0.0010.008− 0.0005− 0.0006 to− 0.0004< 0.0010.009CS immediate7680.00001− 0.0005 to 0.00050.9830.0000.0002− 0.0006 to 0.00090.6620.001Vaginal VE^d^6,486− 0.0007− 0.0009 to− 0.0005< 0.0010.008− 0.0009− 0.0011 to− 0.0007< 0.0010.009Vaginal forceps429− 0.0003− 0.0010 to 0.00040.4090.002− 0.0005− 0.0014 to 0.00030.2300.004^a^Adjusted for birth weight, ^b^*CI *Confidence interval, ^c^*CS *Cesarean section, ^d^*VE *Vacuum extraction
Discussion
In this large population-based study, we examined changes in UApH across modes of birth in preterm, term, and postterm gestations. Reference values for UApH were provided and UApH was found to decrease linearly with increasing GA in normal vaginal births, emergency CS, and VE births. As expected, infants undergoing immediate CS, VE, or forceps-assisted births demonstrated lower UApH values compared to those born by vaginal non-instrumental births, elective CS, or emergency CS. Previous research has shown that umbilical cord blood pH changes with advancing GA [8, 9, 20, 22, 23]. However, the study settings were limited to vaginal non-instrumental births, where several exclusion criteria were applied to ensure the inclusion of only vigorous infants [8, 9, 20, 22]. In contrast, this study included infants in all clinical states, intending to represent the distribution of a general population. Currently, a literature gap exists regarding reference values for UApH according to the mode of birth of the infant and the mechanisms in which GA impacts umbilical cord pH. This study revealed comparable median values for ‘normal’ vaginal births, elective and emergency CS. Lower values were observed for immediate CS, VE, and forceps-assisted births. Vaginal births, including both non-instrumental and instrumental, have been shown to have lower UApH as compared to elective CS compared to emergency CS [8, 18, 23]. Kotaska et al. re-evaluated reference ranges for UApH and found no significant differences in values in infants born by non-instrumental vaginal birth compared with CS.^19^ Nickelsen et al. demonstrated more acidotic values in infants born by instrumental vaginal births and higher UApH values in CS than in spontaneously born infants [24]. A suggested explanation for the higher UApH following CS is that all CS were performed before the start of the active phase of labor, excluding the mother actively pushing, thereby decreasing the anaerobic effort in birth on the infant, since acidemia has been found to increase with the length of the second stage of labor [9, 24]. A study conducted by Prior et al. showed that modes of birth independently influence the condition of the infant at birth, with worst outcomes observed in instrumental vaginal births due to fetal compromise interpreted through a cardiotocograph compared to vaginal non-instrumental birth and emergency CS.^25^ Instrumental vaginal births have previously been associated with worse outcomes in infants at birth [25]. Furthermore, as previously mentioned, UApH values below 7.00 have been strongly associated with worse neonatal outcomes, with an increased risk showing at 7.05 [14, 26]. In accordance with the literature, we found that infants born by instrumental vaginal births were more acidotic, with a greater proportion of acidemia < 7.00 at higher percentiles, a clinically relevant association. Moreover, higher incidences of low and moderately abnormal Apgar scores were found in these groups compared to the total population. Therefore, lower ranges of UApH in infants born through instrumental births or immediate CS are presumed to reflect infants with compromised conditions in our cohort. To investigate this further, associations with neonatal outcomes should be examined.
Clinical relevance
There is no consensus regarding the appropriate UApH cutoff value for what is considered fetal acidosis at birth. Different definitions exist in the literature and range most commonly between values of 7.00 to 7.20 [14, 16, 17, 26–28]. The use of stationary values clinically for infants of all GA has been questioned previously, and our findings of differences across modes of births and GA-related changes in UApH align with this reasoning [22]. The decline in UApH with advancing pregnancy means that higher UApH values are expected in premature infants, implying risk of underdiagnosing birth asphyxia in this preterm population. However, clinical indications for interventions, i.e., modes of birth deviating from vaginal non-instrumental births, are not reported and therefore this study presents correlation of UApH to mode of birth, not causal relationships. As expected, effect sizes were relatively small, with UApH decreasing with − 0.0008 (95%CI − 0.0008 - − 0.0007) per day for vaginal non-instrumental birth compared to emergency CS − 0.0005 (95%CI − 0.0006 - − 0.0004), suggesting limited clinical significance. To our knowledge, there is no literature studying the combined changes of UApH according to both GA and mode of birth. The establishment of reference values has significant clinical importance as they will help facilitate the correct evaluation of UApH in infants and contribute to enhanced obstetric management. Our study takes steps toward bringing clarity to the controversy of what is deemed a ‘normal’ and ‘abnormal’ UApH at birth. However, this study has not compared UApH to neonatal outcomes, which is relevant for determining pathological cut-offs. Therefore, further research is required to investigate the effect mode of birth and GA have on UApH and correlate it to neonatal outcomes.
Strengths and limitations
The main strength of this study lies in the use of a large and robust cohort, which accurately represents the general population. Swedish healthcare registries are commonly acknowledged for holding high quality [29]. When similar studies have been conducted in the past, strict exclusion criteria were applied ensuring a healthy population and resulting in too few cases of extreme prematurity. In this study, our approach aimed to represent an actual population by including infants of all clinical states. The inclusion of all modes of birth and infants of all Apgar scores resulted in a sufficiently large cohort allowing the inclusion of extremely premature infants. However, since the cohort reflects the population of mothers and infants in the south of Sweden from 1995 to 2015, there is an inherent uneven distribution of groups according to mode of birth, leading to less reliable results in the groups with fewer numbers. As covariate, BMI was previously not reported for all births to the database, with 40% missing values in our study population. This may introduce bias if missingness was not completely at random and should be considered when interpreting the results. Cord blood sampling has been a routine procedure in Skåne since 1981. Strict validation of all umbilical cord pH values adds strength by excluding potentially faulty values that otherwise may have skewed the results. In this study, birth weight was considered and adjusted for the statistics as a potential confounder. Another limitation is that effect modifiers were not considered in this study.
Conclusions
This study evaluated UApH across the different modes of birth commonly seen in the clinical setting and stratified changes in UApH according to GA at birth in a population of 103,115 infants. UApH was found to decrease linearly with GA in vaginal non-instrumental births, emergency CS, and VE births. Infants born by immediate CS, VE or forceps-assisted births were found to be more acidotic. Detailed reference values were provided for different GA across each mode of birth which can be used in clinical practice. Further research investigating the influence mode of birth has on UApH and associating the current findings with neonatal outcomes is required to gain more understanding and to clinical management of birth.
The reference list from the paper itself. Each links out to its DOI / PubMed record.
- 1World Health Organization. Perinatal asphyxia [Internet]. Geneva: World Health Organization; [cited 2023 Dec 23]. Available from: https://www.who.int/teams/maternal-newborn-child-adolescent-health-and-ageing/newborn-health/perinatal-asphyxia