Analysis of Factors Affecting Child Nutrition in Nepal Using the Nepal Demographic and Health Survey 2022
Seeta Baral, Minato Nakazawa

TL;DR
This study uses Nepal's 2022 health survey data to explore factors like age, wealth, and maternal health that affect child nutrition, focusing on under-nutrition indicators like stunting and underweight.
Contribution
The study provides updated insights into child nutrition in Nepal using the latest NDHS data and examines the role of complementary feeding practices in under-nutrition.
Findings
Children aged 12-23 months had significantly higher odds of stunting.
Better household economic status was associated with lower odds of stunting.
Children perceived as very small at birth had higher odds of stunting and underweight.
Abstract
Background Child malnutrition remains a major public health problem globally, including in Nepal. Previous studies reported that low maternal body mass index, maternal education, wealth status, anemia, low birth weight, etc., are significant predictors of childhood under-nutrition. However, child feeding practices/complementary feeding, in multivariable models specific to each anthropometric outcome, have not been explored. This study, using updated information from the Nepal Demographic and Health Survey (NDHS) 2022, will address child factors such as feeding practices, especially focusing on complementary feeding of younger children, along with other birth factors, parental factors, and socioeconomic factors. Methods This study used nationally representative data from the NDHS 2022, where a total of 629 children aged 6-23 months were selected for analysis. Three anthropometric…
Genes, proteins, chemicals, diseases, species, mutations and cell lines named across the full text — each resolved to its canonical identifier and authoritative record.
Click any figure to enlarge with its caption.
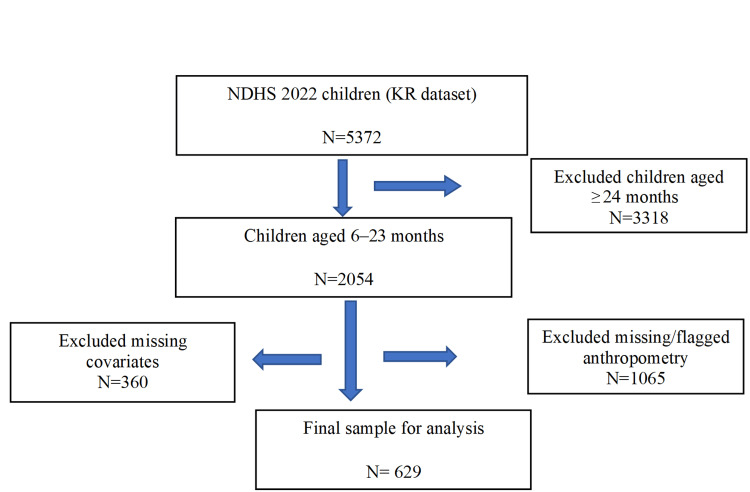 Figure 1
| Variable | Category | n (%) |
| Nutritional status | ||
| Stunting | No | 484 (76.9) |
| Yes | 145 (23.1) | |
| Wasting | No | 564 (89.7) |
| Yes | 65 (10.3) | |
| Underweight | No | 508 (80.8) |
| Yes | 121 (19.2) | |
| Child characteristics | ||
| Sex (B4) | Male | 338 (53.7) |
| Female | 291 (46.3) | |
| Age (months) | 6–11 | 192 (30.5) |
| 12–23 | 437 (69.5) | |
| Recent diarrhea (last 2 weeks) (H11) | No | 524 (83.3) |
| Yes | 105 (16.7) | |
| Birth order (Bord) | Low birth order | 562 (89.3) |
| High birth order | 67 (10.7) | |
| Birth size (M18) | Very large | 18 (2.9) |
| Larger than average | 68 (10.8) | |
| Average | 463 (73.6) | |
| Smaller than average | 60 (9.5) | |
| Very small | 20 (3.2) | |
| Feeding frequency (FF) | Adequate | 532 (84.6) |
| Inadequate | 97 (15.4) | |
| Minimum dietary diversity score (MDDS) | Not met criterion | 335 (53.3) |
| Met criterion | 294 (46.7) | |
| Maternal characteristics | ||
| Mother’s education (V106) | No education | 112 (17.8) |
| Basic | 225 (35.8) | |
| Secondary | 269 (42.8) | |
| Higher | 23 (3.7) | |
| Maternal BMI (MBMI) | Low BMI | 109 (17.3) |
| Normal | 409 (65.0) | |
| Overweight | 95 (15.1) | |
| Obese | 16 (2.5) | |
| Mother’s age | 15-24 years | 317 (50.4) |
| 25-34 years | 276 (43.9) | |
| 35-49 years | 36 (5.7) | |
| Paternal characteristics | ||
| Father’s education (V701) | No education | 53 (8.4) |
| Basic | 248 (39.4) | |
| Secondary | 289 (45.9) | |
| Higher | 39 (6.2) | |
| Wealth index (V190) | Poorest | 210 (33.4) |
| Poorer | 142 (22.6) | |
| Middle | 110 (17.5) | |
| Richer | 99 (15.7) | |
| Richest | 68 (10.8) | |
| Region (V101) | Koshi | 101 (16.1) |
| Madhesh | 113 (18.0) | |
| Bagmati | 67 (10.7) | |
| Gandaki | 42 (6.7) | |
| Lumbini | 99 (15.7) | |
| Karnali | 118 (18.8) | |
| Sudurpashchim | 89 (14.1) | |
| Model Coefficients for Stunting (N= 629) | 95% Confidence Interval | ||||||
| Predictor | Estimate | SE | Z | p | OR | Lower | Upper |
| Intercept | -0.745 | 0.633 | -1.177 | 0.239 | 0.475 | 0.137 | 1.641 |
| Sex (B4), Ref: male | |||||||
| Female | -0.156 | 0.22 | -0.708 | 0.479 | 0.856 | 0.556 | 1.317 |
| Child age, Ref: 6-11 months | |||||||
| 12-23 months | 1.327 | 0.299 | 4.434 | < 0.001 | 3.768 | 2.096 | 6.774 |
| Recently had diarrhea (H11), Ref: No diarrhea | |||||||
| Yes, within the last two weeks | -0.167 | 0.299 | -0.558 | 0.577 | 0.846 | 0.471 | 1.52 |
| Birth order (Bord), Ref: low birth order | |||||||
| High birth order | 0.625 | 0.372 | 1.681 | 0.093 | 1.867 | 0.901 | 3.868 |
| Birth size (M18), Ref: average | |||||||
| Very large | -1.379 | 0.854 | -1.616 | 0.106 | 0.252 | 0.047 | 1.342 |
| Larger than average | -0.548 | 0.375 | -1.463 | 0.143 | 0.578 | 0.277 | 1.204 |
| Smaller than average | 0.217 | 0.351 | 0.617 | 0.537 | 1.242 | 0.624 | 2.474 |
| Very small | 1.802 | 0.553 | 3.258 | 0.001 | 6.059 | 2.05 | 17.91 |
| Feeding frequency (FF), Ref: adequate | |||||||
| Inadequate | 0.092 | 0.327 | 0.281 | 0.778 | 1.096 | 0.578 | 2.079 |
| Minimum dietary diversity score (MDDS), Ref: not met criterion | |||||||
| Met criterion | 0.317 | 0.238 | 1.329 | 0.184 | 1.373 | 0.86 | 2.191 |
| Maternal BMI (MBMI), Ref: normal | |||||||
| Low BMI | 0.385 | 0.277 | 1.391 | 0.164 | 1.469 | 0.854 | 2.527 |
| Overweight | 0.08 | 0.355 | 0.226 | 0.821 | 1.084 | 0.541 | 2.172 |
| Obese | -0.657 | 1.108 | -0.593 | 0.553 | 0.519 | 0.059 | 4.548 |
| Mother’s education (V106), Ref: no education | |||||||
| Basic | -0.768 | 0.325 | -2.366 | 0.018 | 0.464 | 0.245 | 0.877 |
| Secondary | -1.682 | 0.379 | -4.443 | < 0.001 | 0.186 | 0.089 | 0.391 |
| Higher | -2.907 | 1.202 | -2.419 | 0.016 | 0.055 | 0.005 | 0.576 |
| Mother's age, Ref: 15-24 years | |||||||
| 25-34 years | -0.55 | 0.248 | -2.22 | 0.026 | 0.577 | 0.355 | 0.938 |
| 35-49 years | -1.342 | 0.567 | -2.365 | 0.018 | 0.261 | 0.086 | 0.795 |
| Father's education (V701), Ref: no education | |||||||
| Basic | 0.076 | 0.4 | 0.19 | 0.849 | 1.079 | 0.493 | 2.361 |
| Secondary | 0.304 | 0.429 | 0.707 | 0.48 | 1.355 | 0.584 | 3.143 |
| Higher | 0.849 | 0.75 | 1.132 | 0.258 | 2.338 | 0.537 | 10.175 |
| Wealth index (V190), Ref: poorest | |||||||
| Poorer | -0.844 | 0.315 | -2.675 | 0.007 | 0.43 | 0.232 | 0.798 |
| Middle | -0.865 | 0.381 | -2.268 | 0.023 | 0.421 | 0.199 | 0.889 |
| Richer | -0.661 | 0.376 | -1.758 | 0.079 | 0.516 | 0.247 | 1.079 |
| Richest | -1.53 | 0.58 | -2.637 | 0.008 | 0.217 | 0.069 | 0.675 |
| Regions* (V101), Ref: Bagmati | |||||||
| Koshi | -0.958 | 0.507 | -1.891 | 0.059 | 0.384 | 0.142 | 1.035 |
| Madhesh | 0.073 | 0.476 | 0.153 | 0.878 | 1.076 | 0.423 | 2.737 |
| Gandaki | 0.378 | 0.534 | 0.708 | 0.479 | 1.459 | 0.513 | 4.152 |
| Lumbini | 0.286 | 0.459 | 0.624 | 0.533 | 1.332 | 0.542 | 3.273 |
| Karnali | 0.091 | 0.455 | 0.199 | 0.842 | 1.095 | 0.449 | 2.67 |
| Sudurpashchim | -0.849 | 0.512 | -1.658 | 0.097 | 0.428 | 0.157 | 1.167 |
| Model Coefficients; Wasting (N=629) | 95% Confidence Interval | ||||||
| Predictor | Estimate | SE | Z | p | OR | Lower | Upper |
| Intercept | -2.761 | 0.859 | -3.212 | 0.001 | 0.063 | 0.012 | 0.341 |
| Sex (B4), Ref: male | |||||||
| Female | -0.396 | 0.297 | -1.333 | 0.183 | 0.673 | 0.376 | 1.205 |
| Child age, Ref: 6-11 months | |||||||
| 12-23 months | 0.2 | 0.347 | 0.577 | 0.564 | 1.222 | 0.619 | 2.412 |
| Recently had diarrhea (H11), Ref: No diarrhea | |||||||
| Yes, last two weeks | 0.514 | 0.347 | 1.482 | 0.138 | 1.672 | 0.847 | 3.299 |
| Birth order (Bord), Ref: low birth order | |||||||
| High birth order | 0.852 | 0.478 | 1.783 | 0.075 | 2.345 | 0.919 | 5.982 |
| Birth size (M18), Ref: average | |||||||
| Very large | 0.173 | 0.876 | 0.198 | 0.843 | 1.189 | 0.214 | 6.616 |
| Larger than average | -1.681 | 0.788 | -2.132 | 0.033 | 0.186 | 0.04 | 0.873 |
| Smaller than average | 0.518 | 0.428 | 1.208 | 0.227 | 1.678 | 0.725 | 3.884 |
| Very small | 0.372 | 0.641 | 0.58 | 0.562 | 1.451 | 0.413 | 5.099 |
| Feeding frequency (FF), Ref: adequate | |||||||
| Inadequate | 0.576 | 0.377 | 1.527 | 0.127 | 1.779 | 0.849 | 3.725 |
| Minimum dietary diversity score (MDDS), Ref: not met criterion | |||||||
| Met criterion | -0.028 | 0.325 | -0.087 | 0.931 | 0.972 | 0.514 | 1.839 |
| Maternal BMI (MBMI), Ref: normal | |||||||
| Low BMI | 1.284 | 0.332 | 3.87 | <0.001 | 3.611 | 1.884 | 6.92 |
| Overweight | -0.054 | 0.494 | -0.11 | 0.913 | 0.947 | 0.36 | 2.493 |
| Obese | -14.487 | 927.77 | -0.016 | 0.988 | 0 | 0 | Inf |
| Mother’s education (V106), Ref: no education | |||||||
| Basic | -0.44 | 0.434 | -1.015 | 0.31 | 0.644 | 0.275 | 1.506 |
| Secondary | -1.299 | 0.497 | -2.614 | 0.009 | 0.273 | 0.103 | 0.722 |
| Higher | -1.441 | 1.008 | -1.43 | 0.153 | 0.237 | 0.033 | 1.707 |
| Mother's age, Ref: 15-24 years | |||||||
| 25-34 years | 0.113 | 0.322 | 0.351 | 0.726 | 1.12 | 0.595 | 2.106 |
| 35-49 years | -0.818 | 0.724 | -1.13 | 0.258 | 0.441 | 0.107 | 1.824 |
| Father's education (V701), Ref: no education | |||||||
| Basic | 0.157 | 0.577 | 0.272 | 0.785 | 1.17 | 0.378 | 3.623 |
| Secondary | 1.271 | 0.612 | 2.077 | 0.038 | 3.564 | 1.075 | 11.82 |
| Higher | 2.433 | 0.852 | 2.854 | 0.004 | 11.395 | 2.143 | 60.582 |
| Wealth index (V190), Ref: poorest | |||||||
| Poorer | 0.113 | 0.417 | 0.27 | 0.787 | 1.119 | 0.494 | 2.534 |
| Middle | -0.078 | 0.491 | -0.158 | 0.874 | 0.925 | 0.353 | 2.424 |
| Richer | -0.328 | 0.518 | -0.633 | 0.527 | 0.72 | 0.261 | 1.988 |
| Richest | -0.286 | 0.629 | -0.455 | 0.649 | 0.751 | 0.219 | 2.577 |
| Regions* (V101), Ref: Bagmati | |||||||
| Koshi | -0.728 | 0.708 | -1.028 | 0.304 | 0.483 | 0.121 | 1.935 |
| Madhesh | -0.143 | 0.652 | -0.22 | 0.826 | 0.867 | 0.242 | 3.108 |
| Gandaki | 0.059 | 0.75 | 0.079 | 0.937 | 1.061 | 0.244 | 4.615 |
| Lumbini | 0.885 | 0.6 | 1.474 | 0.141 | 2.423 | 0.747 | 7.858 |
| Karnali | -0.591 | 0.679 | -0.87 | 0.384 | 0.554 | 0.146 | 2.096 |
| Sudurpashchim | -0.216 | 0.641 | -0.336 | 0.737 | 0.806 | 0.229 | 2.834 |
| Model Coefficients; Underweight (N=629) | 95% Confidence Interval | ||||||
| Predictor | Estimate | SE | Z | p | OR | Lower | Upper |
| Intercept | -1.732 | 0.686 | -2.523 | 0.012 | 0.177 | 0.046 | 0.679 |
| Sex (B4), Ref: male | |||||||
| Female | 0.186 | 0.228 | 0.816 | 0.414 | 1.204 | 0.771 | 1.881 |
| Child age, Ref: 6-11 months | |||||||
| 12-23 months | 0.461 | 0.274 | 1.685 | 0.092 | 1.586 | 0.928 | 2.713 |
| Recently had diarrhea (H11), Ref: No diarrhea | |||||||
| Yes, last two weeks | 0.476 | 0.285 | 1.673 | 0.094 | 1.610 | 0.921 | 2.814 |
| Birth order (Bord), Ref: low birth order | |||||||
| High birth order | 0.504 | 0.388 | 1.298 | 0.194 | 1.656 | 0.773 | 3.545 |
| Birth size (M18), Ref: average | |||||||
| Very large | -0.553 | 0.850 | -0.651 | 0.515 | 0.575 | 0.109 | 3.044 |
| Larger than average | -0.423 | 0.404 | -1.048 | 0.295 | 0.655 | 0.297 | 1.445 |
| Smaller than average | 0.499 | 0.351 | 1.421 | 0.155 | 1.647 | 0.828 | 3.277 |
| Very small | 1.837 | 0.569 | 3.227 | 0.001 | 6.279 | 2.057 | 19.168 |
| Feeding frequency (FF), Ref: adequate | |||||||
| Inadequate | 0.115 | 0.319 | 0.362 | 0.718 | 1.122 | 0.601 | 2.096 |
| Minimum dietary diversity score (MDDS), Ref: not met criterion | |||||||
| Met criterion | -0.189 | 0.253 | -0.749 | 0.454 | 0.828 | 0.504 | 1.358 |
| Maternal BMI (MBMI), Ref: normal | |||||||
| Low BMI | 0.836 | 0.271 | 3.085 | 0.002 | 2.307 | 1.356 | 3.925 |
| Overweight | -0.359 | 0.404 | -0.888 | 0.374 | 0.698 | 0.316 | 1.543 |
| Obese | -14.787 | 530.946 | -0.028 | 0.978 | 0.000 | 0.000 | Inf |
| Mother’s education (V106), Ref: no education | |||||||
| Basic | -0.488 | 0.337 | -1.450 | 0.147 | 0.614 | 0.317 | 1.187 |
| Secondary | -1.237 | 0.389 | -3.177 | 0.001 | 0.290 | 0.135 | 0.623 |
| Higher | -2.058 | 1.153 | -1.786 | 0.074 | 0.128 | 0.013 | 1.222 |
| Mother's age, Ref: 15-24 years | |||||||
| 25-34 years | 0.152 | 0.252 | 0.603 | 0.547 | 1.164 | 0.711 | 1.905 |
| 35-49 years | -1.171 | 0.648 | -1.809 | 0.070 | 0.310 | 0.087 | 1.103 |
| Father's education (V701), Ref: no education | |||||||
| Basic | -0.331 | 0.411 | -0.805 | 0.421 | 0.718 | 0.321 | 1.608 |
| Secondary | 0.472 | 0.440 | 1.075 | 0.283 | 1.604 | 0.678 | 3.796 |
| Higher | 0.533 | 0.728 | 0.732 | 0.464 | 1.703 | 0.409 | 7.091 |
| Wealth index (V190), Ref: poorest | |||||||
| Poorer | -0.191 | 0.325 | -0.587 | 0.557 | 0.826 | 0.437 | 1.563 |
| Middle | -0.251 | 0.383 | -0.654 | 0.513 | 0.778 | 0.367 | 1.649 |
| Richer | -0.255 | 0.397 | -0.643 | 0.520 | 0.775 | 0.356 | 1.688 |
| Richest | -0.831 | 0.554 | -1.500 | 0.134 | 0.436 | 0.147 | 1.290 |
| Regions* (V101), Ref: Bagmati | |||||||
| Koshi | -0.336 | 0.583 | -0.575 | 0.565 | 0.715 | 0.228 | 2.243 |
| Madhesh | 0.754 | 0.544 | 1.387 | 0.165 | 2.126 | 0.732 | 6.174 |
| Gandaki | 0.841 | 0.617 | 1.364 | 0.173 | 2.319 | 0.693 | 7.769 |
| Lumbini | 0.978 | 0.529 | 1.849 | 0.064 | 2.659 | 0.943 | 7.498 |
| Karnali | -0.015 | 0.557 | -0.027 | 0.979 | 0.985 | 0.330 | 2.938 |
| Sudurpashchim | -0.144 | 0.574 | -0.251 | 0.802 | 0.866 | 0.281 | 2.664 |
Peer Reviews
No public reviews on file for this paper yet. If you reviewed it on a platform where reviews are public (OpenReview, ICLR, NeurIPS, ICML), you can paste yours below so the community can read it here.
Videos
No videos yet. Explain this paper in a talk, walkthrough, or lecture? Add one.
Taxonomy
TopicsChild Nutrition and Water Access · Breastfeeding Practices and Influences · Iron Metabolism and Disorders
Introduction
Good nutrition sets children on the path to grow, develop, learn, and reach their full potential. Despite significant progress over the past two decades, child malnutrition still remains a major problem worldwide. In 2024, among children under the age of five years worldwide, 23.2% (150.2 million) experienced stunting, 6.6% (42.8 million) experienced wasting, and 5.5% (35.5 million) were overweight. Nearly two out of five children with stunted growth and more than half of all children affected by wasting live in South Asia, and most children categorized as overweight live in Asia and Africa [1]. Sustainable Development Goal (SDG) 2 aims to end hunger, achieve food security and improved nutrition, and promote sustainable agriculture by 2030. But the triple burden of malnutrition - under-nutrition, hidden hunger, and overweight - adversely affects the survival, growth, and development of children and young people [2].
Although Nepal has made significant progress in reducing stunting and underweight rates over the past two decades, a high percentage of children remain affected, and there has been no progress on reducing wasting rates [3]. Around 25% of children under five years were stunted, 8% were wasted, and 19% were underweight according to the Nepal Demographic and Health Survey (NDHS) 2022. A study conducted in India [4] revealed that many factors, ranging from socio-economic to child feeding, to hygiene, are associated with the severe acute malnutrition (SAM) status of children. Similarly, in Nepal, factors including birth interval, child birth weight, sanitation and hygiene, birth order in the family, maternal age at birth, size of family, proper infant and young child feeding practices, gender inequality, socioeconomic status, and parental educational level were important determinants of malnutrition among children [5-9]. A previous study conducted by Adhikari RP et al. examined determinants of child malnutrition by analyzing NDHS 2006 to 2016 and highlighted risk factors for stunting, such as household wealth quintiles, mother’s years of schooling, child age, child size at birth, and child anemia [10]. Similarly, a study by Adhikari N et al. involving children up to 23 months of age focused on socio-demographic and household-level factors, such as wealth index, in addition to child-level factors including age, sex, child feeding practices, and breastfeeding, to explain factors affecting the nutritional status of infants and young children [11].
Considering all the known factors associated with nutritional status, appropriate weaning plays a major role in combating malnutrition in the most vulnerable children under two years. The World Health Organization has recommended the initiation of breastfeeding within one hour of birth, exclusive breastfeeding for the first six months, and introduction of nutritionally adequate and safe complementary food at six months together with continuing breastfeeding up to two years of age or beyond [12]. Inadequate timing, poor dietary diversity, and low meal frequency during weaning increase the risk of stunting, wasting, and underweight [13]. A previous study in Nepal [14] demonstrated that minimum dietary diversity and minimum acceptable diet were low among children aged 6-23 months, despite a high rate of timely introduction of solid, semi‐solid, or soft food and minimum meal frequency for both breastfed and non-breastfed children. Although a previous study reported that low maternal BMI, maternal education, wealth quintile, anemia, and low birth weight are significant predictors of childhood under-nutrition (stunting, wasting, and underweight) in 2022, child feeding practices/complementary feeding in multivariable models specific to each anthropometric outcome were not explored [15].
To fill this gap, the present study uses updated information from NDHS 2022 and aims to address child factors such as feeding practices, especially focusing on complementary feeding to younger children, along with other birth factors, parental factors, and socio-economic factors associated with all three nutritional indicators (stunting, wasting, and underweight).
Materials and methods
Study design
Secondary data analysis of Nepal Demographic and Health Survey (NDHS) 2022. NDHS is a nationally representative survey implemented by the Ministry of Health and Population, Nepal, under the Demographic and Health Surveys (DHS) program, which provides standardized and high-quality data on the health of the population, nutrition, and demographic indicators in low- and middle-income countries. The standardized questionnaires and rigorous sampling methods are used to collect DHS data, allowing for comparability across regions and over time. The NDHS dataset is available upon request, and permission to use the data was obtained from the DHS program [16].
Study population
The initial NDHS 2022 dataset included all live births of the interviewed mothers within the five years preceding the survey. For the present analysis, the sample was restricted to children aged 6-23 months, consistent with WHO recommendations for the assessment of infant and young child feeding practices and child anthropometric outcomes. Children with valid anthropometric measurements (height/length and weight) required to compute height-for-age (HAZ), weight-for-height (WHZ), and weight-for-age (WAZ) z-scores based on WHO Child Growth Standards were included [17]. As shown in Figure 1, children with missing anthropometric values, as defined by DHS flag variables, were excluded. Additionally, children with missing data on key explanatory variables, including maternal, paternal, household, and feeding-related characteristics, were excluded from the analysis. After filtering children 6-23 months and excluding children whose anthropometric and other covariate data were missing, the total sample of 629 was retained in the final analysis.
Flow Diagram for Study Sample (NDHS 2022)NDHS: Nepal Demographic and Health Survey; KR: Kids Recode
Variables
Dependent variables
The three anthropometric indicators used to monitor the nutritional status of children were stunting (low Height-for-Age z-score, HAZ), wasting (low Weight-for-Height z-score, WHZ), and underweight (low Weight-for-Age z-score, WAZ). The WHO growth standards were used as the reference, and these indicators were coded as binary variables. From the NDHS data, variables HW70, HW71, and HW72 correspond to HAZ, WHZ, and WAZ, respectively.
Independent variables
Previous studies [18,19] showed an association between parental education and childhood under-nutrition in low- and middle-income countries. Regional variables were incorporated to capture geographic disparities in access to health services, food availability, and infrastructure [13, 15]. Feeding indicators, including minimum dietary diversity and feeding frequency, were included as they represent immediate determinants of nutritional status and have been shown to be significantly associated with child under-nutrition in multiple DHS-based studies [13,14].
For analyzing factors affecting nutritional status among children aged 6-23 months, this study considered several independent child-related variables, including age (HW1), which was recategorized as 6-11 months and 12-23 months; sex (B4); birth order (Bord), recategorized from an integer into ≤3 and ≥4; birth size (M18), categorized as very small, smaller than average, average, larger than average, or very large; and recent history of diarrhea (H11), recorded as yes or no.
Feeding frequency was recoded after adding up the total number of meals the child received by using variables from the NDHS data (children receiving meals ≥4 times were considered adequate, and ≤ 3 times were considered inadequate). The minimum dietary diversity score was calculated by adding up all the food items that were consumed by the child by using the food groups as provided as variables in the NDHS data (children consuming ≥5 food groups were considered to have met the criterion, and if ≤ 5 for those who did not). Feeding frequency and dietary diversity scores were calculated by referring to WHO guidelines for infant and young child feeding [12].
Maternal factors included age (V012: 15-24 years, 25-34 years, 35-49 years), education level (V106: no education, basic, secondary, higher), and BMI (V445: low BMI, normal, overweight, obese). Paternal education (V701) was recategorized after excluding the “don’t know” category and grouped as no education, basic, secondary, and higher. Household factors included wealth index (V190: poorest, poorer, middle, richer, richest) and regions (V101: all provinces).
Data analysis
Descriptive analysis was carried out to describe the background characteristics of children aged 6-23 months. To assess the factors related to child under-nutrition measures, adjusting for potential covariates, binomial logistic regression analysis was applied, which has also been applied in the previous studies using DHS data [9,10,20]. Jamovi software was used for statistical analysis [21].
Results
Table 1 shows the descriptive statistics of the data used for the following analyses. Among the children, 145 (23.1%) were stunted, 65 (10.3%) were wasted, and 121 (19.2%) were underweight. There were more male children than female (n= 338; 53.7%). Most children belonged to the 12-23-month age group (n = 437; 69.5%). The majority of children were perceived to have an average birth size (n = 463; 73.6%). A higher number of children received meals four or more times a day (n=532; 84.6%). Feeding frequency was assessed only among breastfed children, as there were no non-breastfed children in the sample. More than half of the children did not meet the minimum dietary diversity score criteria (n = 335; 53.3%). Regarding maternal characteristics, 112 (17.8%) mothers had no formal education, while 225 (35.8%) and 269 (42.8%) had basic and secondary education, respectively. A few mothers were obese (n = 16; 2.5%). Among fathers, 248 (39.4%) had basic education, and 289 (45.9%) had secondary education. Most children belonged to households in the poorest (n = 210; 33.4%) and poorer (n = 142; 22.6%) wealth categories.
Factors associated with stunting
Table 2 shows the result of the multiple logistic regression analysis for stunting. Children with increasing age showed significantly higher odds of being stunted compared with those in the lower age group (OR = 3.77; 95% CI: 2.10-6.77; p < 0.001). Children with very small perceived birth size had more than six times higher odds of experiencing stunting compared with those with average birth size (OR = 6.06; 95% CI: 2.05-17.91; p = 0.001). Maternal education showed a strong protective association. Compared with mothers with no education, having basic, secondary and higher education had significantly lower odds of stunting ((OR = 0.46; 95% CI: 0.25-0.88; p = 0.018), (OR = 0.19; 95% CI: 0.09-0.39; p < 0.011) and (OR = 0.06; 95% CI: 0.01-0.58; p < 0.016)). Similarly, children born to mothers aged 25-34 years and 35-49 years had significantly lower odds of stunting compared with those born to younger mothers aged 15-24 years (OR = 0.58; 95% CI: 0.36-0.94; p = 0.026) and (OR = 0.26; 95% CI: 0.09-0.80; p = 0.018), respectively. Children from households in the poorer, middle, and richest wealth index had significantly lower odds of stunting compared with those from the poorest households (OR = 0.43; 95% CI: 0.23-0.80; p = 0.007) (OR = 0.42; 95% CI: 0.20-0.89; p = 0.023) and (OR = 0.22; 95% CI: 0.07-0.68; p = 0.008) respectively, while richer group was not statistically significant. Other variables, including child sex, recent diarrhea, feeding frequency, minimum dietary diversity score, and region, were not significant.
Table 2: Binomial logistic regression analysis of factors associated with stuntingNote. Estimates represent the log odds of "Stunting = 1" vs. "No Stunting = 0", odds ratios (OR) with 95% confidence intervals (CI). p < 0.05 was considered statistically significant. provinces*
Factors associated with wasting
Table 3 shows the result of the multiple logistic regression analysis for wasting. Children who were reported as having larger than average birth size were significantly less likely to be wasted compared with those of average birth size (OR = 0.19; 95% CI: 0.04-0.87; p = 0.033). However, there were no statistically significant associations for children perceived as very large, smaller than average or very small at birth. Maternal nutritional status was strongly associated with wasting. Children whose mothers had normal BMI had significantly lower odds of wasting compared with children of low BMI mothers (OR = 3.61; 95% CI: 1.88-6.92; p < 0.001). Children whose mothers had secondary education showed significantly lower odds of wasting compared with the children of mothers with no education (OR = 0.27; 95% CI: 0.10-0.72; p = 0.009). There were no significant associations detected for basic and higher maternal education. Interestingly, children whose fathers had a secondary and higher education had significantly greater odds of wasting compared with those whose fathers had no education (OR = 3.56; 95% CI: 1.08-11.82; p = 0.038), (OR = 11.40; 95% CI: 2.14-60.58; p = 0.004). No significant associations were observed for child age, sex, recent diarrhea, feeding frequency, minimum dietary diversity score, wealth, and regions.
Table 3: Binomial logistic regression analysis of factors associated with wasting Note. Estimates represent the log odds of "Wasting = 1" vs. "No Wasting = 0", odds ratios (OR) with 95% confidence intervals (CI). p < 0.05 was considered statistically significant. provinces*
Factors associated with under-nutrition
Table 4 shows the result of the multiple logistic regression analysis for underweight. Children whose birth size was reported as very small were showing significantly higher odds of being underweight compared with those of average birth size (OR = 6.28; 95% CI: 2.06-19.17; p = 0.001). Similarly, children of mothers with normal BMI had more than two times less odds of being underweight compared with children of lower BMI mothers (OR = 2.31; 95% CI: 1.36-3.93; p = 0.002). Maternal education showed a negative association with underweight. Children whose mothers had secondary level education showed significantly lower odds of being underweight as compared to children from uneducated mothers (OR = 0.29; 95% CI: 0.14-0.62; p = 0.001). Several variables showed borderline significance with underweight. Children in the 12-23 months group have higher odds of being underweight than younger children 6-11 months (p = 0.092). Recent diarrheal illness was also marginally associated with increased odds of underweight (p = 0.094). Similarly, children born to younger mothers, 15-24 years, had higher odds of being underweight compared with those born to mothers aged 35-49 years (p = 0.070). Other covariates, including child sex, maternal age, paternal education, and household wealth, were not significantly associated with underweight, although Lumbini province showed a borderline association (p = 0.064).
Table 4: Binomial logistic regression analysis of factors associated with underweight childrenNote. Estimates represent the log odds of "Underweight = 1" vs. "No Underweight = 0", odds ratios (OR) with 95% confidence intervals (CI). p < 0.05 was considered statistically significant.
Discussion
This study assessed factors associated with nutritional status among 6-23-month-old children who were selected from the NDHS 2022 data. The result of this study shows that perceived child age, birth size, maternal education, maternal age, and household wealth are statistically significant factors for stunting. Perceived birth size, maternal BMI, maternal education, and paternal education are significant factors for wasting. In this study, birth size and maternal factors such as BMI, education, and age are significant factors for under-nutrition.
This study showed that the increasing age of children was significantly associated with stunting. Previous studies, such as [9,22], also supported our results. This might be because stunting is reflected as chronic malnutrition, which can be seen after long-term nutritional deficiencies, whereas wasting is a result of acute under-nutrition. The children who were perceived to be smaller at birth showed a higher probability of stunting, wasting, and underweight as compared to children who were perceived to be bigger. This finding is consistent with other studies, such as [9,20]. The result of this study demonstrates that mothers with a higher education level have a lower probability of their children getting stunting, wasting, and being underweight. It is consistent with the findings from the previous studies conducted in Ethiopia [20], Bangladesh [23], Uganda [24], and Nepal [9]. The reasons might be that educated mothers are more aware of the child care and feeding practices, proper hygiene, greater ability to utilize health care facilities, etc. [25-28].
Unexpectedly, children from fathers with higher education showed higher chances of being wasted than children from fathers with no education. Similar to our finding, a study that performed multi-country analysis in low- and middle-income settings found that higher paternal education was associated with increased odds of certain forms of the double burden of malnutrition compared with no paternal education [18]. Higher education in fathers may be associated with employment patterns that reduce time spent on child care or supervision, particularly in contexts where maternal roles in feeding and caregiving are dominant. Previous studies supporting our finding indicated that maternal education is actually more important for reducing childhood under-nutrition than paternal education [18]. Additionally, the present study also shows that children of fathers with higher education were less likely to be stunted but more likely to be wasted, suggesting these children tend to be taller yet relatively thinner. A divergence between chronic and acute forms of under-nutrition can be assumed. This study demonstrates that children from younger mothers (15-24 years) were more likely to be stunted and underweight than children from older mothers.
The present study also showed that maternal body mass index (BMI) is one of the major determinants of wasting and being underweight, whereas it showed no association with stunting. The children of mothers with normal to higher BMI showed less possibility of getting wasting and underweight than the children of mothers with low BMI. Other studies showed that higher maternal BMI had less risk of stunting and wasting [15,29]. Similarly, household wealth demonstrated a strong association with stunting but not with wasting and being underweight. Consistent with the result from this study, several studies [9,30] have reported findings indicating that wealth enhances food security, dietary diversity, healthcare utilization, sanitation, and overall living conditions, thereby reducing chronic under-nutrition risk.
Feeding frequency and minimum dietary diversity score were expected to be significant predictors of under-nutrition among children aged 6-23 months; however, no significant association was observed. Although these did not show a significant association in this analysis, the weaning period is a critical period for child growth and development. The findings from this study suggest that maternal and household factors strongly influence complementary feeding practices, highlighting the need for integrated nutrition interventions that support both caregivers and children during the weaning period.
Results from this study can be generalized to address populations with similar characteristics and would be useful in reviewing and designing new intervention strategies for further public health research focusing on child malnutrition.
The cross-sectional nature of the NDHS data limits causal inference between identified factors and nutritional outcomes. Perceived birth size may potentially hold recall bias. Furthermore, information on dietary intake and feeding practices was limited to short recall periods and may not fully capture habitual feeding patterns.
Conclusions
The findings of this study showed that the increasing age of children was significantly associated with stunting. Maternal education, maternal age, and maternal BMI were important protective determinants of child under-nutrition. From the findings of this study, complementary feeding practices along with the maternal and household factors may help to minimize child under-nutrition. Strengthening maternal education, improving household economic conditions, delaying early motherhood, improving birth outcomes, and integrating nutrition-sensitive interventions during the weaning period are essential to improve child nutritional outcomes in Nepal.
The reference list from the paper itself. Each links out to its DOI / PubMed record.
- 1UNICEF, WHO, The World Bank. Joint child malnutrition estimates (JME) — levels and trends - 2025 edition 1 2026 2025 https://data.unicef.org/resources/jme/
- 2UNICEF. SDG Goal 2: zero hunger 12 2025 SDG Goal 2: Zero Hunger 2025 https://data.unicef.org/sdgs/goal-2-zero-hunger
- 3UNICEF Nepal. Nutrition 1 2026 2025 https://www.unicef.org/nepal/nutrition
- 4Risk factors for severe acute malnutrition in under-five children: a case-control study in a rural part of India Public Health Ambadekar NN Zodpey SP 13614314220172761322510.1016/j.puhe.2016.07.018 · doi ↗ · pubmed ↗
- 5Determinants of severe acute malnutrition among children under 5 years of age in Nepal: a community-based case-control study BMJ Open Pravana NK Piryani S Chaurasiya SP Kawan R Thapa RK Shrestha S 07201710.1136/bmjopen-2017-017084 PMC 572407528851796 · doi ↗ · pubmed ↗
- 6Determinants of severe acute malnutrition among under 5 children in Satar community of Jhapa, Nepal P Lo S One Dahal K Yadav DK Baral D Yadav BK 016202110.1371/journal.pone.0245151 PMC 785758633534789 · doi ↗ · pubmed ↗
- 7Determinants of malnutrition among children: A systematic review Nutrition Katoch OR 1115659620223506636710.1016/j.nut.2021.111565 · doi ↗ · pubmed ↗
- 8Factors Associated with Underweight among Under-Five Children in Eastern Nepal: Community-Based Cross-sectional Study Front Public Health Adhikari D Khatri RB Paudel YR Poudyal AK 350520172931292010.3389/fpubh.2017.00350 PMC 5743677 · doi ↗ · pubmed ↗