transFusion: a novel comprehensive platform for integration analysis of single-cell and spatial transcriptomics
Weiqiang Lin, Xinyi Xiao, Chuan Qiu, Hui Shen, Hongwen Deng

TL;DR
transFusion is a web-based platform that integrates single-cell and spatial transcriptomics data to analyze tissue organization and interactions with minimal computational expertise.
Contribution
transFusion introduces a comprehensive platform for multimodal integration of scRNA-seq and 10× Visium data with 12 key analytical functions.
Findings
transFusion enables intercellular dependency analysis and ligand–receptor coexpression visualization.
Case studies demonstrated its utility in exploring tissue architecture and spatial gradients with minimal expertise.
The platform supports end-to-end workflows for spatial transcriptomics data integration.
Abstract
Understanding spatial organization, intercellular interactions, and regulatory networks within the spatial context of tissues is crucial for uncovering complex biological processes and disease mechanisms. Spatial transcriptomics technologies have revolutionized this field by enabling the spatially resolved profiling of gene expression. 10× Visium has emerged as the predominant spatial technology, but its low resolution and the complexity of integrating multimodal datasets present significant analytical challenges, particularly for researchers with limited computational and statistical expertise. Current spatial transcriptomics analysis platforms generally fall short of effectively integrating multimodal data and maximizing the utility of spatial information—such as uncovering complex cellular spatial dependencies, multimodal gradient patterns, and spatial coexpression of ligand–receptor…
Genes, proteins, chemicals, diseases, species, mutations and cell lines named across the full text — each resolved to its canonical identifier and authoritative record.
Click any figure to enlarge with its caption.
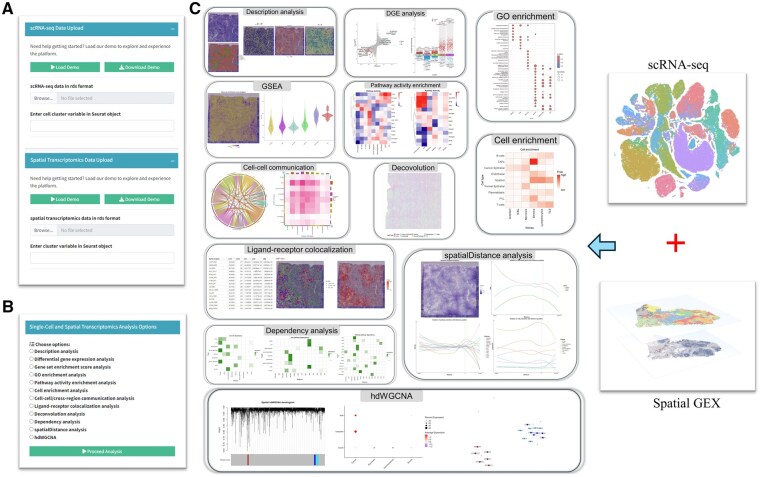 Figure 1
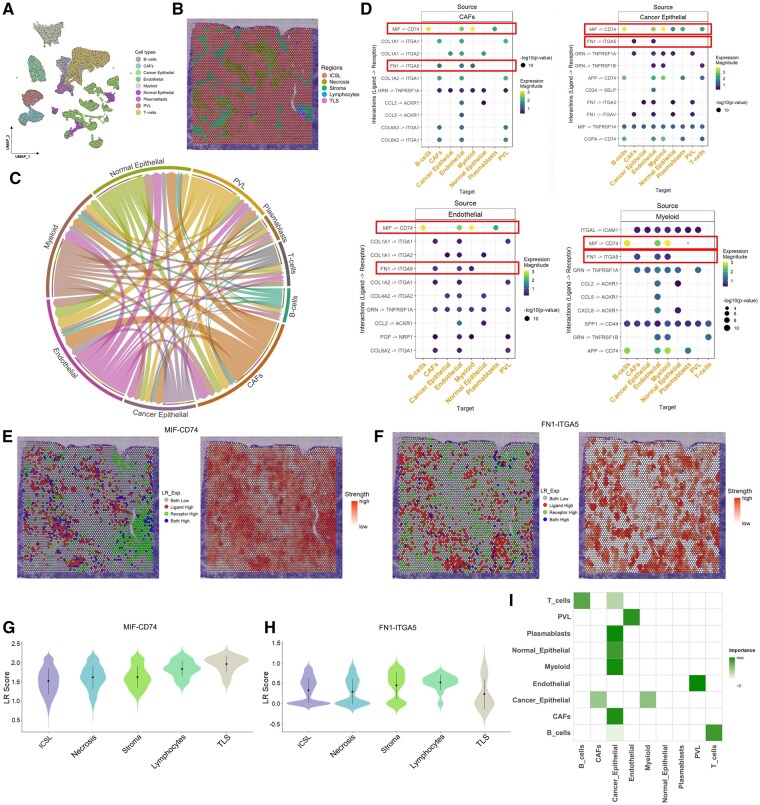 Figure 2
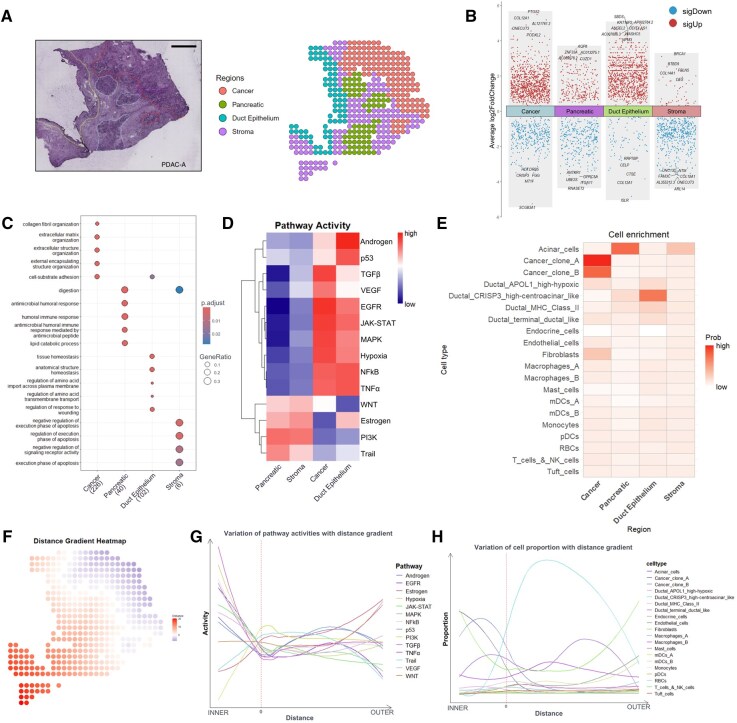 Figure 3
| Analytic methods | transFusion | SpatialTME | Cellar | STExplore | SRT-Server | STellaris | webSCST | Aquila | spatialGE |
|---|---|---|---|---|---|---|---|---|---|
| Descriptive analysis |
|
|
|
|
|
|
| ||
| Differential gene expression (DGE) analysis |
|
|
|
|
|
|
| ||
| Gene set enrichment analysis (GSEA) |
|
|
|
| |||||
| Gene Ontology (GO) enrichment analysis |
|
|
| ||||||
| Pathway activity enrichment analysis |
| ||||||||
| Cell enrichment analysis |
|
|
| ||||||
| Cell–cell and cross-region communication analysis |
|
|
|
|
| ||||
| Ligand–receptor colocalization analysis |
|
| |||||||
| Deconvolution analysis (includes multiple popular deconvolution methods) |
|
| |||||||
| Dependency analysis |
| ||||||||
| spatialDistance analysis |
|
| |||||||
| High-dimensional weighted gene coexpression network analysis (hdWGCNA) |
|
| Analysis module | Description |
|---|---|
| Descriptive analysis | Visualizes gene expression, cell distribution, and pathway activity across spatial regions |
| DGE analysis | Identifies genes with differential expression across conditions or regions |
| GSEA | Assesses groups of genes to determine significant enrichment in specific biological processes |
| GO enrichment analysis | Explores significant biological processes and functional pathways |
| Pathway activity enrichment analysis | Uncovers important active signaling pathways in distinct regions or clusters |
| Cell enrichment analysis | Identifies the enrichment of cell types across different regions or clusters |
| Cell–cell and cross-region communication analysis | Examines interactions between cells or across spatial regions based on ligand–receptor expression |
| Ligand–receptor colocalization analysis | Detects and visualizes spatially proximate ligand–receptor pairs in ST data |
| Deconvolution analysis | Resolves mixed cell populations within spots to identify the cell-type composition |
| Dependency analysis | Studies the spatial dependency of cells or pathways |
| spatialDistance analysis | Analyzes tissue organization by exploring spatial gradient patterns of cell composition, gene expression, and signaling pathway activity |
| hdWGCNA | Identifies gene coexpression modules, revealing regulatory networks, and biological function modules |
- —National Institutes of Health10.13039/100000002
Peer Reviews
No public reviews on file for this paper yet. If you reviewed it on a platform where reviews are public (OpenReview, ICLR, NeurIPS, ICML), you can paste yours below so the community can read it here.
Videos
No videos yet. Explain this paper in a talk, walkthrough, or lecture? Add one.
Taxonomy
TopicsSingle-cell and spatial transcriptomics · Environmental Monitoring and Data Management · Cell Image Analysis Techniques
1 Introduction
Recent advances in high-throughput sequencing technologies have revolutionized our understanding of tissue complexity at unprecedented molecular resolutions. Single-cell RNA sequencing (scRNA-seq) has emerged as a powerful tool for identifying cellular subtypes, revealing distinct cellular compositions and states (Regev et al. 2017, Stubbington et al. 2017, Birnbaum 2018, Tokura et al. 2022). However, the spatial organization of cells within tissues plays a fundamental role in shaping their function, interaction networks, and contributions to tissue homeostasis, which are often lost in dissociation-based single-cell techniques (Lähnemann et al. 2020). Advances in spatial transcriptomics (ST), such as 10× Visium (Ståhl et al. 2016), Slide-seq (Rodriques et al. 2019), and Stereo-seq (Chen et al. 2022), allow for gene expression profiling while preserving spatial context, offering a more complete picture of tissue biology. The 10× Visium has been recognized as the most popular sequencing-based method. A wealth of valuable ST data has been generated based on 10× Visium (Robles-Remacho et al. 2023). However, with a spatial resolution of 55 µm, 10× Visium is unable to achieve single-cell resolution, making the integration of scRNA-seq data essential for comprehensive multimodal tissue analysis. This powerful combination of ST and scRNA-seq data has been widely applied across numerous research domains to deepen our understanding of the complex microenvironments of tissues (Fang et al. 2023, Zhang, et al. 2024, Lin et al. 2025).
Meanwhile, a wide array of computational tools has been developed to handle various aspects of spatial and single-cell transcriptomics data analysis. These tools support tasks such as performing cell-type deconvolution for spot-resolution ST (Cable et al. 2022, Kleshchevnikov et al. 2022, Ma and Zhou 2022), identifying differentially expressed genes in specific cell types or spatial regions/clusters (Stuart et al. 2019), inferring intercellular interaction patterns (Efremova et al. 2020, Jin et al. 2025) and ligand–receptor coexpression pattern (Liu et al. 2022) and disease-related regulatory networks (Morabito et al. 2023). While these methods have greatly expanded the biological questions that can be addressed, the abundance and specificity of these tools present significant challenges to the research community. Many of these methods require substantial computational programming skills and statistical expertise, creating a formidable barrier for biologists without extensive statistical expertise and computational programming skills. As a result, a substantial volume of spatial transcriptomic data generated by 10× Visium remains underexplored, awaiting more comprehensive analysis and deeper insights.
Several ST analysis platforms have emerged, providing web-based solutions for visualizing and analyzing ST data. These platforms offer distinct advantages while all confront certain constraints. Cellar (Hasanaj et al. 2022), Stellaris (Li et al. 2023), WebSCST (Zhang et al. 2022), Aquila (Zheng et al. 2023), and spatialGE (Ospina et al. 2025) do not integrate scRNA-seq, which constrains the potential depth of biological insights that could be extracted from the analysis. Integrated platforms like STExplore (Wang et al. 2025), SRT-Server (Yang and Zhou 2024), and SpatialTME (Shi et al. 2024), despite proficiency in accommodating multiple sequencing technologies, fail to deliver a complete analytical framework tailored to the special needs of ST data generated by 10× Visium. The compatibility of cross-platforms compromises their ability to address the unique complexities associated with 10× Visium spatially resolved transcriptomic information and they lack ability to explore complex spatial cellular relationships and tissue architecture, for example, comprehensively studying cellular interdependency, spatial gradient variation pattern of gene expression, cellular compositions, and signaling pathways related to disease or biological states and complex regulatory networks. These limitations significantly constrain our ability to gain a comprehensive understanding of the biological processes and interactions that shape tissue organization and function.
Recognizing these limitations, we identify a pressing need for a more comprehensive and adaptable computational platform that can meet the evolving demands of biomedical researchers working with 10× Visium ST and scRNA-seq data. In this study, we developed transFusion, a comprehensive platform specializing in the integrated analysis of scRNA-seq and 10× Visium ST data. transFusion provides a standardized, nonconfiguration-required workflow with preoptimized parameters, eliminating parameter customization to ensure accessibility for users without statistical training while guaranteeing reproducible, reliable results. transFusion provides advanced capabilities that surpass currently available options (Table 1). We leveraged two datasets to showcase its ability to uncover the complicated tissue microenvironment. By addressing the fragmentation and accessibility issues in the current landscape of spatial and single-cell analysis tools, our work provides a powerful, user-friendly framework for comprehensive scRNA-seq and 10× Visium ST integration analysis. This platform has the potential to accelerate research across a wide range of biological contexts, from developmental biology to cancer research, by making sophisticated multimodal analyses accessible to a broader scientific community.
2 Materials and methods
2.1 Differential gene expression analysis
Differential gene expression (DGE) analysis between specified clusters or regions is conducted using Seurat (Stuart et al. 2019) (v4.3.0). The FindMarkers function is utilized for pairwise comparisons, while FindAllMarkers is applied to identify differentially expressed genes across all clusters. Genes are classified as significantly upregulated if they meet the criteria of an adjusted P-value (adj. P-value) ≤ .05 and an average log2 fold change (avg_log2FC) ≥ 0.1. Conversely, genes with an adj. P-value ≤ .05 and avg_log2FC ≤ −0.1 are defined as significantly downregulated.
2.2 Gene Ontology enrichment analysis
Differentially expressed genes are identified using the FindAllMarkers function in Seurat (v4.3.0), with genes having an adj. P-value≤.05 selected for subsequent pathway enrichment analysis. The enrichGO function from clusterProfiler (Wu et al. 2021) (v4.11.0.2) is then employed to detect enriched pathways across the identified niches or regions.
2.3 Gene set enrichment analysis
Gene set enrichment analysis (GSEA) is performed using the AddModuleScore function in Seurat (v4.3.0) to calculate module scores for the specified gene sets of interest. This approach generates an enrichment score for each spot based on the expression of genes within each spot, allowing us to assess the relative activity of predefined pathways or biological processes across different spots.
2.4 Pathway signaling activity analysis of scRNA-seq and ST data
PROGENy (Schubert et al. 2018, Holland et al. 2020) is a footprint-based approach that utilizes a comprehensive collection of publicly available signaling perturbation experiments to identify a core set of pathway-responsive genes in humans and mice. Pathway activity scores are computed using the progeny’s (v1.17.3) progeny function, incorporating the 500 most responsive genes per pathway. Average pathway activity scores are calculated to assess pathway activity across different cell types or niches. For each spatial transcriptomic spot, transFusion estimates signaling pathway activities by leveraging PROGENy’s model matrix and the mlm method from decoupleR (Badia-i-Mompel et al. 2022), utilizing the top 500 genes from each transcriptional footprint and SCTransform-normalized data.
2.5 Cell–cell communication analysis and ligand–receptor colocalization
To estimate ligand–receptor interactions between different cell types, transFusion integrates CellPhoneDB (Efremova et al. 2020) (v2) and CellChat (Jin et al. 2025) (v2) to infer ligand–receptor pairs from processed 10× Visium ST and scRNA-seq data. Significant cell–cell interactions are identified based on a P-value threshold of ≤.05. For ST data, ligand–receptor colocalization is assessed by evaluating the spatial connectivity of the network, which includes only connections between spots exhibiting high expression of both the ligand and the receptor. The spatial connectivity of this network is then quantified using the Earth Mover’s Distance, based on the degree distribution of the network (Liu et al. 2022).
2.6 Cell enrichment analysis
To assess cell-type enrichment within clusters or regions, transFusion employs multimodal intersection analysis (Moncada et al. 2020), which utilizes the hypergeometric cumulative distribution to evaluate the statistical significance of the overlap between cell type-specific and tissue region-specific gene sets. The background gene set for P-value calculation consists of the intersection of all genes present in both the ST and scRNA-seq count matrices. For each spatial spot, the AddModuleScore function is used to quantify cell-type enrichment level, leveraging a list of highly differentially expressed genes identified from scRNA-seq differential expression analysis. Genes are classified as highly differentially expressed if the difference in the percentage of cells expressing the gene between two groups exceeds 0.5.
2.7 Deconvolution analysis
transFusion incorporates 12 deconvolution methods, including SCDC (Dong et al. 2021), RCTD (Cable et al. 2022), MuSiC (Wang et al. 2019), DeconRNASeq (Gong and Szustakowski 2013), DestVI (Gong and Szustakowski 2013), DWLS (Tsoucas et al. 2019), SPOTlight (Elosua-Bayes et al. 2021), SpatialDWLS (Dong and Yuan 2021), Stereoscope (Andersson et al. 2020), cell2location (Kleshchevnikov et al. 2022), CARD (Ma and Zhou 2022), and STdeconvolve (Miller et al. 2022). To reduce server load, transFusion downsamples scRNA-seq data to 300 cells per cell type when performing deconvolution analysis.
2.8 Cell dependency analysis
Leveraging the multiview intercellular spatial modeling framework (Tanevski et al. 2022), transFusion assesses the importance of each principal cell type’s abundance to the presence of other dominant cell types within spatial transcriptomic spots. Cellular proportions, derived from cell deconvolution analysis, are adaptively integrated into this framework, producing a normalized significance score that reflects cell-type dependencies across spatial contexts, including colocalization or reciprocal inclusion. However, it is important to note that these inferred interactions do not imply causality. Additionally, to link tissue structures with tissue functions, transFusion applies the same modeling framework to analyze the spatial distribution of PROGENy pathway activities, using standardized scores to quantify pathway activities.
2.9 spatialDistance analysis
For spatialDistance analysis (Lin et al. 2025), transFusion provides a function that allows manual selection of spots covering the region of interest, guided by the Hematoxylin and Eosin (H&E) image as a reference. The Euclidean distances between the outermost spots of the selected region and all other spots are computed using scaled spatial coordinates. These distance metrics are then utilized to analyze gene expression patterns, cell-type proportions (estimated via deconvolution analysis), and signaling pathway activities relative to tissue depth within the tissue. To visualize and model spatial gradients of these molecular and cellular features, density-over-distance plots combined with LOESS regression are employed. By capturing these spatial dependencies, transFusion enhances the ability to interpret how cellular and molecular compositions vary across anatomical structures, offering deeper insights into spatially organized biological processes.
2.10 High-dimensional weighted gene coexpression network analysis
transFusion utilizes high-dimensional weighted gene coexpression network analysis (hdWGCNA) (Morabito et al. 2023) to construct a coexpression network based on ST data, using the hdWGCNA package. First, the MetacellsByGroups function is used to generate a metacell gene expression matrix. Then, the TestSoftPowers function is applied to identify the optimal soft power. Finally, the ConstructNetwork function is utilized to construct the coexpression network that captures gene–gene relationships within the spatial context of the tissue.
3 Results
transFusion is a user-friendly and powerful tool developed to streamline the analysis of human and mouse scRNA-seq and 10× Visium ST data, leveraging advanced analytical techniques. The platform consists of two main modules: a data upload module (Fig. 1A) and an analytical module (Fig. 1B and C). The data upload module allows users to input Seurat objects containing scRNA-seq and 10× Visium ST data, while the analytical module includes 12 key functions that enable comprehensive data analysis (Table 2). The details of 12 functions can be found in the “Materials and methods” section. Users can design customized analytical pipelines by selecting from these functions, offering flexibility and adaptability for various research objectives.
Features of transFusion. (A) Data upload module. (B, C) Analytical modules.
3.1 Case study 1: Characterizing cell–cell interactions within the tumor microenvironment of human breast cancer
The tumor microenvironment (TME) is a complex network of interactions between cancer cells and surrounding components, driving tumor progression, metastasis, and drug resistance (Wang et al. 2023). Gaining insight into these cellular interactions within the TME is essential for developing novel therapeutic strategies (Zhang et al. 2024). In this study, we applied transFusion to decipher cell–cell interactions within the TME of human breast cancer via integrating scRNA-seq data (Fig. 2A) derived from 21 breast cancer patients (Wu et al. 2021) and 10× Visium ST data (Fig. 2B) from a breast cancer patient (Wu et al. 2021).
Integrative analysis of scRNA-seq and ST reveals distinct cell–cell interaction patterns and spatial organization in the breast cancer microenvironment. (A) Uniform manifold approximation and projection (UMAP) of breast cancer scRNA-seq data. (B) Spatial transcriptomic spot colored by region annotation. (C), Chord diagram of the intercellular communication network. Edge richness represents the number of ligand–receptor interactions. (D) Dot plots of ligand–receptor interactions between specific cell types. (E, F) Visualization of selected ligand–receptor pairs for ST data. Left is the relative expression of the ligand and the receptor; right is the interaction strength. (G, H) Violin plots of the interaction strength of specified ligand–receptor pairs on different annotated regions. (I) Degree of intercellular dependence within spots. ICSL, invasive cancer + stroma + lymphocytes; PVL, perivascular-like cells; TLS, tertiary lymphoid structures.
To decipher the complex intercellular communication network within the TME, we first employed CellPhoneDB analysis on the scRNA-seq dataset. Among the nine distinct cell populations identified in the TME, cancer-associated fibroblasts (CAFs), endothelial cells, and myeloid cells demonstrated the most extensive interaction networks with other cell types (Fig. 2C). Further investigation of ligand–receptor pairs revealed significant crosstalk between these three cell populations and cancer epithelial cells and other cells (Fig. 2D). Notably, we identified two predominant signaling axes shared: the MIF-CD74, which has been previously implicated in tumor immune evasion (Wang et al. 2017), and FN1-ITGA5, which has been associated with promoting tumor cell viability, invasion, and migration (Cai et al. 2018). To understand the spatial distribution patterns of these interactions, we performed ligand–receptor coexpression analysis using ST data. By integrating this with histological annotations (Fig. 2B) from H&E-stained images, compared to tumor invasion areas, MIF-CD74 coexpression levels were higher in noninvasion regions, and FN1-ITGA5 showed stronger enrichment in stromal and lymphocyte areas (Fig. 2E–H). The elevated MIF-CD74 signaling in noninvasion areas may represent an immunosuppressive barrier that precedes tumor invasion, potentially creating a permissive environment for subsequent tumor progression. Meanwhile, the enrichment of FN1-ITGA5 in stromal and lymphocyte regions likely reflected active stromal remodeling and invasion processes, regulated by the crosstalk between CAFs, endothelial cells, and immune cells in these areas. To comprehensively characterize cellular relationships, we applied CARD (Ma and Zhou 2022) to perform deconvolution analysis (Table S1, available as supplementary data at Bioinformatics online) and conducted dependency analysis on the ST data to evaluate whether cell-type abundances within spots could be predicted by their neighboring cellular composition. This analysis revealed that myeloid cells, plasmablasts, and T cells were highly predictive of the abundance of cancer epithelial cells within all spots, and CAFs and cancer epithelial cells were colocalized, suggesting potential interdependencies among these TME components (Fig. 2I).
3.2 Case study 2: Deciphering the spatial architecture of pancreatic ductal adenocarcinoma
The spatial organization of tumor tissue represents a critical determinant in cancer biology, significantly influencing disease progression and therapeutic outcomes (Arora et al. 2023). During tumor evolution, cancer cells progressively infiltrate and restructure adjacent tissues, establishing spatially distinct compartments with unique molecular and cellular characteristics. Pancreatic ductal adenocarcinoma (PDAC) is characterized by a prominent stromal microenvironment with significant cellular and spatial heterogeneity that profoundly affects disease biology and treatment resistance (Sherman and Beatty 2023). In this study, we applied transFusion to illustrate the spatial architecture of PDAC by integrating scRNA-seq and ST data generated from the same PDAC patient (Moncada et al. 2020). According to histological characteristics, the PDAC tissue was segmented into cancer, pancreatic, ductal, and stromal regions (Fig. 3A). First, DGE analysis was performed to investigate the gene expression profiles characteristic of each region (Table S2, available as supplementary data at Bioinformatics online). The result illustrated that the cancer cell regions were primarily enriched with genes related to tumor progression and invasion, like PTGS2 (Lin et al. 2019), COL12A1 (Tang et al. 2023), and ONECUT3 (Prajapati et al. 2024), whereas the stromal regions displayed gene signatures such as BRCA1 (Krishnan et al. 2021), BTBD9 (Li et al. 2020) suggested early microenvironmental adaptations that may precondition the tissue for tumor development. Differentially expressed genes in the ductal epithelial regions reflected the structural and functional characteristics of epithelial cells, while the pancreatic regions exhibited genes linked to normal physiological functions (Fig. 3B). To further investigate the biological functional significance of the variable genes across distinct regions, we applied Gene Ontology (GO) enrichment analysis and pathway activity enrichment analysis. The results indicated that the cancer cell regions were significantly enriched in pathways associated with extracellular matrix remodeling. In the pancreatic regions, enrichment was observed in immune response, digestion and metabolic processes, consistent with the normal physiological functions of pancreatic tissue. The ductal epithelial regions were enriched in pathways related to tissue homeostasis, amino acid transport, and response to injury. Additionally, the stromal regions showed significant enrichment in apoptosis regulation pathways (Fig. 3C). Results of pathway activity analysis provided an overview of the differential activation of key signaling pathways across different regions of PDAC tissue. We found that in the cancer region, pathways including TGFβ, VEGF, EGFR, JAK-STAT, MAPK, NFkB, TNFα, and Hypoxia show high activity (Fig. 3D).
Integrative analysis of scRNA-seq and ST deciphers the spatial architecture of pancreatic ductal adenocarcinoma. (A) H&E-stained image of PDAC (left) and annotated spatial regions of PDAC data (right). (B) Volcano plot of differential gene expression among regions. (C) Comparison of GO enrichment among regions. (D) PROGENy pathway activities across different regions. (E) Cell enrichment analysis of regions. (F) Gradient heatmap of distance from the leading edge of PDAC. (G) Variation of PROGENy pathway activities with distance gradient. (H) Variation of cellular proportion with distance gradient.
Building upon our insights into spatial transcriptional signatures, we next sought to deconvolve the cell-type heterogeneity across distinct tissue regions. To this end, we performed cell-type enrichment analysis, which revealed region-specific differences in cellular compositions. From the result, we observed that the cancer region was mainly enriched with cancer clone A, cancer clone B, and fibroblasts, the duct epithelium region was mainly enriched with ductal cells, while the pancreatic and stroma regions were enriched with acinar cells (Fig. 3E). Since swelling and invasive growth are the biological characteristics of tumor cells, to further understand how PDAC invades and remodels its surrounding microenvironment, we performed the CARD (Table S3, available as supplementary data at Bioinformatics online) and spatialDistance analysis on ST data to check whether there were gradient-like changes of cellular proportion and pathway activities in the direction perpendicular to the leading edge on both sides of PDAC (Fig. 3F). The results revealed that in the tumor regions, pathway activity demonstrated a clear gradient effect, with pathways such as TGFβ, p53, Androgen, VEGF, EGFR, JAK-STAT, MAPK, NFkB, TNFα, and Hypoxia decreasing as the distance from the tumor edge increased. In contrast, pathways like PI3K, Trail and Estrogen exhibited the opposite trend, showing increased activity further from the tumor boundary (Fig. 3G). For cellular proportion gradient-like changes, we observed that fibroblast proportions were the lowest around the cancer boundary, while ductal crisp3 high-centroacinar-like cells were the highest (Fig. 3H).
4 Discussion
Single-cell and spatial transcriptomics have emerged as powerful tools for understanding tissue heterogeneity and cellular interactions within their native context. However, the integrative analysis of scRNA-seq and 10× Visium ST data requires sophisticated computational skills and statistical expertise that often present significant technical barriers for many researchers. In this study, we present transFusion, an integrative platform that addresses a critical gap by advancing the analysis of 10× Visium ST and scRNA-seq data. The platform integrates a comprehensive toolkit, including deconvolution analysis, ligand–receptor colocalization, pathway activity analysis and additional advanced methods, empowering users to decipher complex spatial molecular architectures, regulatory networks, and intercellular interactions within the native tissue microenvironments. These tools enable detailed exploration of intercellular interactions and spatial variation patterns within the TME, as evidenced in breast cancer and PDAC case studies.
In our breast cancer case study, the platform revealed extensive cellular communication networks, particularly highlighting the intricate interactions between CAFs, endothelial cells, and myeloid cells. The identification of two predominant signaling axes, MIF-CD74 and FN1-ITGA5, demonstrated distinct spatial distribution patterns that reflect the dynamic nature of tumor–stromal interactions. Notably, the elevated MIF-CD74 signaling in noninvasion areas and the enrichment of FN1-ITGA5 in stromal and lymphocyte regions suggested regional specialization in immune regulation and angiogenic processes. These spatial patterns offer valuable insights into the mechanisms of tumor progression and potential therapeutic targeting strategies, particularly for disrupting specific tumor–stromal interactions within distinct microenvironmental regions. In the PDAC case study, through the identification of spatial gradients in pathway activities and cellular proportions, transFusion captured molecular changes across tissue boundaries, particularly within the TME. This gradient-based analysis offers a dynamic view of tissue remodeling and reveals key trends in pathways associated with tumor progression and immune evasion. The insights gained here may directly inform therapeutic strategies targeting tumor–stromal interactions and regional cellular heterogeneity.
transFusion offers customizable analytical pipelines, allowing researchers to tailor analyses for a broad spectrum of research goals, from exploratory tissue architecture studies to hypothesis-driven inquiries into specific cellular behaviors. This flexibility is essential given the diverse research questions in spatial biology, spanning fields from developmental biology to oncology. By reducing the statistical and computational barriers of spatial and single-cell data integration, transFusion democratizes advanced analysis methods, making them accessible to a wider scientific audience, including those without specialized computational programming skills and statistical expertise. This ease of use is anticipated to accelerate research progress by enabling more scientists to conduct spatial analyses effectively.
The widespread adoption of 10× Visium technology has generated a wealth of valuable data that still holds significant potential for biological discovery (Yue et al. 2023). Furthermore, the relatively lower cost and established protocols of 10× Visium technology enable larger-scale studies across multiple samples and conditions, facilitating robust statistical analyses and broader biological insights. However, higher resolution ST technologies can offer unprecedented detail at subcellular scales. Although this platform can currently be adapted for analysis by merging bins to lower sequencing resolution, expanding compatibility to high-resolution ST datasets, such as Visium HD and Stereo-seq, will further bridge the gap between spot-based and single-cell analyses in the future. Future developments of transFusion will focus on expanding its analytical capabilities on higher resolution ST technologies and across multiple dimensions by integrating emerging analytical methods. This enhancement will collectively strengthen transFusion’s utility as a comprehensive platform for ST analysis, advancing our understanding of complex tissue microenvironments across various biological contexts and experimental scales.
In summary, transFusion not only addresses current limitations in spatial and single-cell data analysis but also elevates the level of insight that can be obtained from these technologies. Its applications are broad, spanning multiple research domains and enhancing the depth of understanding of tissue organization and function. It represents a pivotal advancement in spatial biology, with the potential to drive the field toward a more comprehensive understanding of tissue structure and function.
Supplementary Material
btag059_Supplementary_Data
The reference list from the paper itself. Each links out to its DOI / PubMed record.
- 1Andersson A , Bergenstråhle J, Asp M et al Single-cell and spatial transcriptomics enables probabilistic inference of cell type topography. Commun Biol 2020;3:565.33037292 10.1038/s 42003-020-01247-y PMC 7547664 · doi ↗ · pubmed ↗
- 2Arora R , Cao C, Kumar M et al Spatial transcriptomics reveals distinct and conserved tumor core and edge architectures that predict survival and targeted therapy response. Nat Commun 2023;14:14. 10.1038/s 41467-023-40271-437596273 PMC 10439131 · doi ↗ · pubmed ↗
- 3Badia-I-Mompel P , Vélez Santiago J, Braunger J et al decouple R: ensemble of computational methods to infer biological activities from omics data. Bioinform Adv 2022;2:vbac 016.36699385 10.1093/bioadv/vbac 016PMC 9710656 · doi ↗ · pubmed ↗
- 4Birnbaum KD. Power in numbers: single-cell RNA-seq strategies to dissect complex tissues. Annu Rev Genet 2018;52:203–21.30192636 10.1146/annurev-genet-120417-031247 PMC 6314027 · doi ↗ · pubmed ↗
- 5Cable DM , Murray E, Zou LS et al Robust decomposition of cell type mixtures in spatial transcriptomics. Nat Biotechnol 2022;40:517–26.33603203 10.1038/s 41587-021-00830-w PMC 8606190 · doi ↗ · pubmed ↗
- 6Cai X , Liu C, Zhang T-N et al Down‐regulation of FN 1 inhibits colorectal carcinogenesis by suppressing proliferation, migration, and invasion. J Cell Biochem 2018;119:4717–28.29274284 10.1002/jcb.26651 · doi ↗ · pubmed ↗
- 7Chen A , Liao S, Cheng M et al Spatiotemporal transcriptomic atlas of mouse organogenesis using DNA nanoball-patterned arrays. Cell 2022;185:1777–92.e 21.35512705 10.1016/j.cell.2022.04.003 · doi ↗ · pubmed ↗
- 8Dong M , Thennavan A, Urrutia E et al SCDC: bulk gene expression deconvolution by multiple single-cell RNA sequencing references. Brief Bioinform 2021;22:416–27.31925417 10.1093/bib/bbz 166PMC 7820884 · doi ↗ · pubmed ↗