Statistical analysis plan of the study titled “A deprescribing programme aimed to optimize blood glucose-lowering medication in older people with type 2 diabetes mellitus — the OMED2 study: a randomized controlled trial”
Charlotte Andriessen, Peter P. Harms, Marieke T. Blom, Anna W. de Boer, G. Ardine de Wit, Ron Herings, Rob J. van Marum, Jacqueline G. Hugtenburg, Daniël van Raalte, Liselotte van Bloemendaal, Giel Nijpels, Rimke C. Vos, Petra Denig, Petra J. M. Elders

TL;DR
This paper outlines the statistical methods for a study testing a deprescribing program to optimize diabetes medication in older patients.
Contribution
The paper provides a detailed statistical analysis plan for evaluating a deprescribing program's impact on diabetes complications.
Findings
The study will use generalized linear mixed models to compare diabetes complications between intervention and control groups.
Both intention-to-treat and per protocol analyses will be conducted to assess the program's effectiveness.
The plan includes methods to evaluate the implementation and cost-effectiveness of the deprescribing program.
Abstract
The OMED2 (Optimization of Medication in Elderly with Diabetes) study addresses the effect and implementation of integrating a deprescribing programme (DPP) in general practice. The aim of the DPP is to reduce glucose-lowering medication (SU/insulin) in overtreated older patients. The protocol for this study has been published previously. This statistical analysis plan (SAP) contains a more elaborate outline of the (statistical) methods we plan to use for data analysis. The OMED2 study is a randomized mixed-methods study with a 2-year follow-up period that compares the effect of the implementation of a DPP in general practice to regular care (control). In this SAP, we report on the (statistical) approaches that we plan to use to address the study objectives. The main objective of the OMED2 study is to examine the effect of the implementation of the DPP on diabetes complications,…
Genes, proteins, chemicals, diseases, species, mutations and cell lines named across the full text — each resolved to its canonical identifier and authoritative record.
Click any figure to enlarge with its caption.
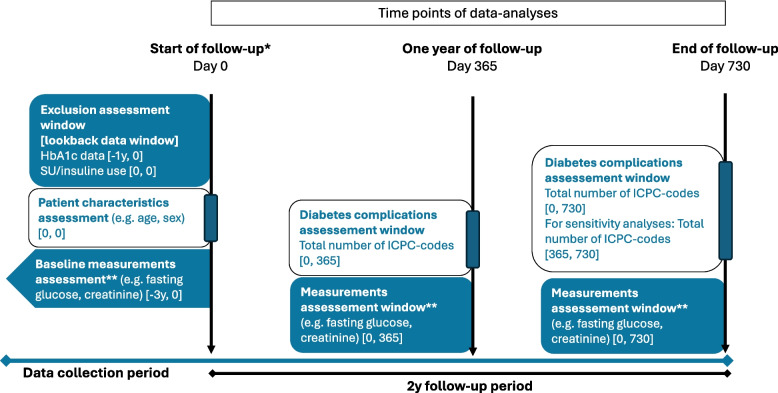 Figure 1
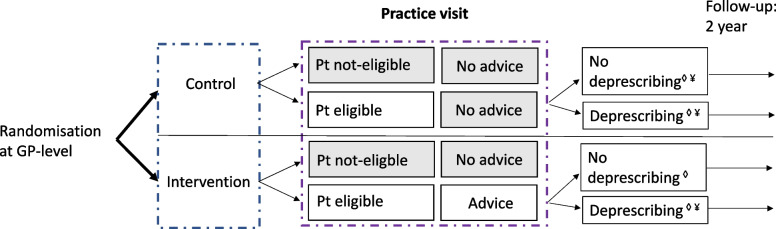 Figure 2
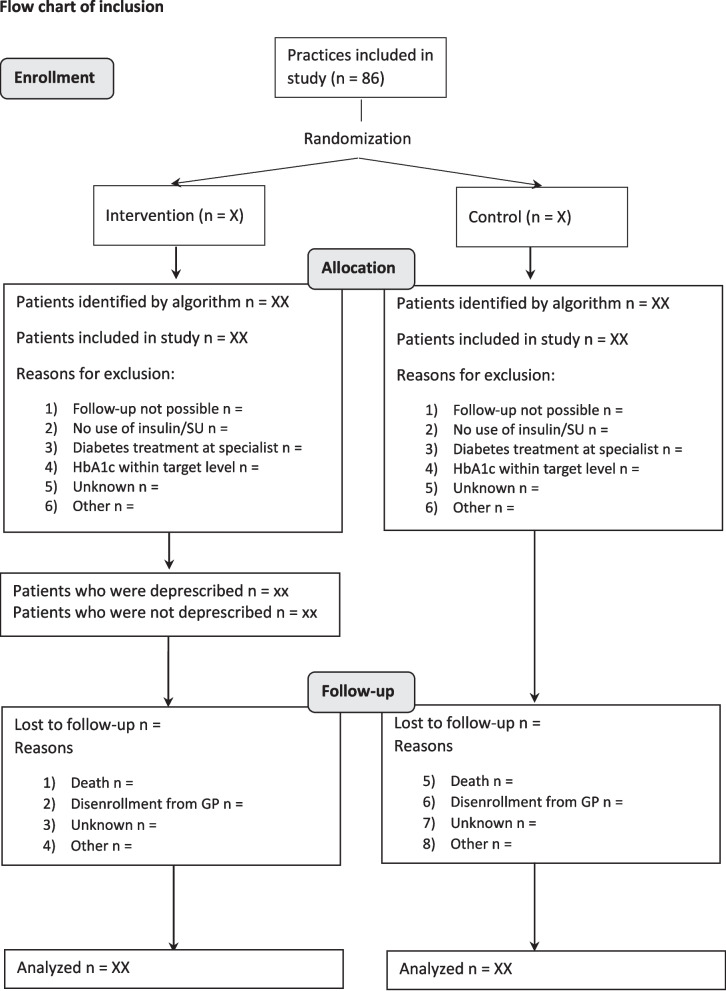 Figure 3
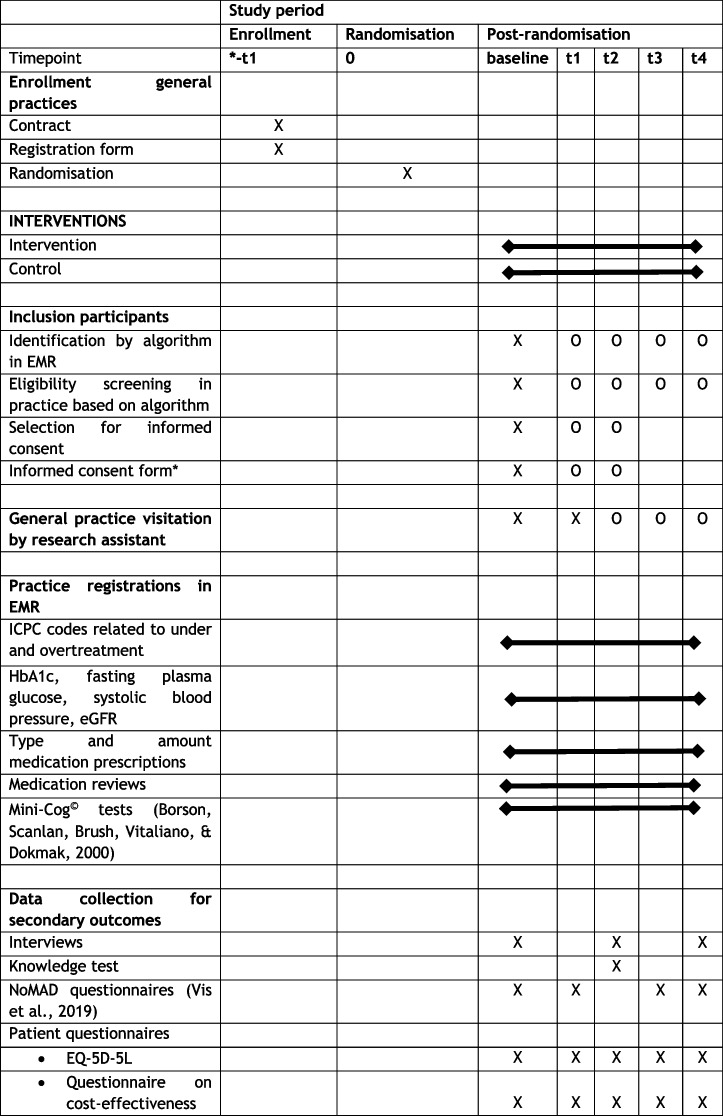 Figure 4
- —http://dx.doi.org/10.13039/501100001826ZonMw
Peer Reviews
No public reviews on file for this paper yet. If you reviewed it on a platform where reviews are public (OpenReview, ICLR, NeurIPS, ICML), you can paste yours below so the community can read it here.
Videos
No videos yet. Explain this paper in a talk, walkthrough, or lecture? Add one.
Taxonomy
TopicsDiabetes Treatment and Management · Pharmaceutical Practices and Patient Outcomes · Medication Adherence and Compliance
Introduction
Background and rationale
In the Netherlands, many elderly patients with type 2 diabetes (T2D) are at risk of hypoglycaemic episodes because they receive more glucose-lowering medication (i.e. insulin and/or sulphonyl derivatives) than recommended by the guideline of the Dutch College of General Practitioners [3]. Overtreatment with glucose-lowering medication can result in falling, hospitalization, and coma. Nevertheless, deprescribing of glucose-lowering medication in older patients is not widely adopted in general practice. One important reason that Dutch health care professionals (HCPs) are reluctant to deprescribing is that robust, scientific evidence on the safety of deprescribing glucose-lowering medication in elderly T2D patients is lacking.
The OMED2 study (Optimization of Medication in Elderly with Diabetes) is a randomized controlled trial to promote deprescribing glucose-lowering medication in general practice by means of a deprescribing programme (DPP). The main objectives of the OMED2 study are focused on the implementation of the DPP in general practice as well as the effect of deprescribing glucose-lowering medication and thereby increasing HbA1c levels on T2D complications.
This SAP only concerns the data analyses to analyse the effect of the DPP intervention as described in the study design paper. The study design paper entails a more detailed description of the study design of the OMED2 study [1]. For readability, the research objectives on the implementation of the DPP have been separated from the research questions on the effect of the DPP as these use different methods of analyses. This statistical analysis plan (SAP) was based on the guidelines from Gamble et al. [6] and Stevens et al. [17].
Objectives
Underscored concepts are explained more elaborately in Section “Variable definitions”.
Primary study objective
To assess the effect of the DPP on the total number of diabetes complications related to under- and overtreatment combined compared to usual care (control). To address this objective, the total number of diabetes complications that are registered between the start of the follow-up period and the end of the follow-up period are summed. To address potential differences in follow-up duration, an incident rate is calculated for the outcome variable.
Secondary study objectives
Related to diabetes complications
- To assess the effect of the DPP on the total number of diabetes complications related to undertreatment compared to usual care (control). To address this objective, the total number of diabetes complications related to undertreatment that are registered between the start of the follow-up period and the end of the follow-up period is summed. To address potential differences in follow-up duration, an incident rate is calculated for the outcome variable.
- To assess the effect of the DPP on the total number of diabetes complications related to undertreatment compared to usual care (control). To address this objective, the total number of diabetes complications related to undertreatment that are registered between the start of the follow-up period and the end of the follow-up period is summed. To address potential differences in follow-up duration, an incident rate is calculated for the outcome variable.
Research objectives on physical health outcomes
- 3.To assess the effect of the DPP vs. usual care (control) on the following health biomarkers: HbA1c (mmol/mol), fasting plasma glucose (mmol/l), systolic blood pressure (mmHg), and eGFR CKD-EPI (per 1.73 m^2^). Baseline measurements of health biomarkers will be compared with measurements at 1 year of follow-up and with measurements at the end of follow-up.
Research objectives on the implementation of the DPP will be discussed in “Part 2: Implementation analyses of OMED2-study” (page 17).
Research objective on changes in medication
- 4.Assess the use of diabetes medication at baseline, after 1 year of follow-up, and after 2 years of follow-up for both the intervention and control group. Both the medication dosage and amount of medication will be reported.
Study methods
Trial design
This study entails a cluster randomized-controlled parallel-arm trial, wherein the effect of the DPP is compared to usual care during a 2-year follow-up period. The study is conducted by two research centres, i.e. Leiden University Medical Centre and Amsterdam University Medical Centre.
Randomization
Cluster randomization is performed on the level of GPs and PNs, stratified by practice size.
Sample size
Sample size calculation is described in the study design paper ([1], Trials). It was calculated that 406 patients and 86 practices need to be included to have sufficient power to analyse the primary outcome (i.e. total number of diabetes complications).
Framework
For the main outcome, a non-inferiority hypothesis testing framework will be used with a non-inferiority margin of 0.1 to assess whether the implementation of the DPP results in a similar total number of diabetes complications as compared to regular care (control). The non-inferiority margin means that the mean sum of complications should not differ by more than 0.1 complications between the intervention and control. If the difference between the mean sum of complications of the intervention and control falls within 0.1, we can conclude that the implementation of the DPP is non-inferior to regular care.
Statistical interim analyses and stopping guidance
Due to the nature of this study, i.e. the implementation of an already existing and approved guideline, no interim analyses are planned.
Timing of final analysis
Diabetes complications will be counted from the start of follow-up until the end of follow-up, and the sum of these complications will be used for the primary analysis [12]. In addition, the difference in diabetes complications between the first year of follow-up compared to the second year of follow-up will be investigated. For this purpose, two groups of diabetes complications will be made. The first group will include the sum of diabetes complications that are registered from the start of follow-up until 1 year of follow-up (Fig. 1). The second group will include the sum of diabetes complications that are registered between 1 year of follow-up and the end of follow-up.Fig. 1. Study diagram of outcomes obtained in the OMED2 study. y, year; ICPC, International Classification of Primary Care. *Start of follow-up for intention-to-treat analyses is date of patient inclusion; start of follow-up for intervention group in per-protocol analyses is date of deprescribing. **Measurement closest prior to time point of data analyses is included
For the analysis of health biomarkers, measurements at 1 year of follow-up and measurements at the end of follow-up will be compared to baseline measurements (Fig. 1).
Timing of outcome assessments
Timing of outcome assessments is depicted in Table 1, which is derived from the study design paper [1]. Data from the electronic medical records (EMR) will be extracted after 12 months, 18 months, and 32 months after HCPs from the general practice have followed the educational session. These time points have been chosen so that patients who are identified at the second practice visit can have a 2-year follow-up period. It has also been taken into account that deprescribing of patients will not occur directly after the practice visit. Table 1. Standard Protocol Items: Recommendations for Interventional Trials (SPIRIT) diagram of the OMED2 study [4, 20]X, event present at time point; O, event optional at time point. −t1, performed prior to randomization; baseline, study start, defined as the first day of the month in which the educational session occurred; t1, 6 months after baseline; t2, 1 year after baseline; t3, 1.5 years after baseline; t4, 2 years after baseline; EMR, electronic medical records; ICPC, International Classification of Primary Care; eGFR, estimated glomerular filtration rate; NoMAD, Normalization MeAsure Development
Statistical principles
Confidence intervals and p-values
Results are considered significant if p < 0.05. Confidence intervals will be reported where appropriate and will be used to determine non-inferiority.
Adherence and protocol deviations
Adherence to the intervention is defined as the extent to which HCPs follow the DPP. The extent of the exposure is the size of the absolute reduction in daily dose of glucose-lowering medication (i.e. SU or insulin), which is discussed during the educational session. The deprescribing step needed depends on whether the patient uses SU or insulin and the type of insulin (long or short acting). We will summarize the initial changes in medication that have been performed. Barriers and facilitators for implementation of the DPP are also investigated. Implementation analyses of the OMED2-study are described in the second part of this SAP.
Analysis populations
The intention-to-treat analysis compares all patients eligible for deprescribing (see “Eligibility”), regardless of whether they were deprescribed or not, between the intervention and usual care group.
The per-protocol analysis compares patients who were deprescribed (excluding those who were restarted again afterwards) in the intervention group to patients eligible for deprescribing (regardless of whether deprescribing occurred) in the usual care group.
For most research objectives, both an intention-to-treat analysis as well as a per-protocol analysis will be performed (Fig. 2).Fig. 2. Study design of OMED2 study. ◊Sample included in intention-to-treat analysis. ¥Sample included in per-protocol analysis
X, event present at time point; O, event optional at time point. −t1, performed prior to randomization; baseline, study start, defined as the first day of the month in which the educational session occurred; t1, 6 months after baseline; t2, 1 year after baseline; t3, 1.5 years after baseline; t4, 2 years after baseline; EMR, electronic medical records; ICPC, International Classification of Primary Care; eGFR, estimated glomerular filtration rate; NoMAD, Normalization MeAsure Development
Trial population
Screening data
To describe the representativeness of the trial sample, baseline characteristics of general practices as well as of patients will be reported. These data will be collected from the EMR.
Eligibility
Older patients (≥ 70 years) with T2D who are overtreated with SU derivatives and/or insulin are eligible to be included in the study. Overtreatment is defined as an HbA1c level < 54 mmol/mol, measured max. 1 year prior to the date of patient inclusion. Patients with HbA1c levels measured ≥ 1 year prior to the moment of patient inclusion are excluded from analysis. Patients are also excluded if regular diabetes care is not provided at the general practice. Whether a patient could be included in the study was discussed with the care provider at intervention practices, whereas in the control practices the researchers determined study inclusion based on care registration data.
Patients who did not use SU or insulin at the date of study inclusion (practice visit 1 or 2), or with an HbA1c level not below the target range, were not included in the study.
Recruitment
Recruitment of practices and patients is detailed in the study design paper.
Withdrawal/follow-up
It is anticipated that withdrawal from practices will be low, as the DPP intervention has been designed to limit the time investment for practices. If general practices withdraw from the intervention study, this will be reported, including the reason for withdrawal.
Number of patients that are lost to follow–up will be reported, including reasons for lost to follow–up (Fig. 3). It will be assessed whether the group that has been lost to follow–up differs in baseline patient characteristics from the group that completed the follow–up period.Fig. 3. Flow diagram for the enrollment of patients in the study
Baseline patient characteristics
Baseline characteristics will be presented using mean ± standard deviation for continuous, normally distributed variables and median ± interquartile range in case of non-normality (Table 2). Discrete variables will be presented as counts with percentages. Since this study entails regular care data, baseline measurements (e.g. HbA1c and BMI) were performed at different time points depending on at what date patients had planned their general practice visit. Definition of baseline measurements is therefore given in “Variable definitions”. Table 2. Patient baseline characteristicsPatient characteristicsTotal population n = Intervention n = (%)Control n = (%)Age, yearsWomen, n (%)Diabetes duration (% ≥ 10 years)Baseline HbA1c, mmol/molBMI, kg/m^2^Kidney function^^ (% poor)Multimorbidity^^, nPolypharmacy^^, n (% present)Medication, n (%) Metformin SU Insulin SGLT2i GLP1a DPP4 Pioglitazone^^Based on eGRF [13] and categorization of eGFR values in [8]. **Number of patients with multiple chronic diseases at study start; chronic diseases included the following: cardiovascular disease, alcohol abuse, smoking, airway diseases, obesity, diabetes, and kidney damage. ***Polypharmacy: use of ≥ 5 medications [9]
Analysis
Prior to analysis, data needs to be extracted from the general practices, and a data quality control check will be performed. Information on these processes can be found at the end of the SAP. Variable of interest for this study are presented in Tables 3, 4, and 5. Table 3. Outcome variables of the OMED2-study, how they are measured, and how they will be presentedVariableMeasurement of variableMeasurement unitType of variablePresentation of variableT2D complicationsICPC codes (EMR)CountCategoricalCount and percentage (?)Complications of undertreatmentICPC codes (EMR)CountCategoricalCount and percentage (?)Complications of overtreatmentICPC codes (EMR)CountCategoricalCount and percentage (?)HbA1cBlood draw (EMR)Mmol/molContinuousMean ± st dev or median and IQRFasting plasma glucoseBlood draw (EMR)Mmol/lContinuousMean ± st dev or median and IQRSystolic blood pressureBlood pressure monitor (EMR)mmHgContinuousMean ± st dev or median and IQRKidney functionBlood draw, age, sex (EMR)eGFR CKD-epi (per 1.73 m^2^)ContinuousMean ± st dev or median and IQRQuality of lifeEQ-5D-5L questionnaireUtility scoreContinuousMean ± st dev or median and IQRTable 4Variables that will be generated by transformation of existing variablesVariableCalculationType of variableExplanationTime-window diabetes complicationsBased on the date of the occurrence of diabetes complications (ICPC) relative to the start of follow-upCategoricalComplications in the first year of follow-upComplications in the second year of follow-upNecessary to investigate the short- and long-term effects of the implementation of the DPPeGFRCalculated based on*eGFR using CKD-EPI (2021 update)*ContinuouseGFR is not present in data extraction and is calculated using creatinine, sex, and ageKidney functionNormal: e**GFR > 60Disturbed: e**GFR 30–59Poor: e**GFR < 30CategoricalNormalDisturbedPoorCategories of disturbed kidney function, based on literaturePer protocolPatient in the intervention group is included when deprescribed (and not restarted) or if a patient is in the control groupCategoricalNot includedIncludedGroups for per-protocol analysisTime between patient identification and deprescribingDate of deprescribing minus date of patient identification (i.e. practice visit 1 or 2)Continuous (in days)Estimation of how much time there is between patient identification and deprescribingTime between baseline measurement and date of patient inclusionBased on date of measurement and date of patient inclusionContinuous (in days)To gain insight in reliability of baseline measurementsIncident rate of diabetes complicationsTotal number of diabetes complications corrected for available follow-up periodDiscreteNecessary to correct total number of diabetes complications for possible differences in follow-up duration between participantsTable 5Variables that need to be manually added to EMR data filesVariableTypeCommentTrainingDateStart date of general practiceIntervention_controlCategoricalInterventionControlAs randomized at study start. Intervention group contained patients enrolled to practices that received the DPP and patients enrolled to control practices received regular careInclusionCategoricalYesNoInclusion established during practice visits and checked during data imputation by medicine studentPractice visit_InclusionCategoricalFirst practice visitSecond practice visitInclusion at first or second practice visitDate_practice_visit_inclusionDateDate of practice visit at which patient was included in the studyReason_of_exclusion1. CategoricalUnknownHbA1c not below reference valuesNo use of sulphonylureas/insulinNo regular DM treatment at general practiceAge < 70Reason of exclusionDeprescribedCategoricalYesNoWhether or not patient has been deprescibedD_of_deprescribingDateDate of first deprescribing stepReason_Not_DeprCategoricalNewly measured HbA1c not below target levelWish/fear of patientDecline patientPatient not visiting GP for a prolonged timeDM care transferred to specialistAwaits new HbA1cDeceasedUnknownReason for not deprescribingReference_values_HbA1cCategorical1. Unknown> 54 (for non-frail patients)> 59 (for frail patients)Do not determine HbA1c anymoreAs indicated during practice visit and discussed with PN (only discussed in intervention arm)SU_T0YesNoUse of SU at baselineInsulin_T0YesNoUse of insulin at baselineMetformin_T0YesNoUse of metformin at baselineSGLT2i_T0YesNoUse of SGLT2i at baselineGLP1a_T0YesNoUse of GLP1a at baselineDPP4_T0YesNoUse of DPP4 at baselinePioglitazon_T0YesNoUse of pioglitazon at baselineMed_SpecTextDM medication at T0 (including dose) written outMed_deprescribedCategoricalSUInsulinSU + insulinNoneWhich medication has been deprescribedDescr_deprescribingTextDescription on deprescribing stepsRestartCategoricalPermanently deprescribedMedication restartedWhether or not a patient has restarted medication after deprescribing. For the definition of restarted, see “Definition of variables”Reason_restartCategoricalUnknownComplaints of hyperFear patientInitiative of patientHbA1c above reference valueIncreasing glucose valuesReason why caregiver restarted SU/insulin after deprescribing, as deduced from the EMRDate_of_restartDateDate at which SU/insulin has been restartedMed_spec_restartTextWhich medicine is restarted and at which dose
Variable definitions
- Baseline measurements: Measurements performed closest before the start of follow-up.
- Cost-effectiveness analysis: Evaluation of the difference in health effects when comparing the intervention with the control condition, relative to the difference in costs when comparing the two treatment arms. The health effects are expressed in quality-adjusted life years (see QALY definition), and the costs are total societal costs over the observation period (from inclusion to end of follow-up). The CEA is expressed in terms of the cost per QALY gained, when the intervention is compared to the control condition.
- Deprescribing: Lowering or discontinuing of glucose-lowering medication (i.e. insulin/SU derivates). If no recipe for a medication has been given out for a period of at least 6 months, the medication is considered to be discontinued. If short-acting insulin has been discontinued, but the dose of long-acting insulin has been increased, this does not count as deprescribing. If SU has been deprescribed but insulin has been started, this also does not count as deprescribing. Deprescribing is usually noted in the contact file by the health care provider; the date of this note is considered the date of deprescribing. If such a note is missing, the date of deprescribing will be estimated based on the median number of days between the date of patient identification and the date of deprescribing contained in the dataset.
- Diabetes complications: Registered in the EMR as International Classification of Primary Care (ICPC) codes. The incident ICPC codes relevant for this study have been established prior to the study start and are further described in the study design paper [1]. Newly identified journal ICPC codes that occur within the 2-year follow-up period are counted. In the case of missing journal ICPC codes, episode ICPC codes are counted. Patients can visit the general practice multiple times for the same diabetes complication, which could result in a misrepresentation of our results. To address this issue, ICPC codes are only counted if the interval between the first ICPC code and the second identical ICPC code exceeds a certain period of time (complaint-free period). The duration of the complaint-free period depends on the type of complication and is based on literature (Nielen, Davids, Gommer, Poos, & Verheij).
- End of follow-up: For the intention-to-treat analysis and the control group of the per-protocol analysis, this is the date which occurs 2 years after the date of patient inclusion (i.e. date of first or second practice visit). For the intervention group of the per-protocol analysis, this is the date which occurs 2 years after deprescribing has been initiated.
- Intention-to-treat analysis: Comparison between DPP intervention and control group of all patients who are eligible for deprescribing, regardless of whether or not patients have been deprescribed.
- Lost–to–follow–up: Patients who did not complete the 2–year follow–up period. Reasons for lost–to–follow–up include death, disenrollment from general practice, and drop–out of general practice. It is not always known why a patient has been lost to follow–up.
- Measurements at 1 year of follow-up: Measurements performed closest before 1 year of follow-up.
- Measurements at end of follow-up: Measurements performed closest before end of follow-up
- Per-protocol analysis: Comparison between intervention and control arm, only including patients who were deprescribed (and not restarted) in the intervention arm and including all eligible patients in the control arm.
- Quality-adjusted life year (QALY): A full year in full health. This is the outcome measure of interest for a CEA. QALY assumes a multiplication of length of life (e.g. a full year) with quality of life. The quality of life is expressed on a 0 (dead) to 1 (full health) scale to allow multiplication.
- Restarting medication after deprescribing: If restarting medication after deprescribing results in an equal or higher dose of medication than the initial dose prior to deprescribing.
- Start of follow-up: For the intention-to-treat analysis and the control group of the per-protocol analysis, this is the date of patient inclusion (i.e. date of first or second practice visit). For the intervention group of the per-protocol analysis, this is the date at which deprescribing has been initiated.
Analysis methods
What analysis method will be used and how treatment effects will be presented
The primary outcome of this study is the total number of diabetes complications occurring from the start of follow-up until the end of follow-up, which is a 2-year period. The data will be analysed using generalized linear mixed models (GLMM) with a Poisson distribution, with DPP as the main determinant. To correct for possible differences in follow-up duration, for the outcome variable, the incident rate of the number of diabetes complications that occur during follow-up will be calculated. A random effect variable will be added to the GLMM model to allow for possible clustering effects by general practice. Sensitivity analyses will be performed to assess whether the total number of diabetes complications is different between the first year of follow-up and the second year of follow-up (see “Timing of final analysis”).
Linear mixed models will be used to assess the effect of the DPP on health biomarkers (e.g. HbA1c level). These models will contain a baseline outcome variable to account for the regression to the mean effect [18] and a random effect variable to allow for possible clustering effects by general practice. Furthermore, a variable for time will be included in the model to assess differences between baseline measurements, measurements at 1 year of follow-up, and measurements at the end of follow-up.
Methods used for assumptions to be checked for statistical methods
Assumptions for the generalized linear mixed model that follows a Poisson distribution include the following:
- The mean and variation of the distribution are the same.
- Testing the model for overdispersion (i.e. if variation > mean) using the goodness-of-fit ratio of the Pearson χ^2^ statistic
- If the goodness-of-fit ratio is > 2, overdispersion may be considered, and the negative binomial distribution will be used [14]
- Relationship between numeric independent variables and log count of the outcome variable is linear
- This will be checked using residual plots.
Assumptions for linear mixed models include the following:
- Linear relationship between independent and dependent variable
- Will be checked using a scatterplot on the x-axis the residuals and on the y-axis the outcome variable.
- Normality of the residuals
- A QQ-plot will be made.
- Homoscedasticity (constant variance of residuals)
- A scatterplot of residuals versus predicted values will be made.
- No autocorrelation and no multicollinearity
- The variance inflation factor (VIF) will be used to assess correlation between independent variables.
Linear mixed models tend to be relatively robust against violations of model assumptions. If any of the assumptions are violated, results will be interpreted with caution [16].
Any planned subgroup analyses
In our pilot study, we observed that some patients were restarting medication after deprescribing. Subgroup analysis will be performed on this population to examine the extent to which they differ from the patients who did not restart their medication. We will do this by descriptively comparing characteristics of patients who restarted their medication after deprescribing with those who did not.
Missing data
We will report the reasons why patients are lost to follow-up and will compare patients with deprescribing to those without deprescribing in the DPP intervention. We have selected analysis techniques that are relatively insensitive to missing data, and no imputation will be performed.
Statistical software
IBM SPSS Statistics 28 (North Castle, New York, USA) will be used for statistical analyses.
Part 2: implementation analyses of OMED2 study
For the analyses of the implementation of the DPP, the same trial design and study population are used as described earlier (in “Trial design” section and “Trial population” section).
Research objectives on implementation of the DPP
A mixed-methods data analysis will be performed to evaluate the public health impact of the implementation of the DPP in general practice, based on the RE-AIM model [7]. Topic lists and data analysis of interviews will be inspired by the frameworks by Reeve et al. [15] (patient interviews) and the Extended Normalization Process Theory (ENPT [HCP interviews]) [10].
Re-AIM model (Reach, Efficacy, Adoption, Implementation, and Maintenance)
Table 6 depicts the data collection methods that are used to address all RE-AIM components. Table 6. Quantitative and qualitive data collection methods involved in addressing the RE-AIM componentsReachEffectivenessAdoptionImplementationMaintenanceStudy informationXEMRXXXXInterviews with HCPsXXXXInterviews with patientsXXNoMAD questionnaireXKnowledge questionnaireXFocus group with HCPsXXXEMR electronic medical records, HCPs health care providers, NoMAD normalization measure development
-
Reach: Who are affected by a programme, and does this population differ from the general population/those who do not receive the programme? Reach will be evaluated by the following:
-
Examining the absolute and relative number of frail elderly patients with diabetes included in the study and to what extent this group is representative for the total group of elderly patients with diabetes
-
In intervention practices, baseline characteristics of patients with deprescribing will be compared to characteristics of patients without deprescribing.
-
Effectiveness: Determine the consequences and outcomes of the programme, which will be reported in the effect article and the cost-effectiveness article of the study.
-
Adoption: The absolute number of included patients for whom deprescribing is initiated and who complete the total 2-year follow-up period. Knowledge transfer will be assessed with a knowledge questionnaire which will be sent to health care providers of both intervention and control practices after 1 year of follow-up.
-
Implementation: Refers to the extent to which a programme is delivered as intended. Information on implementation can be derived from the interviews with care providers and patients. These will be analysed using the ENPT framework [10] and the framework from Reeve et al. [15], respectively. Additionally, components of the ENPT framework will be assessed semiquantitatively using scores from the Normalization MeAsure Development (NoMAD) questionnaire [20]. This instrument addresses coherence, cognitive participation, collective action, and reflexive monitoring to quantify the normalization of an intervention. The scores at the start of follow-up will be compared to those at the end of follow-up. The integration of the DPP in general practice care has been previously investigated in a feasibility study [2].
-
Maintenance: Long-term maintenance of behaviour change. No quantitative measurements on the maintenance of the DPP have been performed at the end of the 2-year follow-up period. An additional focus group scheduled at the end of the follow-up will address maintenance of the DPP intervention.
Part 3: cost-effectiveness analyses of OMED2 study
For the analyses of the implementation of the DPP, the same trial design and study population are used as described earlier (in “Trial design” section and “Trial population” section).
Research objectives on the effect of deprescribing on cost-effectiveness
- To assess the cost-effectiveness of the DPP, a cost-effectiveness analysis is performed based on patient questionnaires (sent out five times) on utilization of health care facilities and health status.
- 2.Amount and dose of blood glucose–lowering medication (i.e. SU and insulin) prescribed at baseline and changes in total daily medication use over the 2-year follow-up.
Definitions of cost-effectiveness analysis (CEA) and QALY are outlined in paragraph “Variable definitions”. The Guidelines for health economic evaluations version 2024 will be used for the cost-effectiveness evaluation [5].
The CEA of the DPP requires individual patient data both on the cost side and the effect side of the cost-effectiveness equation. Cost data will be based on the questionnaires of the patients who have given informed consent to receive questionnaires. The questionnaire assesses the nature and frequency of different types of formal (healthcare) and informal care received during the previous 3 months. Questionnaires will be sent at the start of the study and subsequently after every 6 months until the 2-year follow-up period has been reached. The questions which will be used to assess cost-effectiveness are based on the iMTA (Institute for Medical Technology Assessment) Medical Cost Questionnaire and reflect the types of healthcare and informal care that older diabetes patients typically use. Since the questionnaires are sent every 6 months, while they have a recall period of 3 months, it will be necessary to extrapolate the units of healthcare and informal care use during the 3-month periods that were not observed. This is done by linear extrapolation on an individual basis. This way, it will be possible to construct a profile of healthcare and informal care use over the entire follow-up period. For all patients, units of healthcare use (e.g. GP visits, drugs, inpatient and outpatient visits) and non-healthcare use (e.g. hours of informal care received) will be valued by applying the standard unit costs as communicated by the National Healthcare Institute in 2024 [11]. Total costs of the 2-year follow-up period will be added to arrive at individual cost estimates for all participants. Costs for the second year will be discounted using a discount rate of 3% as advised in Dutch guidelines for health economic evaluation. Two subcategories of costs will be summarized as well, i.e. healthcare costs and patient and family costs, the latter comprising of informal care. Mean costs will be calculated and compared between groups.
The outcome measure for the cost-effectiveness analysis is cost per QALY gained. The number of QALYs for every participant and the mean number of QALYs for both groups will be estimated using the EQ-5D-5L questionnaire [19]. This questionnaire produces cross-sectional health states of the participant, which will be transferred to utility scores with the Dutch “EQ-5D tariff”, based on societal valuations of these health states across the 0 (dead) to 1 (full health scale). These utility values will be used to calculate QALYs by combining utility scores and follow-up time (until end of study or dying). Quality of life will be measured at baseline and every 6 months until the 2-year follow-up period has been reached. QALYs will be estimated using an area under the curve approach: the mean of two consecutive 6-month utility scores will be corrected by a factor of 0.5 (reflecting a half-year period), and utility scores of four consecutive half-year periods will be added to calculate the total number of QALYs observed during a 2-year follow-up period.
Missing data for both costs and utilities will be handled using multiple imputation by chained equations (MICE), incorporating trial arm, cluster indicators, and baseline covariates into imputation models. We will generate 5–10 imputed datasets, depending on the level of missingness, to ensure stable estimates. Analyses for each dataset will be combined using Rubin’s rule.
For the final cost-effectiveness analysis, cost differences between groups will be divided by QALY differences between groups to estimate the cost per QALY gained. Analysis will be performed at the individual level, accounting for the clustered design. Costs and QALYs will be compared between arms using regression models adjusted for baseline covariates. For the latter, we will stick to the same covariates that are used for the primary effectiveness analysis, as it is important to align the analysis of effectiveness for both the clinical effectiveness and cost-effectiveness. Sampling uncertainty will be quantified using nonparametric bootstrapping at the cluster level. We will generate at least 5000 bootstrap replications to ensure stable estimation of confidence intervals around cost and QALY differences. Each bootstrap sample will be drawn with replacement at the cluster level to preserve the randomization structure. Cost-effectiveness planes will be plotted to visually inspect the distribution of estimates over the four quadrants of the plane. A cost-effectiveness acceptability curve (CEAC) will be drawn based on the 5000 bootstraps. The CEAC will show the probability that the intervention is cost-effective at different threshold levels for cost-effectiveness, e.g. the Dutch willingness to pay thresholds of 20,000 €, 50,0000 €, and 80,000 € per QALY. For each of these threshold values, we will express the probability that the DPP programme is cost-effective, relative to usual care given to older diabetes patients.
The reference list from the paper itself. Each links out to its DOI / PubMed record.
- 1Andriessen C, Blom MT, van Hoek BA, de Boer AW, Denig P, de Wit GA. A deprescribing programme aimed to optimise blood glucose-lowering medication in older people with type 2 diabetes mellitus, the OMED 2-study: the study protocol for a randomised controlled trial. Trials. 2024:25(1);505.10.1186/s 13063-024-08249-9PMC 1127105539049109 · doi ↗ · pubmed ↗
- 2Andriessen C, Blom MT, van Hoek BA, de Boer AW, Denig P, Herings R, et al. Feasibility of implementing an intervention in general practice for deprescribing of glucose-lowering medication in overtreated elderly. Family Practice. 2025:42(5);cmaf 064.10.1093/fampra/cmaf 064PMC 1241190540910519 · doi ↗ · pubmed ↗