An exploratory microarray analysis of estrogen-mediated gene expression in central pathways that control energy balance in female rats (Rattus norvegicus)
Henry Lang, Kaitlin Burch, Dusti Sloan

TL;DR
This study explores how estrogen affects gene expression in brain regions that control energy balance in female rats.
Contribution
The study provides preliminary gene expression profiles of estrogen regulation in specific brain regions related to energy balance.
Findings
Estrogen treatment increased expression of specific genes like Npy1r and Avp in the PVN.
Gene expression in the NTS was minimally affected by estrogen treatment.
Pathways related to cell signaling were enriched in the PVN following estrogen treatment.
Abstract
Obesity and associated conditions are concerning, especially during menopause. Estrogens influence energy balance in key brain regions including the arcuate nucleus (ARC), paraventricular nucleus (PVN), and the nucleus of the solitary tract (NTS). The mechanisms by which estrogens influence energy balance are incompletely understood. Accordingly, we used a microarray analysis to investigate estradiol benzoate (EB)-regulated gene expression within the ARC, PVN, and NTS of ovariectomized rats treated with EB or Oil vehicle. DAVID Bioinformatics was used to identify enriched biological themes. Within the ARC, EB did not alter gene expression of neuropeptides or receptors known to influence energy balance. In the PVN, EB treatment increased Npy1r and Avp expression, with notable effect sizes in the expression of Oxt, Crh, Trh, and Mc3r. Gene expression in the NTS was minimally affected by…
Genes, proteins, chemicals, diseases, species, mutations and cell lines named across the full text — each resolved to its canonical identifier and authoritative record.
Click any figure to enlarge with its caption.
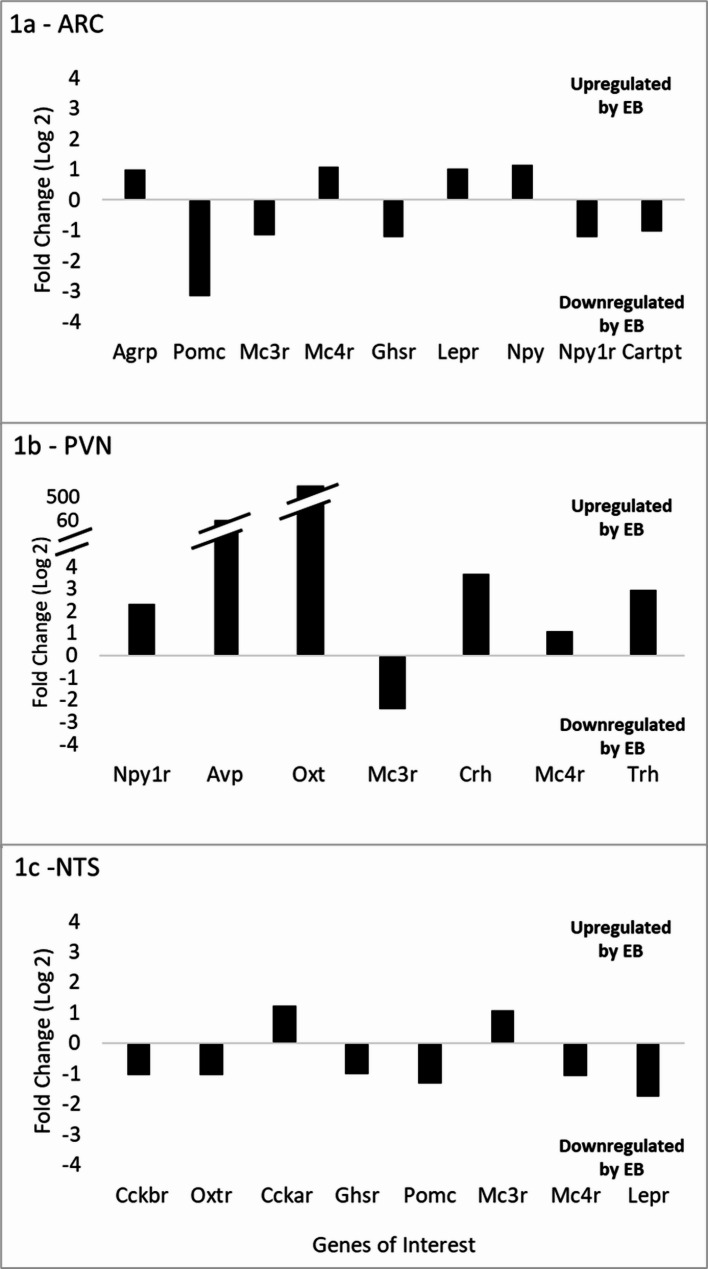 Figure 1
Peer Reviews
No public reviews on file for this paper yet. If you reviewed it on a platform where reviews are public (OpenReview, ICLR, NeurIPS, ICML), you can paste yours below so the community can read it here.
Videos
No videos yet. Explain this paper in a talk, walkthrough, or lecture? Add one.
Taxonomy
TopicsMenopause: Health Impacts and Treatments · Hypothalamic control of reproductive hormones · Regulation of Appetite and Obesity
Introduction
Overweight or obese body habitus predisposes patients to health risks, including cancer, cardiovascular disease, and diabetes [1]. Older women are particularly susceptible to weight gain as they approach menopause [2, 3], and early animal studies confirm that estrogens decrease food intake and body weight [4–7]. Although the association between estrogen deficiency and weight gain is well established [8], the central mechanisms by which estrogens regulate energy intake and expenditure are complex and incompletely understood.
Eating is a complex behavior that is integrated across several brain regions. Communication between these areas involves numerous neurohormones, neurotransmitters, receptors, and intracellular signaling pathways. The arcuate nucleus of the hypothalamus (ARC) responds to nutrients and circulating hormones and communicates with the lateral hypothalamus (LH) to initiate eating, and to the paraventricular nucleus (PVN) of the hypothalamus to inhibit eating. The ARC, LH, and PVN are interconnected and communicate with the hindbrain, including the nucleus of the solitary tract (NTS) [9–11]. Estrogen receptors are located in CNS regions that influence food intake [12–14], and the effect of estrogens on feeding and energy use occur via these receptors [15–20].
Many studies involving gene expression focus on a limited number of genes. DNA microarray technology offers a broad approach to identifying genes that are differentially regulated in response to treatment. We utilized microarray analysis to explore gene expression changes induced by estradiol benzoate (EB). mRNA was isolated from the ARC, PVN, and NTS of ovariectomized (OVX) rats treated with EB (n = 3) or Oil vehicle (n = 3). We explored genes associated with energy balance and candidate genes for future studies. Microarray results for over 23,000 genes are available in NIH’s Gene Expression Omnibus (GEO).
Materials and methods
Surgery
Adult (90 days old), female Sprague-Dawley rats (Charles River 001CD) were bilaterally OVX using a protocol well established in this laboratory [21–23]. Briefly, rats received oral meloxicam (0.15 mL at 1.5 mg/mL), then were anesthetized with isoflurane (3–5% induction; 1.5-3% maintenance). Using a ventral approach, ovaries were removed, and rats were allowed to recover one week before implementing the EB treatment protocol. Body weight was recorded throughout the study to assess animal health and confirm the effects of treatment.
EB treatment protocol
Animals received subcutaneous injections of either 10 µg EB in 0.1 mL of oil vehicle (EB; n = 3) or 0.1 mL of oil vehicle (Oil; n = 3) for two consecutive days (see timeline in Additional file 1). This schedule simulates the rise and peak of EB during the proestrus phase of the four-day estrous cycle. Tissues were collected 48 h after the second EB injection, a time point corresponding to maximal physiological and behavioral effects of EB [23]. Uteri were collected and weighed to confirm estrogenic activity [22, 23]. This well-established protocol, adapted from Woolley and McEwen, along with confirmation of EB effects on uterine hypertrophy by Miura et al. eliminates the need to measure circulating EB levels [22–26].
Tissue collection
On the day of termination, rats were anesthetized with CO_2_ inhalation and decapitated. Following established protocol [25], brains were rapidly extracted, flash-frozen in liquid nitrogen, and stored at -80 °C until tissue punches were collected. Bilateral punches from coronal sections were obtained from the ARC, PVN, and NTS using a 1 × 3 mm tissue punch. Locations were determined using stereotaxic coordinates from the Paxinos and Watson atlas [27], with major landmarks described in previous publications from this lab [28, 29]. Using the following coordinates, samples were collected from the ARC (− 2.64 to − 3.24 from bregma), PVN (− 1.32 to − 1.92 from bregma) and NTS (− 13.56 to − 14.40 from bregma). Tissue was stored in RNAlater and frozen (Ambion, AM7020) until mRNA isolation [25].
RNA isolation and microarray analysis
RNA was isolated using a Biorad Aurum Total RNA Mini kit (732–6820) per manufacturer’s instructions. RNA was sent to Thermo Fisher Scientific, Inc. (TFS) for transcriptome analysis. The mRNA samples passed all quality control checks. The microarray, Rat Clariom S Pico Assay (Applied Biosystems, 902937), compared gene expression for EB-treated versus Oil-treated rats for over 23,000 genes. TFS required a minimum of three samples per treatment group for the microarray; three samples from the PVN, ARC, and DVC of EB- and Oil-treated rats were provided. Although microarray studies often use fewer replicates due to cost and time, a minimum of three replicates is recommended [30]. Gene notation follows the National Center for Biotechnology Database: proteins are capitalized (e.g., “OXT”), whereas mRNA is referred to as “Oxt”.
Statistical analysis
Cell intensity (CEL) files from the microarray analysis were background-adjusted, normalized, and log [2] transformed by TFS following methods described by Irizarry [31]. Processed output chip files (CHP) were analyzed using the Transcriptome Analysis Console (TAC) software 4.0. TAC utilizes an empirical Bayes (eBayes) method with one-way ANOVA (t-test not available in this software) to assess statistical significance at p < 0.05 and an absolute fold change ≥ 2. The eBayes method is commonly used as a data reduction tool to stabilize variance in studies that include thousands of genes [32]. TAC reports both unadjusted p-values and values for false discovery rates (FDR). Data are reported as means ± standard deviation (SD) of signal intensity (Log 2) and fold change (Log 2), with fold change presented as absolute values.
Overview of exploratory approach
Microarray analyses frequently rely on small sample sizes [30], and this study is no exception. Moreover, micro-dissected regions, like those sampled in our study, exhibit high biological variability due to technical differences in tissue collection. Given these limitations, results should be considered exploratory.
Analyses included a targeted examination of preselected genes involved in melanocortin signaling, as well as a transcriptome-wide survey of differentially expressed genes (DEGs) with potential biological relevance. Genes associated with melanocortin signaling and downstream effects were investigated as “genes of interest” in the ARC, PVN, and NTS. To control for type I error, FDR was initially calculated by TAC across all 23,188 genes. For preselected gene subsets, q-values were calculated using the Benjamini-Hochberg procedure (Excel). Effect sizes were calculated using Cohen’s d equation (Excel).
For the transcriptome-wide survey of EB-regulated genes, DEGs identified by TAC with unadjusted p-values ≤ 0.05 and fold changes ≥ │2│ were selected for further analysis. These DEGs were visualized using heatmaps and analyzed using DAVID (Database for Annotation, Visualization, and Integrated Discovery), an NIH bioinformatics tool that organizes large datasets into meaningful biological categories [33, 34]. Genes from each brain region were sorted by up- or down-regulation by EB. DAVID functional annotation clustering results are reported using three Gene Ontology (GO) categories that, with some overlap, represent groups of genes involved in biological processes, cellular components, and molecular function: GOTERM_BP_FAT (BP = Biological Process), GOTERM_CC_FAT (CC = Cellular Component), and GOTERM_MF_FAT (MF = Molecular Function).
Results
All microarray data, including CEL files and CHP files, have been deposited in NCBI GEO under accession number GSE293502. Biological activity of EB was confirmed by measuring uterine weights [22, 23, 26]. An independent t-test revealed that uterine weights in EB-treated animals were significantly higher than in controls [t(4) = -13.07, p < 0.001].
ARC, PVN, NTS heatmaps—genes of interest
Heatmaps of selected genes of interest within the ARC, PVN, and NTS (Additional file 2) show that EB-treated and Oil-treated samples did not form distinct clusters, indicating substantial within-group variability.
ARC—genes of interest
EB did not significantly affect the expression of receptors for ghrelin (Ghsr), leptin (Lepr), melanocortin 3 (Mc3r) or 4 (Mc4r), or neuropeptide Y (Npy1r). In addition, EB did not cause significant differential expression of neuropeptide Y (Npy), agouti-related peptide (AgRP), CART pre-propeptide (Cartpt), or proopiomelanocortin (Pomc), although Pomc, the precursor to α-MSH, was threefold higher in the oil-treated group (fold change = 3.17) with a medium effect size (d = 0.52) (Fig. 1a, Table 1a).
PVN—genes of interest
In terms of receptors in the PVN, EB did not significantly affect the expression of Mc4r or Mc3r after correction for multiple testing. However, Mc3r expression was twofold higher in the Oil-treated group with a large effect size (Fold change = 2.44, d = 1.64). Npy1r expression was significantly higher in the EB-treated group with a notable fold change and effect size (Fold change = 2.31; q = 0.001; d = 5.7). Vasopressin (Avp) expression was significantly higher in the EB-treated group with a notable fold change and effect size (Fold change = 57.11, q = 0.025, d = 2.71). Although not statistically significant, oxytocin (Oxt) expression showed a large fold change and effect size, suggesting potential biological relevance (Fold change = 506.15, q = 0.098, d = 2.53). Corticotropin-releasing hormone (Crh) and thyrotropin-releasing hormone (Trh) expression levels were approximately three-fold higher in the EB-treated group, though not statistically significant (Crh: Fold change = 3.66, q = 0.146, d = 1.73; Trh: Fold change = 2.97, q = 0.300, d = 1.19) (Fig. 1b, Table 1b).
NTS—genes of interest
Within the NTS, EB did not significantly affect the expression of receptors for cholecystokinin A (Cckar) or B (Cckbr), oxytocin (Oxtr), Ghsr, Mc3r, Mc4r, and Lepr, and did not induce differential expression of Pomc (Fig. 1c, Table 1c).
Fig. 1. Fold change differences in gene expression for EB- vs. Oil-treated rats in the ARC (1a), PVN (1b), and NTS (1c). Positive values indicate upregulation by EB; negative values indicate downregulation. Each bar represents the fold change for genes of interest
Table 1. Analyses for genes of interest in the ARC, PVN, and NTSGene (Symbol)Public Gene ID RefSeq mRNAOil Signal Intensity Log 2 (SD)EB Signal Intensity Log 2 (SD)Fold Change Log 2Unadjusted p-valueBenjamini-Hochberg Adjusted p-value (q)Cohen’s d Effect size (d) 1a-ARC Genes of Interest Agouti related neuropeptide (Agrp)NM_0336506.84(1.57)6.86(0.91)1.010.2990.8580.02 Proopiomelanocortin (Pomc)NM_13932611.5(1.98)9.84(4.01) – 3.17 0.3370.858 0.52 Melanocortin 3 receptor (Mc3r)NM_0010252708.73(1.01)8.51(0.91)– 1.160.3890.8580.23 Melanocortin 4 receptor (Mc4r)NM_0130996.9(0.06)7.03(0.11)1.090.4520.858 1.47 Ghrelin receptor (Ghsr)NM_0320759.63(0.28)9.32(0.21)– 1.230.5620.858 1.25 Leptin receptor (Lepr)NM_0125969.65(0.09)9.7(0.63)1.030.5850.8580.11 Neuropeptide Y (Npy)NM_01261413.63(0.92)13.44(0.68)1.140.6670.8580.24 Neuropeptide Y receptor 1 (Npy1r)NM_0011133579.99(0.24)9.7(0.79)– 1.220.7960.870 0.50 CART prepropeptide (Cartpt)NM_01711015.2(0.76)15.12(0.75)– 1.050.8700.8700.11 1b-PVN Genes of Interest Neuropeptide Y receptor 1 (Npy1r)NM_0011133578.73(0.01)9.94(0.3) 2.31 0.0002 0.001
5.7 Arginine vasopressin (Avp)NM_0169926.96(2.03)12.79(2.27) 57.11 0.007 0.025
2.71 Oxytocin (Oxt)NM_0129966.95(4.57)15.93(2.07) 506.15 0.0420.098 2.53 Melanocortin 3 receptor (Mc3r)NM_0010252708.32(0.69)7.03(0.87) 2.44 0.1030.146 1.64 Corticotropin-releasing hormone (Crh)NM_0310197.5(0.93)9.37(1.21) 3.66 0.1040.146 1.73 Melanocortin 4 receptor (Mc4r)NM_0130997.95(0.21)8.09(0.6)1.10.1530.1780.31 Thyrotropin-releasing hormone (Trh)NM_0130465.36(0.63)6.93(1.75) 2.97 0.3000.300 1.19
1c-NTS Genes of Interest Cholesytokinin B (Cckbr)NM_0131657.22(0.32)7.16(0.18)1.040.1150.9170.23 Oxytocin receptor (Oxtr)NM_0128715.15(0.08)5.08(0.27)1.050.3550.9270.35 Cholecystokinin A (Cckar)NM_0126887.26(0.56)7.56(0.61)1.240.4960.9270.51 Growth hormone secretagogue receptor (Ghsr)NM_0320758.65(0.07)8.61(0.15)1.020.5710.9270.34 Proopiomelanocortin (Pomc)NM_1393265.22(0.5)4.8(0.36)1.330.7970.9270.96 Melanocortin 3 receptor (Mc3r)NM_0010252704.64(0.12)4.76(0.13)1.090.8250.9270.95 Melanocortin 4 receptor (Mc4r)NM_0130998.36(0.23)8.25(0.11)1.080.8660.9270.61 Leptin Receptor (Lepr)NM_0125968.64(0.16)7.83(1.43)1.750.9270.9270.79Within the ARC (a), PVN (b), and NTS (c), genes, symbols and Public Gene IDs are listed. Data generated using TAC include mean signal intensities (log 2), standard deviation (SD), absolute fold change (log 2), and unadjusted p-values. Benjamini-Hochberg adjusted q-values were calculated for selected genes and Cohen’s d equation was used to calculate effect sizes (d).Bold text delineates the genes investigated within each brain region (ARC, PVN, and NTS)
ARC, PVN, NTS heatmaps—transcriptome-wide survey of DEGs.
Heatmaps representing transcriptome-wide differentially expressed genes are included in Additional file 3. Within the ARC and NTS, EB- and Oil-treated samples formed distinct clusters. DEGs within the PVN showed that EB-treated samples clustered together, but Oil-treated sample, 9SR4406A_B03, did not cluster with the other two oil-treated samples.
ARC—transcriptome-wide survey of DEGs and DAVID bioinformatics
TAC software identified 24 genes upregulated and 75 genes downregulated by EB, and a gene list is included in Additional file 4, tab a.
GO analysis of upregulated genes, conducted using DAVID revealed no statistically significant terms within the categories GOTERM_BP_FAT or GOTERM_CC_FAT after Benjamini-Hochberg correction. Within the GOTERM_MF_FAT category, “cation binding” was significantly enriched (GO: 0043169, fold-enrichment = 2.75, q = 0.04). Genes contributing to this enrichment included RET, S100G, CHRNB3, TRPC3, CD93, EBF1, KCNA4, EBF3, RXFP1, SLC6A3, CALB2, NR4A2, ATP13A5, and TRIM16 suggesting that EB may be associated with molecular pathways related to cation binding. Downregulated genes were not significantly enriched under GOTERM_MF_FAT. However, there were many genes associated with GOTERM_BP_FAT and GOTERM_CC_FAT, and most of these genes were associated with reproductive processes (e.g., germ cell development and motility).
PVN—transcriptome-wide survey of DEGs and DAVID bioinformatics
TAC software identified 51 genes upregulated and 50 genes downregulated by EB and data for these genes are included in Additional file 4, tab b.
GO analysis of upregulated genes (Additional file 5, tab a), showed significant enrichment within all three major categories. Within GOTERM_BP_FAT, four groups were significantly enriched for regulation of biological quality, cell communication, neuropeptide signaling, and signaling. GO GOTERM_CC_FAT showed significant enrichment for cell junction, dense core granule, synapse, neuronal dense core vesicle, and secretory vesicle. Lastly, within GOTERM_MF_FAT, two groups were significantly enriched for neuropeptide receptor activity and neuropeptide Y receptor activity.
GO analysis of downregulated genes (Additional file 5, tab b) showed significant enrichment within the biological process and cellular component categories, but not in the molecular function category. Within enriched categories many groups are clearly associated with cell signaling.
NTS—transcriptome-wide survey of DEGs and DAVID bioinformatics.
TAC software identified 13 genes upregulated and 8 downregulated by EB treatment (Additional file 4, tab c). Only one gene, ankyrin repeat and SOCS box containing 15 (Asb15), met the significance threshold after FDR correction.
DAVID analysis of upregulated and downregulated genes showed no significant enrichment in either of the three GO categories.
Discussion
This study examined the effects of EB on gene expression in the ARC, PVN, and NTS, three brain regions involved in energy balance [12–14].
In the ARC, EB did not significantly alter Pomc expression, although a threefold decrease was observed with a medium effect size. Expression of key neuropeptides and their receptors in the ARC remained unchanged following EB treatment. This trend suggests possible physiological feedback suppression due to prolonged EB exposure (i.e., samples were collected 48 h after the second EB injection instead of at an earlier timepoint) [35–38]. GO analysis indicated enrichment in genes associated with cation binding, particularly those involved in ion transport, neurotransmission, and other intracellular signaling pathways. For instance, TRPC3 which was up-regulated by EB (Fold change = 2.7; unadjusted p-value = 0.02), is involved in calcium signaling [39]. While calcium is a well-established second messenger, its specific role in energy balance within the ARC remains unclear.
In the PVN, Npy1r expression was significantly increased in EB-treated animals, with a large effect size. Npy1r expression promotes feeding when it binds NPY in the LH. In the ARC, NPY inhibits POMC/CART neurons from activating the satiety center [10, 11]. The upregulation of Npy1r seems contradictory to the known anorexigenic effects of EB, and body weight was reduced, as expected based on previous work, in the EB-treated group of our study. This result may reflect time- and/or dose-dependent regulatory mechanisms. Though not statistically significant, expression of Oxt, Crh, and Trh was higher in the EB-treated group, these hormones are associated with decreased food intake and body weight. EB also increased expression of Avp, a gene of growing interest in satiety research [40–42]. GO analysis of PVN genes suggested that EB influences cell communication, for example by increasing expression of hormones and receptors that are involved in energy homeostasis (i.e. Oxt, Avp, Npy1r).
In the NTS, no significant EB-mediated changes were observed in Pomc, melanocortin receptors, Oxtr, Lepr, Ghsr, or cholecystokinin receptors. Analysis of differentially expressed genes revealed that EB upregulates Asb15. This gene is known to regulate skeletal muscle growth and differentiation in rodent models, mostly through modulation of signal transduction pathways [43, 44]. To our knowledge, this is the first report of Asb15 regulation by EB in the NTS or elsewhere. However, beyond the assumption that EB directly or indirectly modulates Asb15 transcription, the significance of this finding remains unclear given the current literature. GO analysis of genes regulated in the NTS did not reveal significant enrichment in any of the functional categories.
Limitations
Our sample size was limited (n = 3 per group). In addition, technical challenges associated with microdissection can lead to increased variability, and our data clearly indicated variability within groups. Furthermore, the use of pharmacological doses of exogenous EB, as employed in this study, presents inherent limitations (e.g., decreased receptor sensitivity). Our study was also restricted to a single time point limiting any temporal findings. Future studies using physiological doses of EB, with tissue sampling at multiple time points, may clarify our understanding of feedback mechanisms involved in these pathways. Finally, surgical menopause causes immediate effects on food intake and body weight [22, 23, 25]. Though our lab is interested in the immediate changes, it should be noted that many other effects of menopause may take several weeks or longer [45], and these long-term changes are not represented in this data set. Given the limitations of this study, results should be interpreted with caution and used to design future experiments with an increased sample size.
Supplementary Information
Below is the link to the electronic supplementary material.
Additional file 1. Timeline of Events. A timeline illustrating the sequence of experimental procedures is provided, beginning with arrival of rats at the facility, followed by ovariectomy, implementation of hormone treatment, termination and tissue collection.
Additional file 2. Heatmaps_Selected Genes. Heatmaps for genes of interest in the ARC, PVN, and NTS from EB- vs. Oil-treated samples. Heatmaps were generated using TAC to visualize the expression of selected genes of interest in the ARC (a), PVN (b), and NTS (c). Each column represents an individual sample; each row represents a single gene. Expression values are shown as log 2 transformed signal intensities. Red indicates the highest expression and blue indicates the lowest
Additional file 3. Heatmaps_DEGs. Differentially expressed genes (DEGs) in the ARC, PVN, and NTS from EB-vs. Oil-treated samples. Heatmaps were generated using TAC to visualize DEGs in the ARC (a), PVN (b), NTS (c). Genes were selected based on unadjusted p-values ≤ 0.05 and absolute fold change > 2. With the exception of Asb15 in the NTS, no genes met significance thresholds after FDR correction, therefore these heatmaps are presented for exploratory purposes only. Each column represents an individual sample, and each row represents a single gene. Expression values are shown as log 2 transformed signal intensities. Red indicates the highest expression, and blue indicates the lowest.
Additional file 4. Transcriptome-wide DEGs. Transcriptome-wide DEGs within the ARC (tab a), PVN, (tab b) and NTS (tab c). This file contains lists of DEGs (EB- vs. Oil-treated) in the ARC, PVN, and NTS generated by TAC. No genes met significance thresholds after Benjamini-Hochberg correction, except Asb15 in the NTS. These data are provided for transparency and to support exploratory analysis using the DAVID Bioinformatics Tool.
Additional file 5. GO Analysis of EB-upregulated and downregulated genes in the PVN. EB-upregulated genes in the PVN were analyzed using the DAVID Bioinformatics Tool (tab a). Significant enrichment was observed across all three GO categories. GO terms and associated genes are listed along with fold enrichment values and Benjamini-Hochberg adjusted q-values. EB-downregulated genes (tab b) showed significant enrichment in two categories: biological process and cellular component. GO terms and associated genes are reported with fold enrichment values and Benjamini-Hochberg adjusted q-values.
The reference list from the paper itself. Each links out to its DOI / PubMed record.
- 1Curtis KS. Estradiol, and osmolality: behavioral responses and central pathway S. Physiol Behav. 2015;152(0 0):422–30.10.1016/j.physbeh.2015.06.017PMC 466111326074202 · doi ↗ · pubmed ↗
- 2Burch KE, Mc Cracken K, Buck DJ, Davis RL, Sloan DK, Curtis KS. Relationship between Circulating metabolic hormones and their central receptors during Ovariectomy-Induced weight gain in Rats. Front Physiol. 2022;12.10.3389/fphys.2021.800266 PMC 876684335069259 · doi ↗ · pubmed ↗