Association between physical activity levels, sedentary time, and mild cognitive impairment in older adults
Wei Chen, Lei Zhang, Palida Abulizi, Ting Zou, Xuan Xiang, Ruikai Wu, Xiaohui Zhou

TL;DR
This study finds that moderate physical activity and limited sedentary time are linked to a lower risk of mild cognitive impairment in older adults.
Contribution
The study identifies optimal thresholds for physical activity and sedentary time to reduce MCI risk in older adults.
Findings
Higher physical activity levels (1,485–4,000 MET-min/wk) are associated with reduced MCI risk.
Sedentary time under 200 minutes per day is linked to lower MCI risk.
Both associations were confirmed robust through sensitivity analyses.
Abstract
Research indicates that mild cognitive impairment (MCI) in older adults is associated with physical activity levels (PAL) and sedentary behavior duration. However, the precise nature of the relationships between these factors and MCI warrants further investigation. A cross-sectional survey was conducted from August to October 2025 using cluster sampling in community settings, involving 1,465 older adults. Cognitive function was assessed using the Montreal Cognitive Assessment (MoCA). PAL were assessed using the International Physical Activity Questionnaire-Short Form (IPAQ-SF), while sedentary time was self-reported. Logistic regression models were employed to analyze the associations between PAL, sedentary time, and MCI. Restricted cubic spline (RCS) analysis was used to further explore the dose–response relationships. Sensitivity analyses were also performed to validate the observed…
Genes, proteins, chemicals, diseases, species, mutations and cell lines named across the full text — each resolved to its canonical identifier and authoritative record.
Click any figure to enlarge with its caption.
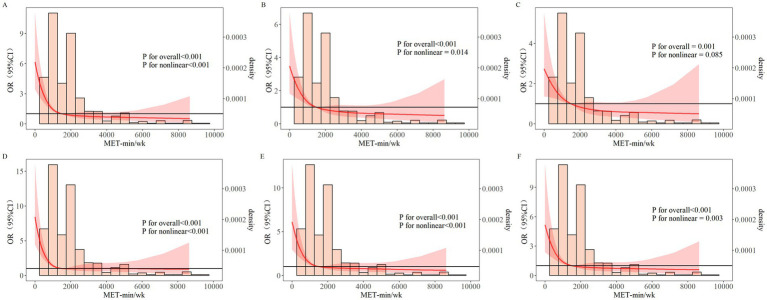 Figure 1
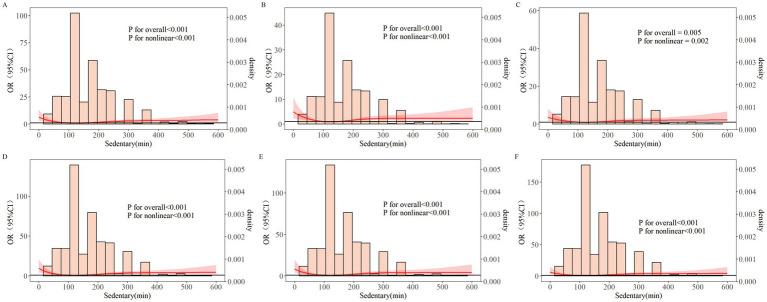 Figure 2
| Variables | Total ( | Cognitive normal group ( | MCI group ( | Statistic |
|
|---|---|---|---|---|---|
| Physical activity, |
| ||||
| Q1 | 291 (19.86) | 229 (17.51) | 62 (39.49) | ||
| Q2 | 431 (29.42) | 388 (29.66) | 43 (27.39) | ||
| Q3 | 202 (13.79) | 184 (14.07) | 18 (11.46) | ||
| Q4 | 541 (36.93) | 507 (38.76) | 34 (21.66) | ||
| Sedentary, |
| ||||
| Q1 | 290 (19.80) | 251 (19.19) | 39 (24.84) | ||
| Q2 | 417 (28.46) | 388 (29.66) | 29 (18.47) | ||
| Q3 | 323 (22.05) | 300 (22.94) | 23 (14.65) | ||
| Q4 | 435 (29.69) | 369 (28.21) | 66 (42.04) | ||
| Age, | 71.00 (66.00,76.00) | 71.00 (66.00,76.00) | 72.00 (67.00,78.00) |
| |
| Gender, | 0.352 | ||||
| Male | 658 (44.91) | 582 (44.50) | 76 (48.41) | ||
| Woman | 807 (55.09) | 726 (55.50) | 81 (51.59) | ||
| Educational level, |
| ||||
| Illiterate | 363 (24.78) | 315 (24.08) | 48 (30.57) | ||
| Primary school | 506 (34.54) | 445 (34.02) | 61 (38.85) | ||
| Junior high school and above | 596 (40.68) | 548 (41.90) | 48 (30.57) | ||
| Marital status, | – | 0.671 | |||
| Married, living with spouse | 1,197 (81.71) | 1,073 (82.03) | 124 (78.98) | ||
| Married, but temporarily not living with spouse due to work or other reasons | 59 (4.03) | 52 (3.98) | 7 (4.46) | ||
| Separation | 18 (1.23) | 15 (1.15) | 3 (1.91) | ||
| Divorced | 25 (1.71) | 21 (1.61) | 4 (2.55) | ||
| Widowed | 165 (11.26) | 146 (11.16) | 19 (12.10) | ||
| Never married | 1 (0.07) | 1 (0.08) | 0 (0.00) | ||
| Pre-retirement occupation, | 0.686 | ||||
| Civil servants or enterprises, and institutions | 130 (8.87) | 117 (8.94) | 13 (8.28) | ||
| Professional technical personnel | 124 (8.46) | 113 (8.64) | 11 (7.01) | ||
| Office personnel or staff | 164 (11.19) | 144 (11.01) | 20 (12.74) | ||
| Commercial services | 19 (1.30) | 15 (1.15) | 4 (2.55) | ||
| Agricultural, forestry, animal husbandry, and fishery production personnel | 878 (59.93) | 784 (59.94) | 94 (59.87) | ||
| Production and transportation equipment operators | 150 (10.24) | 135 (10.32) | 15 (9.55) | ||
| Residential style, | 0.452 | ||||
| Spouse cohabitation | 1,276 (87.10) | 1,143 (87.39) | 133 (84.71) | ||
| Shared residence for children | 116 (7.92) | 103 (7.87) | 13 (8.28) | ||
| Living alone | 73 (4.98) | 62 (4.74) | 11 (7.01) | ||
| Number of days living alone, |
| ||||
| 0 | 676 (46.14) | 607 (46.41) | 69 (43.95) | ||
| 1 ~ 29 | 622 (42.46) | 560 (42.81) | 62 (39.49) | ||
| 30 ~ 59 | 53 (3.62) | 42 (3.21) | 11 (7.01) | ||
| 60 ~ 90 | 19 (1.30) | 19 (1.45) | 0 (0.00) | ||
| 90 and above | 95 (6.48) | 80 (6.12) | 15 (9.55) | ||
| Central obesity, |
| ||||
| No | 244 (16.66) | 208 (15.90) | 36 (22.93) | ||
| Yes | 1,221 (83.34) | 1,100 (84.10) | 121 (77.07) | ||
| Smoking habits, | 0.889 | ||||
| No | 1,265 (86.35) | 1,130 (86.39) | 135 (85.99) | ||
| Yes | 200 (13.65) | 178 (13.61) | 22 (14.01) | ||
| Drinking habits, | 0.592 | ||||
| No | 1,248 (85.19) | 1,112 (85.02) | 136 (86.62) | ||
| Yes | 217 (14.81) | 196 (14.98) | 21 (13.38) | ||
| Eating habits, |
| ||||
| Balanced meat and vegetables | 1,365 (93.17) | 1,228 (93.88) | 137 (87.26) | ||
| Mainly meat dishes | 62 (4.23) | 50 (3.82) | 12 (7.64) | ||
| Mainly vegetarian | 38 (2.59) | 30 (2.29) | 8 (5.10) | ||
| Sleep quality, |
| ||||
| Very good | 491 (33.52) | 436 (33.33) | 55 (35.03) | ||
| Better | 506 (34.54) | 468 (35.78) | 38 (24.20) | ||
| Poor | 359 (24.51) | 319 (24.39) | 40 (25.48) | ||
| Very poor | 109 (7.44) | 85 (6.50) | 24 (15.29) | ||
| ADL, |
| ||||
| Normal | 1,096 (74.81) | 1,016 (77.68) | 80 (50.96) | ||
| Obstacle | 369 (25.19) | 292 (22.32) | 77 (49.04) | ||
| Family history of dementia, | 0.319 | ||||
| No | 1,452 (99.11) | 1,298 (99.24) | 154 (98.09) | ||
| Yes | 13 (0.89) | 10 (0.76) | 3 (1.91) | ||
| Head trauma, | 1 | ||||
| No | 1,448 (98.84) | 1,293 (98.85) | 155 (98.73) | ||
| Yes | 17 (1.16) | 15 (1.15) | 2 (1.27) | ||
| Depression, |
| ||||
| No | 950 (64.85) | 879 (67.20) | 71 (45.22) | ||
| Yes | 515 (35.15) | 429 (32.80) | 86 (54.78) | ||
| Hypertension, | 0.735 | ||||
| No | 514 (35.09) | 457 (34.94) | 57 (36.31) | ||
| Yes | 951 (64.91) | 851 (65.06) | 100 (63.69) | ||
| Abnormal blood lipids, |
| ||||
| No | 1,446 (98.70) | 1,297 (99.16) | 149 (94.90) | ||
| Yes | 19 (1.30) | 11 (0.84) | 8 (5.10) | ||
| Diabetes, | 0.693 | ||||
| No | 852 (58.16) | 763 (58.33) | 89 (56.69) | ||
| Yes | 613 (41.84) | 545 (41.67) | 68 (43.31) | ||
| Chronic lung diseases, | - | 0.549 | |||
| No | 1,458 (99.52) | 1,302 (99.54) | 156 (99.36) | ||
| Yes | 7 (0.48) | 6 (0.46) | 1 (0.64) | ||
| Heart disease, | 0.178 | ||||
| No | 1,038 (70.85) | 934 (71.41) | 104 (66.24) | ||
| Yes | 427 (29.15) | 374 (28.59) | 53 (33.76) | ||
| Stroke, |
| ||||
| No | 1,436 (98.02) | 1,296 (99.08) | 140 (89.17) | ||
| Yes | 29 (1.98) | 12 (0.92) | 17 (10.83) | ||
| Stomach diseases, |
| ||||
| No | 1,442 (98.43) | 1,292 (98.78) | 150 (95.54) | ||
| Yes | 23 (1.57) | 16 (1.22) | 7 (4.46) | ||
| Arthritis or rheumatism, | – |
| |||
| No | 1,459 (99.59) | 1,305 (99.77) | 154 (98.09) | ||
| Yes | 6 (0.41) | 3 (0.23) | 3 (1.91) |
| Variables | Assignment table |
|---|---|
| Physical activity | 1 = Q1, 2 = Q2, 3 = Q3, 4 = Q4 |
| Sedentary | 1 = Q1, 2 = Q2, 3 = Q3, 4 = Q4 |
| Age | Continuous Variable |
| Education level | 1 = Illiterate, 2 = Primary School, 3 = Junior High School And Above |
| Number of days living alone | 1 = 0, 2 = 1 ~ 29, 3 = 30 ~ 59, 4 = 60 ~ 89, 5 = 90 And Above |
| Central obesity | 1 = No, 2 = Yes |
| Dietary habits | 1 = Balanced Meat And Vegetable Diet, 2 = Mainly Meat Based Diet, 3 = Mainly Vegetarian Diet |
| Sleep quality | 1 = Very Good, 2 = Good, 3 = Poor, 4 = Very Poor |
| ADL | 1 = Normal, 2 = Obstacle |
| Depression | 1 = No, 2 = Yes |
| Dyslipidemia | 1 = No, 2 = Yes |
| Stroke | 1 = No, 2 = Yes |
| Gastric diseases | 1 = No, 2 = Yes |
| Arthritis or rheumatism | 1 = No, 2 = Yes |
| Variable | Model 1 collinearity statistics | Variable | Model 2 collinearity statistics | Variable | Model 3 collinearity statistics | Variable | Model 4 collinearity statistics | Variable | Model 5 collinearity statistics | Variable | Model 6 collinearity statistics | ||||||
|---|---|---|---|---|---|---|---|---|---|---|---|---|---|---|---|---|---|
| Tolerance | VIF | Tolerance | VIF | Tolerance | VIF | Tolerance | VIF | Tolerance | VIF | Tolerance | VIF | ||||||
| PAL | / | / | PAL | 0.838 | 1.193 | PAL | 0.813 | 1.230 | PAL | / | / | PAL | 0.838 | 1.193 | PAL | 0.813 | 1.230 |
| Age | 0.547 | 1.828 | Age | 0.535 | 1.868 | Age | 0.547 | 1.828 | Age | 0.535 | 1.868 | ||||||
| Education level | 0.564 | 1.773 | Education level | 0.554 | 1.807 | Education level | 0.564 | 1.773 | Education level | 0.554 | 1.807 | ||||||
| Number of days living alone | 0.932 | 1.073 | Number of days living alone | 0.918 | 1.089 | Number of days living alone | 0.932 | 1.073 | Number of days living alone | 0.918 | 1.089 | ||||||
| Central obesity | 0.988 | 1.012 | Central obesity | 0.963 | 1.039 | Central obesity | 0.988 | 1.012 | Central obesity | 0.963 | 1.039 | ||||||
| Dietary habits | 0.922 | 1.085 | Dietary habits | 0.88 | 1.136 | Dietary habits | 0.922 | 1.085 | Dietary habits | 0.88 | 1.136 | ||||||
| Sleep quality | 0.933 | 1.072 | Sleep quality | 0.911 | 1.098 | Sleep quality | 0.933 | 1.072 | Sleep quality | 0.911 | 1.098 | ||||||
| ADL | 0.792 | 1.262 | ADL | 0.747 | 1.339 | ADL | 0.792 | 1.262 | ADL | 0.747 | 1.339 | ||||||
| Depression | 0.813 | 1.230 | Depression | 0.813 | 1.230 | ||||||||||||
| Dyslipidemia | 0.951 | 1.052 | Dyslipidemia | 0.951 | 1.052 | ||||||||||||
| Stroke | 0.926 | 1.080 | Stroke | 0.926 | 1.080 | ||||||||||||
| Gastric diseases | 0.963 | 1.038 | Gastric diseases | 0.963 | 1.038 | ||||||||||||
| Arthritis or rheumatism | 0.984 | 1.016 | Arthritis or rheumatism | 0.984 | 1.016 | ||||||||||||
| Sedentary | / | / | Sedentary | 0.884 | 1.132 | Sedentary | 0.842 | 1.188 | Sedentary | / | / | Sedentary | 0.884 | 1.132 | Sedentary | 0.842 | 1.188 |
| Age | 0.547 | 1.829 | Age | 0.536 | 1.864 | Age | 0.547 | 1.829 | Age | 0.536 | 1.864 | ||||||
| Education level | 0.553 | 1.808 | Education level | 0.545 | 1.833 | Education level | 0.553 | 1.808 | Education level | 0.545 | 1.833 | ||||||
| Number of days living alone | 0.922 | 1.084 | Number of days living alone | 0.911 | 1.098 | Number of days living alone | 0.922 | 1.084 | Number of days living alone | 0.911 | 1.098 | ||||||
| Central obesity | 0.969 | 1.032 | Central obesity | 0.949 | 1.053 | Central obesity | 0.969 | 1.032 | Central obesity | 0.949 | 1.053 | ||||||
| Dietary habits | 0.934 | 1.071 | Dietary habits | 0.888 | 1.126 | Dietary habits | 0.934 | 1.071 | Dietary habits | 0.888 | 1.126 | ||||||
| Sleep quality | 0.934 | 1.071 | Sleep quality | 0.908 | 1.101 | Sleep quality | 0.934 | 1.071 | Sleep quality | 0.908 | 1.101 | ||||||
| ADL | 0.805 | 1.242 | ADL | 0.756 | 1.323 | ADL | 0.805 | 1.242 | ADL | 0.756 | 1.323 | ||||||
| Depression | 0.797 | 1.254 | Depression | 0.797 | 1.254 | ||||||||||||
| Dyslipidemia | 0.95 | 1.053 | Dyslipidemia | 0.95 | 1.053 | ||||||||||||
| Stroke | 0.928 | 1.078 | Stroke | 0.928 | 1.078 | ||||||||||||
| Gastric diseases | 0.965 | 1.036 | Gastric diseases | 0.965 | 1.036 | ||||||||||||
| Arthritis or rheumatism | 0.982 | 1.018 | Arthritis or rheumatism | 0.982 | 1.018 | ||||||||||||
| Variable | Subgroup | Model 1 | Model 2 | Model 3 | Model 4 | Model 5 | Model 6 |
|---|---|---|---|---|---|---|---|
| PAL | Q1 | 1.000 (Reference) | 1.000 (Reference) | 1.000 (Reference) | 1.000 (Reference) | 1.000 (Reference) | 1.000 (Reference) |
| Q2 | 0.409 (0.268–0.624)* | 0.497 (0.296–0.834)* | 0.544 (0.318–0.930)* | 0.304 (0.183–0.505)* | 0.355 (0.194–0.650)* | 0.365 (0.196–0.681)* | |
| Q3 | 0.361 (0.206–0.632)* | 0.647 (0.350–1.196) | 0.684 (0.361–1.298) | 0.340 (0.179–0.644)* | 0.483 (0.239–0.976)* | 0.480 (0.231–0.996)* | |
| Q4 | 0.248 (0.159–0.387)* | 0.318 (0.184–0.549)* | 0.345 (0.194–0.614)* | 0.249 (0.151–0.411)* | 0.269 (0.147–0.493)* | 0.275 (0.146–0.517)* | |
| Sedentary | Q1 | 1.000 (Reference) | 1.000 (Reference) | 1.000 (Reference) | 1.000 (Reference) | 1.000 (Reference) | 1.000 (Reference) |
| Q2 | 0.481 (0.290–0.798)* | 0.477 (0.278–0.817)* | 0.561 (0.320–0.982)* | 0.280 (0.147–0.535)* | 0.324 (0.164–0.639)* | 0.384 (0.190–0.776)* | |
| Q3 | 0.493 (0.287–0.848)* | 0.578 (0.328–1.017) | 0.672 (0.370–1.218) | 0.448 (0.243–0.825)* | 0.548 (0.291–1.034) | 0.649 (0.333–1.266) | |
| Q4 | 1.151 (0.751–1.764) | 1.060 (0.648–1.735) | 1.104 (0.658–1.854) | 1.047 (0.654–1.677) | 1.186 (0.692–2.035) | 1.301 (0.736–2.300) |
Peer Reviews
No public reviews on file for this paper yet. If you reviewed it on a platform where reviews are public (OpenReview, ICLR, NeurIPS, ICML), you can paste yours below so the community can read it here.
Videos
No videos yet. Explain this paper in a talk, walkthrough, or lecture? Add one.
Taxonomy
TopicsPhysical Activity and Health · Dementia and Cognitive Impairment Research · Frailty in Older Adults
Introduction
1
Population aging represents a significant demographic trend in the 21st century, impacting various domains including economics, society, culture, and healthcare. According to the United Nations’ World Population Prospects 2024 (1), the average age of the world’s population is also increasing. By the end of the 2070s, the number of people aged 65 and above is expected to exceed the number of people under the age of 18. World Health Organization (WHO) data indicate that the global population aged 60 and above is expected to grow from 1 billion in 2019 to 2.1 billion by 2050, accounting for 22% of the world’s total population. The WHO’s Global Report on Ageing and Health (2) highlights population aging as a major global challenge. Aging not only alters the disease spectrum, making chronic non-communicable diseases a primary disease burden, but also intensifies issues such as geriatric syndromes, disability, and cognitive impairment, posing comprehensive and multi-level challenges to healthcare systems.
Alzheimer’s disease (AD) and related dementias impose a heavy burden on society, families, and healthcare systems (3, 4). The Global Impact of Dementia 2013–2050 report notes (5) approximately 7.7 million new dementia cases annually, yet there remains no definitive disease-modifying treatment. The Lancet Commission’s 2024 report on dementia prevention, intervention, and care (6) states that controlling 14 modifiable risk factors, including physical activity, could prevent or delay up to 40% of dementia cases globally. Research in The Lancet found (7) that 3% of dementia cases could be prevented by increasing free-living physical activity levels. Mild cognitive impairment (MCI) represents a transitional state between normal aging and dementia, serving as a critical ‘intervention window’ for dementia prevention. Individuals with MCI maintain normal basic daily activities but may experience slight impairments in complex instrumental activities, not meeting the diagnostic criteria for dementia. As a significant prodromal stage, individuals with MCI have a higher risk of progressing to dementia, with an annual conversion rate between 10 and 15% (8, 9), yet this period also represents a key “window of opportunity.”
Given the heterogeneity of MCI etiology and the multiplicity of risk factors, non-pharmacological interventions for MCI have become a major focus in international research. The most advanced concept in expert consensus involves implementing multi-domain integrated interventions, combining exercise training, cognitive training, dietary intervention, lifestyle and risk factor management, psychosocial intervention, and social participation, which can effectively delay progression from MCI to dementia. Among these, exercise intervention is considered the most economical and convenient approach. The WHO’s 2020 Guidelines on Physical Activity and Sedentary Behavior (10) recommend that older adults (≥65 years) engage in multi-component physical activity, focusing on functional balance and strength training, at least three times per week as part of weekly moderate-intensity aerobic activity, to help prevent cognitive decline. The guidelines also emphasize the importance of limiting sedentary time and replacing it with physical activity of any intensity. As age increases, physical activity levels (PAL) in older adults tend to decline (11). Older adults often prefer staying at home or walking only near their residences, which may lead to insufficient physical activity. A study by Chan et al. (12) found an overall prevalence of physical inactivity of 48.8% among older adults aged 60 and above. The WHO’s Guidelines on Risk Reduction of Cognitive Decline and Dementia (13) and the Lancet Commission’s Dementia prevention, intervention, and care: 2020 report (14) identify regular physical activity as an effective strategy for reducing the risk of cognitive decline and AD. They recommend interrupting prolonged sitting as an essential component of primary prevention and MCI management, suggesting 2–3 min of activity after every 30 min of sitting. WHO recommends physical exercise for older adults with normal cognition and those with MCI to reduce the risk of cognitive decline. It advises that adults aged 65 and above should engage in at least 150 min of moderate-intensity aerobic physical activity, or at least 75 min of vigorous-intensity aerobic activity, or an equivalent combination per week, to achieve the recommended level (600 metabolic equivalent minutes per week) (15–17).
Older adults are the age group with the lowest levels of physical activity and spend a significant portion of their day being sedentary (18). Sedentary behavior is defined as any waking behavior characterized by an energy expenditure ≤1.5 METs (Metabolic equivalent, MET) while in a sitting, reclining, or lying posture (19, 20). Research has found that longer sedentary time among older adults is associated with a higher incidence of all-cause dementia (21). Our previous study based on the China Health and Retirement Longitudinal Study found (22) that light to moderate physical activity reduces the risk of MCI in older adults. Xinjiang region, located in the heart of the Eurasian continent (≥2,500 km from the nearest ocean) and covering one-sixth of China’s land area, is the region farthest from the ocean in the world. This study aims to investigate the relationships between PAL, sedentary time, and MCI among community-dwelling older adults in Xinjiang, Northwest China, and to define recommended ranges for PAL and sedentary time to inform MCI prevention and management strategies.
Materials and methods
2
Data source
2.1
This cross-sectional study was conducted from August to October 2025 using a cluster sampling method. A total of 1,465 adults aged 60 and above were recruited from three communities in Jimsar County, Xinjiang. Inclusion criteria were: (1) age ≥60 years; (2) residence in the survey area for ≥1 year; (3) ability to cooperate in completing questionnaires. The study was approved by the Ethics Committee of the First Affiliated Hospital of Xinjiang Medical University (Approval No.: 240528–01), complied with the principles of the Declaration of Helsinki, and all participants provided informed consent.
Main variables
2.2
Mild cognitive impairment
2.2.1
Cognitive function was assessed using the Montreal Cognitive Assessment (MoCA). The scale covers executive function, verbal fluency, orientation, calculation, abstraction, delayed recall, visuospatial ability, naming, attention, and concentration, with a total score ranging from 0 to 30. Lower scores indicate poorer cognitive function. MCI screening cutoffs were adjusted for education level: ≤13 for illiteracy, ≤19 for primary school, and ≤24 for junior high school and above (23, 24). Based on these criteria, 1,308 participants were classified as cognitively normal and 157 as having MCI. For sensitivity analysis, an adjusted MoCA threshold (adding 1 point for ≤12 years of education) was also applied, resulting in 1352 participants classified as normal and 113 as having MCI.
Physical activity level assessment
2.2.2
PAL were assessed using the International Physical Activity Questionnaire-Short Form (IPAQ-SF) (25), a widely used tool with demonstrated reliability and validity. MET values were assigned to each activity: 3.3 for walking, 4.0 for moderate-intensity activities, and 8.0 for vigorous-intensity activities. Weekly total energy expenditure was calculated as PAL (MET-min/wk) using the formula: MET value × daily activity duration (minutes) × weekly activity days (17, 26). PAL was categorized into quartiles for analysis: Q1 (<1039.5 MET-min/wk), Q2 (1039.5 ≤ PAL < 1,485 MET-min/wk), Q3 (1,485 ≤ PAL < 2079 MET-min/wk), and Q4 (≥2079 MET-min/wk).
Sedentary time
2.2.3
Sedentary time was self-reported, referring to time spent sitting during waking hours at home, while traveling, or with friends, including activities such as sitting at a desk, traveling in vehicles, reading, playing cards, watching TV, or using a computer, excluding sleep time. Sedentary time was categorized into quartiles: Q1 (<120 min/day), Q2 (120 ≤ time < 150 min/day), Q3 (150 ≤ time < 200 min/day), and Q4 (≥200 min/day).
Activities of daily living
2.2.4
The Activities of Daily Living (ADL) scale was used to assess functional disability. ADL was divided into Basic ADL (BADL: toileting, eating, dressing, controlling excretion, getting in/out of bed, bathing) and Instrumental ADL (IADL: shopping, using the telephone, cooking, housekeeping, managing medications, handling finances). Participants were asked about difficulties performing these tasks. An ADL disability score (range 0–11) was calculated by summing responses across the 12 items. Participants reporting difficulty in any item were classified as having ADL impairment.
Depression
2.2.5
Depression was assessed using the 9-item Patient Health Questionnaire (PHQ-9), a valid and reliable self-report scale based on DSM-IV criteria. Participants rated the frequency of symptoms over the past 2 weeks (0=“not at all” to 3=“nearly every day”). A total score ≥10 indicated probable depression.
Covariates
2.2.6
Based on the study design, variables of different dimensions were assessed. For binary categorical variables, values of 0 and 1 were assigned. For categorical variables with three or more levels, incremental values (e.g., 0, 1, 2) were assigned. The specific variables included were:
Demographics: Age, sex, education level, marital status, pre-retirement occupation, living arrangement, and days living alone.Lifestyle habits: Smoking, alcohol consumption, dietary habits, sleep quality, and central obesity.Medical history: Family history of dementia, history of head injury.Chronic diseases: Hypertension, dyslipidemia, diabetes or elevated blood glucose, chronic lung disease, heart disease (e.g., myocardial infarction, coronary heart disease, angina, congestive heart failure), stroke, gastric disease, arthritis or rheumatism.
Statistical analysis
2.3
Statistical analyses were performed using R software version 4.3.0. Continuous data with non-normal distributions are presented as median (interquartile range) [M (Q₁, Q₃)], and group comparisons were made using non-parametric tests. Categorical data are presented as n (%), and group comparisons were made using the chi-square test or Fisher’s exact test. Binary logistic regression was used to analyze the relationships between PAL, sedentary time, and MCI. Six models were constructed:
Model 1: Unadjusted.Model 2: Adjusted for demographics and lifestyle factors significantly different in univariate analysis.Model 3: Adjusted for demographics, lifestyle factors, and chronic diseases significantly different in univariate analysis.Model 4: Based on the adjusted MoCA threshold MCI grouping, unadjusted.Model 5: Based on the adjusted MoCA threshold MCI grouping, adjusted as per Model 2.Model 6: Based on the adjusted MoCA threshold MCI grouping, adjusted as per Model 3.
Restricted cubic spline (RCS) analysis using the “ggrcs” package was performed to evaluate the dose–response relationships between PAL, sedentary time, and MCI, with 4 nodes and the median of the exposure variable set as the reference point. Results are presented as odds ratios (OR) with 95% confidence intervals (CI). A two-sided p value < 0.05 was considered statistically significant.
Results
3
Participant characteristics
3.1
The study included 1,465 participants. According to the standard MoCA criteria, 1,308 (89.28%) were cognitively normal, and 157 (10.72%) had MCI. Significant differences (p < 0.05) were observed between the normal and MCI groups in PAL, sedentary time, age, education level, days living alone, central obesity, dietary habits, sleep quality, ADL, depression, dyslipidemia, stroke, gastric disease, and arthritis/rheumatism. No significant differences (p > 0.05) were found for sex, marital status, pre-retirement occupation, family history of dementia, history of head injury, living arrangement, smoking, alcohol consumption, hypertension, diabetes, chronic lung disease, or heart disease (Table 1).
Logistic regression analysis of the association between PAL, sedentary time, and MCI in older adults
3.2
MCI was the dependent variable, and PAL and sedentary time were the independent variables. Variables with significant univariate differences (p < 0.05) were included in the regression models to assess their relationships (variable assignments shown in Table 2).
The variance inflation factor (VIF) for all covariates was <5, and tolerance was far >0.1, indicating no significant multicollinearity (Table 3).
In the unadjusted logistic regression model (Model 1), the second [OR = 0.409 (95%CI: 0.268–0.624)], third [OR = 0.361 (95%CI: 0.206–0.632)], and fourth [OR = 0.248 (95%CI: 0.159–0.387)] PAL quartiles were associated with significantly reduced MCI risk compared to the first quartile. Similarly, the second [OR = 0.481 (95%CI: 0.290–0.798)] and third [OR = 0.493 (95%CI: 0.287–0.848)] sedentary time quartiles were associated with lower risk compared to the first quartile.
After adjusting for demographic and lifestyle factors (Model 2), the second [OR = 0.497 (95%CI: 0.296–0.834)] and fourth [OR = 0.318 (95%CI: 0.184–0.549)] PAL quartiles, and the second sedentary time quartile [OR = 0.477 (95%CI: 0.278–0.817)], remained significantly associated with reduced MCI risk.
After further adjustment for chronic diseases (Model 3), the associations for the second [OR = 0.544 (95%CI: 0.318–0.930)] and fourth [OR = 0.345 (95%CI: 0.194–0.614)] PAL quartiles, and the second sedentary time quartile [OR = 0.561 (95%CI: 0.320–0.982)], persisted.
Sensitivity analyses using the adjusted MoCA threshold for MCI classification (Models 4, 5, 6) yielded consistent results, confirming the robustness of the associations between PAL, sedentary time, and MCI (Table 4).
Dose–response relationship between PAL and MCI
3.3
RCS curves showed a nonlinear relationship between PAL and MCI (P_overall_ < 0.05, P_nonlinear_ < 0.05) (Figure 1A). The risk of MCI decreased gradually with increasing PAL, with the most benefit observed around 1,485 MET-min/wk. Beyond approximately 4,000 MET-min/wk., the risk tended to increase. After adjusting for demographic and lifestyle factors (Figure 1B), the nonlinear relationship remained (P_overall_ < 0.05, P_nonlinear_ < 0.05). After further adjustment for chronic diseases (Figure 1C), the relationship appeared linear (P_overall_ < 0.05, P_nonlinear_ > 0.05). Sensitivity analyses using the adjusted MoCA threshold (Figures 1D–F) confirmed the close association between PAL and MCI.
Dose–response relationship between PAL and MCI in older adults. RCS (A) Unadjusted. RCS (B) RCS A + Age, education level, days living alone, central obesity, dietary habits, sleep quality, ADL. RCS (C) RCS A + Age, education level, days living alone, central obesity, dietary habits, sleep quality, ADL, depression, dyslipidemia, stroke, gastric disease, arthritis/rheumatism. RCS (D) Adjusted Moca threshold-based MCI group, unadjusted. RCS (E) RCS D + Age, education level, days living alone, central obesity, dietary habits, sleep quality, ADL. RCS (F) RCS D + Age, education level, days living alone, central obesity, dietary habits, sleep quality, ADL, depression, dyslipidemia, stroke, gastric disease, arthritis/rheumatism. MET, Metabolic equivalent; OR, Odds ratio; CI, confidence interval.
Dose–response relationship between sedentary time and MCI
3.4
RCS curves indicated a nonlinear relationship between sedentary time and MCI (P_overall_ < 0.05, P_nonlinear_ < 0.05) (Figure 2A). MCI risk initially decreased with increasing sedentary time, reaching its lowest point around 150 min/day, and then increased after exceeding approximately 200 min/day. This nonlinear pattern persisted after adjusting for demographics and lifestyle factors (Figure 2B) (P_overall_ < 0.05, P_nonlinear_ < 0.05) and after further adjusting for chronic diseases (Figure 2C) (P_overall_ < 0.05, P_nonlinear_ < 0.05). Sensitivity analyses using the adjusted MoCA threshold (Figures 2D–F) corroborated the strong association.
Dose–response relationship between sedentary time and MCI in older adults. RCS (A) unadjusted. RCS (B) RCS A + age, education level, days living alone, central obesity, dietary habits, sleep quality, ADL. RCS (C) RCS A + age, education level, days living alone, central obesity, dietary habits, sleep quality, ADL, depression, dyslipidemia, stroke, gastric disease, arthritis/rheumatism. RCS (D) adjusted MOCA threshold-based MCI group, unadjusted. RCS (E) RCS D + age, education level, days living alone, central obesity, dietary habits, sleep quality, ADL. RCS (F) RCS D + age, education level, days living alone, central obesity, dietary habits, sleep quality, ADL, depression, dyslipidemia, stroke, gastric disease, arthritis/rheumatism. OR, odds ratio; CI, confidence interval.
Discussion
4
With the increasing global aging population and extended life expectancy, cognitive impairment imposes a significant disease and economic burden on older adults. Dementia care is costly (27, 28); US statistics show dementia patients incur over $387,000 per person in the last five years of life (29). The number of dementia cases is projected to double in coming decades, escalating associated costs. Guidelines such as those on physical activity and exercise for preventing and managing MCI and dementia (30–34) identify exercise as an effective intervention. Regular PAL is associated with a reduced conversion rate from MCI to dementia; one study reported a 15% reduction with regular physical activity (35, 36). Research reviews (37) affirm the cognitive benefits of physical activity across the lifespan and for populations with cognitive deficits. The Finnish Geriatric Intervention Study to Prevent Cognitive Impairment and Disability (FINGER) (38) demonstrated the effectiveness of multi-domain lifestyle interventions (combining diet, exercise, cognitive training, and vascular risk monitoring) on cognitive function in older adults.
In our study population, most participants had an education level of junior high school or below. However, the group exhibited habits of morning and evening walks, exercise, and square dancing. Occupations primarily involved farming and herding labor, which likely influenced MCI prevalence. Our analysis found that compared to those in the lowest PAL quartile, older adults with higher PAL had a reduced risk of MCI (OR < 1, p < 0.05), consistent with findings from Song et al. and others (39–50). A 5.6-year follow-up study by Verghese et al. confirmed (51) that leisure activities reduce the risk of amnestic MCI. The Australian Physical Activity and Sedentary Behavior Guidelines recommend (52) that adults aged ≥65 years engage in at least 30 min of moderate-intensity physical activity on most days, in addition to daily activities. Numerous prospective cohort studies consistently show that higher overall physical activity levels are significantly associated with a lower risk of MCI and dementia. A meta-analysis indicated that the most active older adults have approximately 30–40% lower risk of cognitive impairment compared to the least active. This suggests that older adults should enhance their PAL and improve sleep quality to bolster cognitive function.
Not only aerobic exercise (e.g., brisk walking, swimming) but also resistance training has proven benefits for specific cognitive domains like executive function (53, 54). RCS analysis revealed a nonlinear dose–response relationship between PAL and MCI. MCI risk decreased with increasing PAL, with optimal benefit around 1,485 MET-min/wk., aligning with findings by Daniel et al. (55, 56) that exercise improves cognitive function in older adults. Physiologically, appropriate physical activity duration promotes cerebral blood circulation and redistribution, enhances antioxidant effects by increasing enzyme and anti-inflammatory cytokine activity (57, 58), and elevates brain-derived neurotrophic factor (BDNF) levels (59). BDNF stimulates neuronal growth and maintenance, promotes hippocampal neurogenesis and synaptic plasticity—the cellular basis of learning and memory (60, 61). Physical activity also protects brain function by enhancing the body’s antioxidant defense system, preserving neuronal structural integrity and brain volume (brain reserve), thereby improving cognitive abilities in older adults (62–65). Regular exercise modulates systemic and central nervous system inflammation, reduces pro-inflammatory cytokines, and boosts antioxidant defenses. Animal studies suggest exercise may enhance glymphatic system function, accelerating the clearance of toxic substances like β-amyloid.
This study also found that the second quartile of sedentary time was associated with a lower MCI risk compared to the first quartile (OR < 1, p < 0.05). Cross-sectional and prospective studies indicate better neurocognitive function in more physically active individuals compared to sedentary ones (51, 66–68). RCS analysis showed a nonlinear relationship between sedentary time and MCI. Risk decreased initially with increased sedentary time but started to rise after exceeding 200 min/day, consistent with studies by Shuai Z et al. (69, 70) which found lower MCI likelihood with 1–2 h of sitting. A multinational study on MCI and sedentary behavior found each additional hour of sedentary time increased the odds of MCI by 8% (71). An evidence-based review (72) noted that long-term sedentary older adults are more prone to MCI than those engaged in physical activity or with short sedentary bouts, a trend more pronounced in Asian populations. Xie et al. (73) found a significant association between excessive sedentary time and MCI, highlighting the importance of limiting sedentary behavior as older adults with MCI tend to have longer sedentary time, leading to worse health outcomes. Gafni et al. (74) found that insufficient PAL and sitting for at least three-quarters of the day increased MCI risk in older adults. A systematic review and meta-analysis suggested (75) that older adults meeting the 24-h movement guidelines (i.e., ≥60 min of moderate-to-vigorous physical activity, ≤2 h of screen time, and age-appropriate sleep) experience better cognitive health outcomes.
Sedentary behavior may impact brain health and increase MCI risk through multiple direct and indirect biological pathways (76–78). Prolonged sitting impairs vascular endothelial function, reduces cerebral blood flow, and diminishes cerebrovascular reserve. Studies show prolonged sitting significantly reduces middle cerebral artery blood flow velocity (79, 80). Chronic cerebral hypoperfusion, a common pathological basis for vascular cognitive impairment and AD, affects neuronal energy supply, accelerates Aβ deposition and tau hyperphosphorylation, thereby impairing cognition. Sedentary behavior is a key contributor to insulin resistance, type 2 diabetes, and dyslipidemia. These metabolic disturbances trigger systemic inflammation and oxidative stress, disrupt blood–brain barrier integrity, and directly damage neuronal and synaptic function. Brain insulin resistance is a core pathological mechanism in AD (termed “type 3 diabetes”), closely linked to impaired Aβ clearance and tau pathology (81). Sedentary behavior is associated with elevated circulating pro-inflammatory cytokines (e.g., IL-6, TNF-α, CRP) (82, 83). Chronic low-grade inflammation is a key driver of neurodegeneration. These inflammatory factors can cross the impaired blood–brain barrier, activate microglia, induce neuroinflammation, and ultimately lead to impaired synaptic plasticity and neuronal death (84).
Physical activity, particularly moderate-to-vigorous activity, effectively elevates BDNF levels, crucial for neuronal survival, differentiation, learning, and memory. Conversely, sedentary behavior may downregulate BDNF. An intervention study showed that even short-term (e.g., one week) strict bed rest led to a significant drop in serum BDNF and slightly worsened cognitive test performance in healthy adults (37). Furthermore, sedentary behavior may indirectly affect brain health through impacts on lipid metabolism (leading to obesity), disruption of circadian rhythms, and reduced social and cognitive stimulation. These intertwined mechanisms form a complex network through which sedentary behavior impairs cognitive function (85).
This study has several limitations: (1) The cross-sectional design cannot establish causality between PAL, sedentary time, and cognitive changes. (2) The sample was from Xinjiang, limiting generalizability. (3) PAL and sedentary time were self-reported, susceptible to recall bias. Future research should employ longitudinal designs and objective measures like accelerometers to further investigate specific parameters of physical activity (intensity, frequency, pattern) and optimal strategies for interrupting sedentary behavior to provide more precise public health guidance.
In summary, both physical activity and sedentary time are closely associated with MCI incidence in older adults. Maintaining a weekly PAL between 1,485 and 4,000 MET-min/wk. and limiting daily sedentary time to under 200 min may help reduce the risk of MCI.
The reference list from the paper itself. Each links out to its DOI / PubMed record.
- 1United Nations Department of Economic and Social Affairs. World Population Prospects (2024). Available online at: https://population.un.org/wpp/ (Accessed October 1, 2025).
- 2Rudnicka E Napierała P Podfigurna A Męczekalski B Smolarczyk R Grymowicz M. The World Health Organization (WHO) approach to healthy ageing. Maturitas. (2020) 139:6–11. doi: 10.1016/j.maturitas.2020.05.018, 32747042 PMC 7250103 · doi ↗ · pubmed ↗
- 3Pan CW Wang X Ma Q Sun HP Xu Y Wang P. Cognitive dysfunction and health-related quality of life among older Chinese. Sci Rep. (2015) 5:17301. doi: 10.1038/srep 17301, 26601612 PMC 4658548 · doi ↗ · pubmed ↗
- 4Jia J Wei C Chen S Li F Tang Y Qin W . The cost of Alzheimer's disease in China and re-estimation of costs worldwide. Alzheimers Dement. (2018) 14:483–91. doi: 10.1016/j.jalz.2017.12.006, 29433981 · doi ↗ · pubmed ↗
- 5Prince M Guerchet M Prina M. The global impact of dementia 2013–2050. London: Alzheimer's Disease International. (2013).
- 6Livingston G Huntley J Liu KY Costafreda SG Selbæk G Alladi S . Dementia prevention, intervention, and care: 2024 report of the lancet standing commission. Lancet. (2024) 404:572–628. doi: 10.1016/s 0140-6736(24)01296-0, 39096926 · doi ↗ · pubmed ↗
- 7Livingston G Sommerlad A Orgeta V Costafreda SG Huntley J Ames D . Dementia prevention, intervention, and care. Lancet. (2017) 390:2673–734. doi: 10.1016/s 0140-6736(17)31363-6, 28735855 · doi ↗ · pubmed ↗
- 8Farias ST Mungas D Reed BR Harvey D De Carli C. Progression of mild cognitive impairment to dementia in clinic- vs community-based cohorts. Arch Neurol. (2009) 66:1151–7. doi: 10.1001/archneurol.2009.106, 19752306 PMC 2863139 · doi ↗ · pubmed ↗