Increased risk of incident dementia associated with vitamin D deficiency in glaucoma patients: a TriNetX cohort study
Yu-Chen Cheng, Chien-Lin Lu, Joshua Wang, Ming Ling Tsai, Kuo-Cheng Lu

TL;DR
Vitamin D deficiency in glaucoma patients is linked to a higher risk of developing dementia over five years, according to a large health records study.
Contribution
This study is the first to show a dose-response relationship between vitamin D deficiency and dementia risk specifically in glaucoma patients.
Findings
Vitamin D deficiency was associated with a 24% higher risk of dementia in glaucoma patients.
Severe vitamin D deficiency (<20 ng/mL) increased dementia risk by nearly 50%.
The dementia risk was reduced to non-significant levels when excluding long-term NSAID users.
Abstract
Glaucoma is a progressive optic neuropathy associated with increased neurodegenerative risk. Vitamin D Deficiency (VDD) is a widespread systemic factor linked to neurobiological dysfunction. This study investigated the longitudinal association between VDD and the 5-year incidence of neurodegenerative outcomes in this glaucoma population. This retrospective cohort study used a large electronic health records (EHRs) network. Glaucoma patients were classified as VDD (< 30 ng/mL) or vitamin D adequate (VDA) (≥30 ng/mL). A 1:1 propensity score matching (PSM) procedure matched 10,881 patients per cohort based on 47 covariates. The primary endpoints were the 5-year incidence of unspecified dementia, Alzheimer disease (AD), and Parkinson disease (PD), analyzed using Cox proportional hazards models. After PSM, VDD was associated with a higher 5-year risk of unspecified dementia (HR 1.241, 95%…
Genes, proteins, chemicals, diseases, species, mutations and cell lines named across the full text — each resolved to its canonical identifier and authoritative record.
Click any figure to enlarge with its caption.
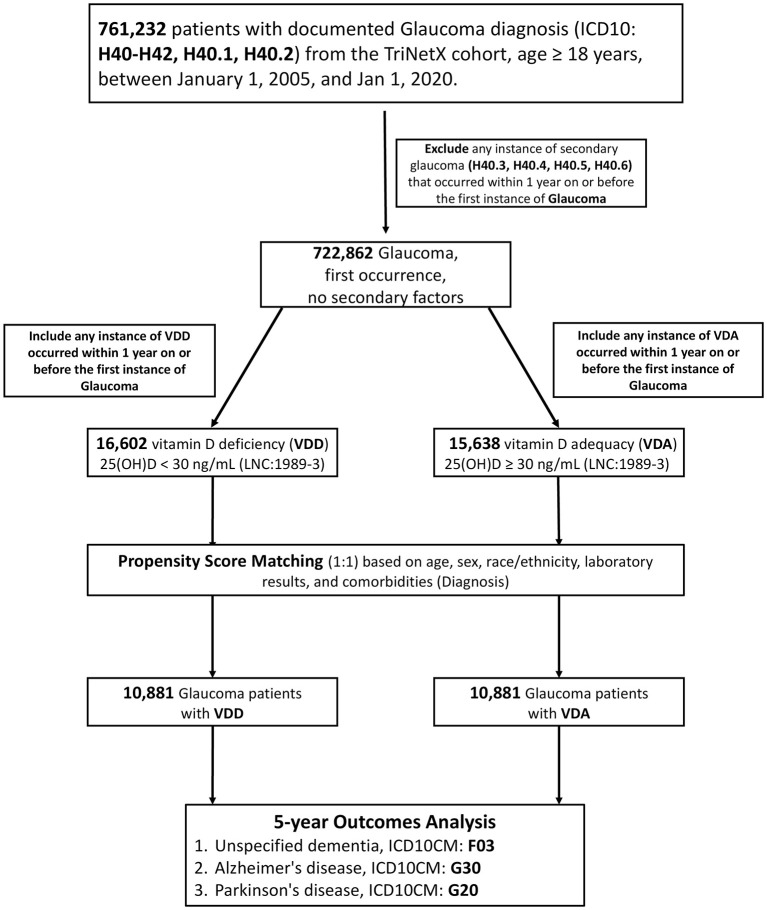 Figure 1
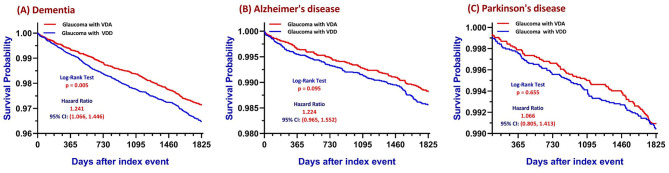 Figure 2
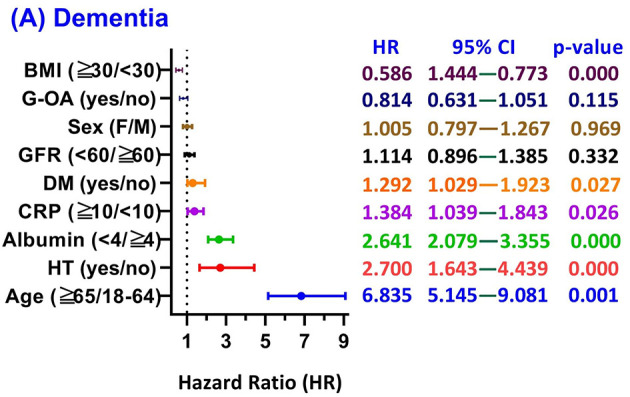 Figure 3
|
|
|
| ||||||
|---|---|---|---|---|---|---|---|---|
|
|
|
|
| |||||
|
| ||||||||
| Age at index | 57.819 ± 12.783 vs. 64.081 ± 11.140 | 16,602 vs. 15,638 | 100.00% vs. 100.00% | 0.522 | 61.542 ± 11.335 vs. 61.565 ± 11.507 | 10,881 vs. 10,881 | 100.00% vs. 100.00% | 0.002 |
| Male | 5,585 vs. 4,424 | 33.64% vs. 28.29% | 0.116 | 3,325 vs. 3,337 | 30.56% vs. 30.67% | 0.002 | ||
| Female | 11,016 vs. 11,212 | 66.35% vs. 71.70% | 0.116 | 7,555 vs. 7,544 | 69.43% vs. 69.33% | 0.002 | ||
| White | 8,227 vs. 10,379 | 49.55% vs. 66.37% | 0.346 | 6,393 vs. 6,444 | 58.75% vs. 59.22% | 0.010 | ||
| Black or African American | 4,932 vs. 2,318 | 29.71% vs. 14.82% | 0.364 | 2,233 vs. 2,205 | 20.52% vs. 20.27% | 0.006 | ||
| Hispanic or Latino | 2,705 vs. 1,160 | 16.29% vs. 7.42% | 0.277 | 1,103 vs. 1,094 | 10.14% vs. 10.05% | 0.003 | ||
| Not Hispanic or Latino | 13,041 vs. 13,721 | 78.55% vs. 87.74% | 0.247 | 9,241 vs. 9,231 | 84.93% vs. 84.84% | 0.003 | ||
| Unknown Race | 1,538 vs. 1,266 | 9.26% vs. 8.10% | 0.042 | 1,018 vs. 1,018 | 9.36% vs. 9.36% | 0.000 | ||
| Asian | 917 vs. 1,060 | 5.52% vs. 6.78% | 0.052 | 718 vs. 709 | 6.60% vs. 6.52% | 0.003 | ||
|
| ||||||||
| Hypertensive diseases | 9,028 vs. 8,103 | 54.38% vs. 51.82% | 0.051 | 5,640 vs. 5,684 | 51.83% vs. 52.24% | 0.008 | ||
| Diabetes mellitus | 6,006 vs. 4,052 | 36.18% vs. 25.91% | 0.223 | 3,207 vs. 3,255 | 29.47% vs. 29.91% | 0.010 | ||
| Ischemic heart diseases | 1,841 vs. 1,579 | 11.09% vs. 10.10% | 0.032 | 1,100 vs. 1,141 | 10.11% vs. 10.49% | 0.012 | ||
| Cerebrovascular diseases | 999 vs. 946 | 6.02% vs. 6.05% | 0.001 | 655 vs. 653 | 6.02% vs. 6.00% | 0.001 | ||
|
| ||||||||
| Antilipemic Agents | 6,009 vs. 5,851 | 36.19% vs. 37.41% | 0.025 | 3,917 vs. 3,907 | 36.00% vs. 35.91% | 0.002 | ||
| Diuretics | 4,933 vs. 3,917 | 29.71% vs. 25.05% | 0.105 | 2,915 vs. 2,971 | 26.79% vs. 27.30% | 0.012 | ||
| Blood Glucose Regulation Agents | 5,486 vs. 3,650 | 33.04% vs. 23.34% | 0.217 | 2,891 vs. 2,934 | 26.57% vs. 26.96% | 0.009 | ||
| Beta Blockers/Related | 4,324 vs. 3,821 | 26.05% vs. 24.43% | 0.037 | 2,680 vs. 2,744 | 24.63% vs. 25.22% | 0.014 | ||
| Ace Inhibitors | 3,862 vs. 2,822 | 23.26% vs. 18.05% | 0.129 | 2,133 vs. 2,196 | 19.60% vs. 20.18% | 0.015 | ||
| Calcium Channel Blockers | 3,414 vs. 2,823 | 20.56% vs. 18.05% | 0.064 | 2,024 vs. 2,038 | 18.60% vs. 18.73% | 0.003 | ||
| Angiotensin II Inhibitor | 2,093 vs. 2,122 | 12.61% vs. 13.57% | 0.029 | 1,404 vs. 1,399 | 12.90% vs. 12.86% | 0.001 | ||
|
| ||||||||
| Calcidiol ng/mL | 19.490 ± 6.597 vs. 42.917 ± 12.584 | 15,558 vs. 14,734 | 93.71% vs. 94.22% | 2.332 | 20.450 ± 6.400 vs. 42.408 ± 12.556 | 10,076 vs. 10,253 | 92.60% vs. 94.23% | 2.203 |
| Potassium | 4.202 ± 0.440 vs. 4.244 ± 0.427 | 14,857 vs. 13,909 | 89.49% vs. 88.94% | 0.097 | 4.216 ± 0.429 vs. 4.228 ± 0.433 | 9,585 vs. 9,615 | 88.09% vs. 88.36% | 0.029 |
| Urea nitrogen | 17.378 ± 11.533 vs. 17.837 ± 9.393 | 14,848 vs. 13,894 | 89.44% vs. 88.85% | 0.044 | 17.193 ± 9.995 vs. 17.705 ± 9.716 | 9,573 vs. 9,610 | 87.98% vs. 88.32% | 0.052 |
| Calcium | 9.350 ± 0.556 vs. 9.478 ± 0.502 | 14,822 vs. 13,964 | 89.28% vs. 89.30% | 0.243 | 9.407 ± 0.531 vs. 9.447 ± 0.513 | 9,572 vs. 9,644 | 87.97% vs. 88.63% | 0.078 |
| 0–8.5 mg/dL | 2,228 vs. 1,207 | 13.42% vs. 7.72% | 0.186 | 990 vs. 1,041 | 9.10% vs. 9.57% | 0.016 | ||
| 8.5–10 mg/dL | 13,701 vs. 12,688 | 82.53% vs. 81.14% | 0.036 | 8,802 vs. 8,844 | 80.89% vs. 81.28% | 0.010 | ||
| 10–11 mg/dL | 2,720 vs. 3,358 | 16.38% vs. 21.47% | 0.130 | 2,012 vs. 2,068 | 18.49% vs. 19.01% | 0.013 | ||
| 11–13 mg/dL | 232 vs. 205 | 1.40% vs. 1.31% | 0.007 | 144 vs. 153 | 1.32% vs. 1.41% | 0.007 | ||
| Sodium | 139.204 ± 2.825 vs. 139.545 ± 2.880 | 14,830 vs. 13,876 | 89.33% vs. 88.73% | 0.119 | 139.429 ± 2.771 vs. 139.526 ± 2.827 | 9,566 vs. 9,595 | 87.92% vs. 88.18% | 0.035 |
| Bicarbonate | 26.478 ± 3.106 vs. 26.876 ± 2.883 | 14,771 vs. 13,821 | 88.97% vs. 88.38% | 0.133 | 26.633 ± 3.011 vs. 26.781 ± 2.924 | 9,524 vs. 9,561 | 87.53% vs. 87.87% | 0.050 |
| Bicarbonate | 14,771 vs. 13,821 | 88.97% vs. 88.38% | 0.019 | 9,524 vs. 9,561 | 87.53% vs. 87.87% | 0.010 | ||
| Creatinine | 1.116 ± 1.908 vs. 1.065 ± 2.296 | 14,660 vs. 13,872 | 88.30% vs. 88.71% | 0.024 | 1.038 ± 1.693 vs. 1.071 ± 1.791 | 9,514 vs. 9,544 | 87.44% vs. 87.71% | 0.019 |
| Glucose | 121.12 ± 58.84 vs. 108.81 ± 39.60 | 14,771 vs. 13,794 | 88.97% vs. 88.21% | 0.245 | 113.253 ± 47.13 vs. 111.650 ± 43.65 | 9,504 vs. 9,546 | 87.34% vs. 87.73% | 0.035 |
| 0–60 mg/dL | 620 vs. 345 | 3.73% vs. 2.21% | 0.090 | 278 vs. 296 | 2.56% vs. 2.72% | 0.010 | ||
| 60–90 mg/dL | 6,292 vs. 5,793 | 37.90% vs. 37.04% | 0.018 | 4,027 vs. 4,039 | 37.01% vs. 37.12% | 0.002 | ||
| 90–120 mg/dL | 9,646 vs. 9,707 | 58.10% vs. 62.07% | 0.081 | 6,428 vs. 6,479 | 59.08% vs. 59.54% | 0.010 | ||
| 120–150 mg/dL | 4,929 vs. 3,697 | 29.69% vs. 23.64% | 0.137 | 2,796 vs. 2,854 | 25.70% vs. 26.23% | 0.012 | ||
| 150–180 mg/dL | 3,403 vs. 2,194 | 20.50% vs. 14.03% | 0.172 | 1,780 vs. 1,774 | 16.36% vs. 16.30% | 0.001 | ||
| Alanine aminotransferase | 26.616 ± 38.096 vs. 24.809 ± 28.848 | 13,547 vs. 12,804 | 81.60% vs. 81.88% | 0.053 | 24.574 ± 18.063 vs. 25.595 ± 33.536 | 8,761 vs. 8,779 | 80.52% vs. 80.68% | 0.038 |
| Hematocrit | 39.590 ± 5.172 vs. 40.265 ± 4.554 | 13,632 vs. 12,636 | 82.11% vs. 80.80% | 0.139 | 39.915 ± 4.852 vs. 40.113 ± 4.711 | 8,721 vs. 8,747 | 80.15% vs. 80.39% | 0.041 |
| Aspartate aminotransferase | 26.255 ± 119.55 vs. 25.257 ± 30.02 | 13,448 vs. 12,682 | 81.00% vs. 81.10% | 0.011 | 24.270 ± 13.49 vs. 25.553 ± 35.35 | 8,672 vs. 8,712 | 79.70% vs. 80.07% | 0.048 |
| Platelets | 245.247 ± 77.24 vs. 239.359 ± 69.38 | 13,510 vs. 12,501 | 81.38% vs. 79.94% | 0.080 | 242.020 ± 74.17 vs. 240.46 ± 70.64 | 8,636 vs. 8,659 | 79.37% vs. 79.58% | 0.023 |
| Hemoglobin | 13.073 ± 1.845 vs. 13.331 ± 1.624 | 13,495 vs. 12,372 | 81.28% vs. 79.11% | 0.149 | 13.188 ± 1.734 vs. 13.268 ± 1.681 | 8,603 vs. 8,625 | 79.06% vs. 79.27% | 0.047 |
| Alkaline phosphatase | 84.103 ± 43.583 vs. 75.167 ± 33.123 | 13,170 vs. 12,343 | 79.33% vs. 78.93% | 0.231 | 79.204 ± 34.991 vs. 77.935 ± 33.539 | 8,478 vs. 8,494 | 77.92% vs. 78.06% | 0.037 |
| 0–50 U/L | 1,560 vs. 2,052 | 9.40% vs. 13.12% | 0.118 | 1,189 vs. 1,199 | 10.93% vs. 11.02% | 0.003 | ||
| 50–70 U/L | 4,930 vs. 5,525 | 29.70% vs. 35.33% | 0.121 | 3,524 vs. 3,520 | 32.39% vs. 32.35% | 0.001 | ||
| 70–90 U/L | 5,326 vs. 4,616 | 32.08% vs. 29.52% | 0.056 | 3,306 vs. 3,349 | 30.38% vs. 30.78% | 0.009 | ||
| 90–120 U/L | 3,947 vs. 2,712 | 23.77% vs. 17.34% | 0.160 | 2,146 vs. 2,144 | 19.72% vs. 19.70% | 0.000 | ||
| Albumin | 3.989 ± 0.489 vs. 4.091 ± 0.422 | 13,161 vs. 12,397 | 79.27% vs. 79.28% | 0.223 | 4.052 ± 0.439 vs. 4.064 ± 0.445 | 8,469 vs. 8,534 | 77.83% vs. 78.43% | 0.026 |
| 0–3 g/dL | 1,217 vs. 605 | 7.33% vs. 3.87% | 0.151 | 497 vs. 523 | 4.57% vs. 4.81% | 0.011 | ||
| 3–4 g/dL | 7,372 vs. 6,103 | 44.40% vs. 39.03% | 0.109 | 4,375 vs. 4,382 | 40.21% vs. 40.27% | 0.001 | ||
| 4–5 g/dL | 8,985 vs. 9,486 | 54.12% vs. 60.66% | 0.133 | 6,257 vs. 6,285 | 57.50% vs. 57.76% | 0.005 | ||
| Bilirubin. total | 0.614 ± 0.542 vs. 0.624 ± 0.386 | 13,108 vs. 12,289 | 78.95% vs. 78.58% | 0.020 | 0.624 ± 0.510 vs. 0.613 ± 0.374 | 8,429 vs. 8,459 | 77.47% vs. 77.74% | 0.025 |
| Protein | 7.120 ± 0.679 vs. 7.026 ± 0.585 | 12,927 vs. 12,083 | 77.86% vs. 77.27% | 0.148 | 7.077 ± 0.627 vs. 7.056 ± 0.592 | 8,287 vs. 8,325 | 76.16% vs. 76.51% | 0.035 |
| Protein | 12,927 vs. 12,083 | 77.86% vs. 77.27% | 0.014 | 8,287 vs. 8,325 | 76.16% vs. 76.51% | 0.008 | ||
| Cholesterol, total | 183.42 ± 50.17 vs. 180.10 ± 47.12 | 11,969 vs. 11,427 | 72.09% vs. 73.07% | 0.068 | 182.66 ± 49.55 vs. 180.52 ± 48.63 | 7,822 vs. 7,755 | 71.89% vs. 71.27% | 0.044 |
| 0–150 mg/dL | 2,958 vs. 2,913 | 17.82% vs. 18.63% | 0.021 | 1,963 vs. 1,984 | 18.04% vs. 18.23% | 0.005 | ||
| 150–200 mg/dL | 5,858 vs. 5,804 | 35.28% vs. 37.12% | 0.038 | 3,824 vs. 3,818 | 35.14% vs. 35.09% | 0.001 | ||
| 200–300 mg/dL | 4,672 vs. 4,163 | 28.14% vs. 26.62% | 0.034 | 2,962 vs. 2,943 | 27.22% vs. 27.05% | 0.004 | ||
| Cholesterol in HDL | 50.799 ± 18.094 vs. 56.082 ± 20.236 | 11,952 vs. 11,417 | 71.99% vs. 73.01% | 0.275 | 53.121 ± 18.773 vs. 53.574 ± 19.471 | 7,821 vs. 7,747 | 71.88% vs. 71.20% | 0.024 |
| 0–40 mg/dL | 3,366 vs. 2,243 | 20.27% vs. 14.34% | 0.157 | 1,781 vs. 1,812 | 16.37% vs. 16.65% | 0.008 | ||
| 40–60 mg/dL | 6,364 vs. 5,601 | 38.33% vs. 35.82% | 0.052 | 4,075 vs. 4,059 | 37.45% vs. 37.30% | 0.003 | ||
| 60–80 mg/dL | 2,731 vs. 3,458 | 16.45% vs. 22.11% | 0.144 | 2,059 vs. 2,063 | 18.92% vs. 18.96% | 0.001 | ||
| Cholesterol in LDL | 105.65 ± 39.98 vs. 100.39 ± 36.64 | 11,883 vs. 11,392 | 71.58% vs. 72.85% | 0.137 | 104.19 ± 39.19 vs. 102.13 ± 38.17 | 7,816 vs. 7,718 | 71.83% vs. 70.93% | 0.053 |
| 0–50 mg/dL | 867 vs. 783 | 5.22% vs. 5.01% | 0.010 | 560 vs. 571 | 5.15% vs. 5.25% | 0.005 | ||
| 50–100 mg/dL | 5,206 vs. 5,710 | 31.36% vs. 36.51% | 0.109 | 3,591 vs. 3,584 | 33.00% vs. 32.94% | 0.001 | ||
| 100–150 mg/dL | 5,672 vs. 5,257 | 34.16% vs. 33.62% | 0.012 | 3,651 vs. 3,627 | 33.55% vs. 33.33% | 0.005 | ||
| Triglyceride | 141.39 ± 115.20 vs. 119.09 ± 85.01 | 11,810 vs. 11,368 | 71.14% vs. 72.69% | 0.220 | 130.17 ± 92.86 vs. 126.22 ± 94.84 | 7,767 vs. 7,694 | 71.38% vs. 70.71% | 0.042 |
| 0–100 mg/dL | 5,032 vs. 5,947 | 30.31% vs. 38.03% | 0.163 | 3,652 vs. 3,649 | 33.56% vs. 33.54% | 0.001 | ||
| 100–150 mg/dL | 4,045 vs. 3,883 | 24.36% vs. 24.83% | 0.011 | 2,646 vs. 2,658 | 24.32% vs. 24.43% | 0.003 | ||
| 150–200 mg/dL | 2,334 vs. 1,948 | 14.06% vs. 12.46% | 0.047 | 1,465 vs. 1,417 | 13.46% vs. 13.02% | 0.013 | ||
| 200–300 mg/dL | 1,800 vs. 1,280 | 10.84% vs. 8.19% | 0.091 | 1,008 vs. 1,008 | 9.26% vs. 9.26% | 0.000 | ||
| Leukocytes | 9.037 ± 93.797 vs. 11.567 ± 147.460 | 11,360 vs. 10,072 | 68.42% vs. 64.41% | 0.020 | 9.457 ± 103.863 vs. 10.766 ± 136.414 | 7,043 vs. 7,112 | 64.73% vs. 65.36% | 0.011 |
| Hemoglobin A1c | 6.882 ± 2.024 vs. 6.281 ± 1.452 | 9,313 vs. 7,508 | 56.10% vs. 48.01% | 0.341 | 6.513 ± 1.644 vs. 6.413 ± 1.583 | 5,548 vs. 5,436 | 50.99% vs. 49.96% | 0.062 |
| 0–5 % | 525 vs. 458 | 3.16% vs. 2.93% | 0.014 | 320 vs. 338 | 2.94% vs. 3.11% | 0.010 | ||
| 5–6 % | 3,924 vs. 3,990 | 23.64% vs. 25.52% | 0.044 | 2,657 vs. 2,640 | 24.42% vs. 24.26% | 0.004 | ||
| 6–7 % | 3,371 vs. 2,927 | 20.30% vs. 18.72% | 0.040 | 2,155 vs. 2,167 | 19.80% vs. 19.91% | 0.003 | ||
| 7–8 % | 1,947 vs. 1,410 | 11.73% vs. 9.02% | 0.089 | 1,150 vs. 1,140 | 10.57% vs. 10.48% | 0.003 | ||
| 8–9 % | 1,249 vs. 733 | 7.52% vs. 4.69% | 0.119 | 663 vs. 632 | 6.09% vs. 5.81% | 0.012 | ||
| At least 9 % | 1,732 vs. 563 | 10.43% vs. 3.60% | 0.270 | 548 vs. 549 | 5.04% vs. 5.04% | 0.000 | ||
| Phosphate | 3.664 ± 0.951 vs. 3.543 ± 0.764 | 3,772 vs. 3,086 | 22.72% vs. 19.73% | 0.141 | 3.555 ± 0.819 vs. 3.544 ± 0.795 | 2,196 vs. 2,265 | 20.18% vs. 20.82% | 0.014 |
| Magnesium | 1.945 ± 0.334 vs. 1.967 ± 0.304 | 3,097 vs. 2,555 | 18.65% vs. 16.34% | 0.070 | 1.956 ± 0.319 vs. 1.952 ± 0.311 | 1,798 vs. 1,838 | 16.52% vs. 16.89% | 0.014 |
| Ferritin | 241.49 ± 526.31 vs. 200.83 ± 561.48 | 3,103 vs. 2,299 | 18.69% vs. 14.70% | 0.075 | 200.65 ± 396.23 vs. 201.35 ± 490.87 | 1,734 vs. 1,733 | 15.94% vs. 15.93% | 0.002 |
| Iron | 70.930 ± 41.590 vs. 78.260 ± 37.135 | 2,953 vs. 2,279 | 17.79% vs. 14.57% | 0.186 | 75.219 ± 39.526 vs. 76.038 ± 37.949 | 1,682 vs. 1,677 | 15.46% vs. 15.41% | 0.021 |
| 0–50 ug/dL | 1,138 vs. 614 | 6.86% vs. 3.93% | 0.130 | 532 vs. 510 | 4.89% vs. 4.69% | 0.009 | ||
| 50–100 ug/dL | 1,691 vs. 1,386 | 10.19% vs. 8.86% | 0.045 | 995 vs. 1,001 | 9.14% vs. 9.20% | 0.002 | ||
| 100–200 ug/dL | 580 vs. 600 | 3.49% vs. 3.84% | 0.018 | 401 vs. 406 | 3.69% vs. 3.73% | 0.002 | ||
| C reactive protein | 18.166 ± 37.652 vs. 11.456 ± 28.640 | 2,020 vs. 1,918 | 12.17% vs. 12.27% | 0.201 | 14.106 ± 32.965 vs. 13.350 ± 30.687 | 1,248 vs. 1,269 | 11.47% vs. 11.66% | 0.024 |
| 0–10 mg/L | 1,402 vs. 1,565 | 8.45% vs. 10.01% | 0.054 | 966 vs. 984 | 8.88% vs. 9.04% | 0.006 | ||
| 10–20 mg/L | 455 vs. 293 | 2.74% vs. 1.87% | 0.058 | 236 vs. 235 | 2.17% vs. 2.16% | 0.001 | ||
| 20–40 mg/L | 295 vs. 186 | 1.78% vs. 1.19% | 0.049 | 149 vs. 147 | 1.37% vs. 1.35% | 0.002 | ||
|
|
|
|
|
|
|
|
|
|
|---|---|---|---|---|---|---|---|---|
| 1 year | Dementia | VDD | 10,463 | 88 | 99.137% | 1.323 | (0.963–1.819) | 0.083 |
| VDA | 10,465 | 67 | 99.348% | |||||
| 3 years | VDD | 10,466 | 225 | 97.702% | 1.396 | (1.142–1.707) | 0.001 | |
| VDA | 10,466 | 164 | 98.352% | |||||
| 5 years | VDD | 11,478 | 365 | 96.48% | 1.241 | (1.066–1.446) | 0.005 | |
| VDA | 11,479 | 301 | 97.14% | |||||
| 1 year | Alzheimer's disease | VDD | 10,559 | 47 | 99.544% | 1.314 | (0.852–2.029) | 0.216 |
| VDA | 10,547 | 36 | 99.652% | |||||
| 3 years | VDD | 10,559 | 89 | 99.103% | 1.157 | (0.854–1.569) | 0.345 | |
| VDA | 10,549 | 78 | 99.222% | |||||
| 5 years | VDD | 11,573 | 150 | 98.56% | 1.224 | (0.965–1.552) | 0.095 | |
| VDA | 11,570 | 125 | 98.82% | |||||
| 1 year | Parkinson's disease | VDD | 10,518 | 25 | 99.757% | 1.401 | (0.765–2.569) | 0.273 |
| VDA | 10,542 | 18 | 99.826% | |||||
| 3 years | VDD | 10,519 | 57 | 99.42% | 1.234 | (0.839–1.816) | 0.285 | |
| VDA | 10,543 | 47 | 99.529% | |||||
| 5 years | VDD | 11,532 | 99 | 99.04% | 1.066 | (0.805–1.413) | 0.655 | |
| VDA | 11,568 | 95 | 99.09% |
Peer Reviews
No public reviews on file for this paper yet. If you reviewed it on a platform where reviews are public (OpenReview, ICLR, NeurIPS, ICML), you can paste yours below so the community can read it here.
Videos
No videos yet. Explain this paper in a talk, walkthrough, or lecture? Add one.
Taxonomy
TopicsGlaucoma and retinal disorders · Vitamin D Research Studies · Retinal Diseases and Treatments
Introduction
1
The global rise in age-related neurological conditions establishes neurodegeneration as a major public health priority (1). Glaucoma, the world's leading cause of irreversible blindness, presents a significant and increasing clinical burden. In 2020, the number of people aged 40–80 years affected by glaucoma globally was estimated at 76 million, projected to rise to 111.8 million by 2040 (2, 3). Glaucoma, historically defined by abnormal intraocular pressure, is now fundamentally recognized as a progressive optic neuropathy involving the irreversible attrition of retinal ganglion cells (RGCs) and their axons (4, 5). This pathology is strongly supported by shared molecular mechanisms with central nervous system (CNS) diseases, including oxidative stress, chronic neuroinflammation, mitochondrial damage, and common genetic risk loci (5–8). This mechanistic overlap suggests that glaucoma should not be viewed as an isolated ocular disorder but as part of a broader, systemic neurodegenerative vulnerability (9).
This systemic view is further validated by population-based epidemiological data. Glaucoma patients consistently demonstrate a heightened risk for developing general cognitive impairment and Alzheimer's disease (AD) compared to the general population, with established hazard ratios (HRs) typically ranging from 1.23 to 1.89 (10–13). This association emphasizes the fact that glaucoma patients represent a cohort already burdened with a pre-existing neurodegenerative process, making them uniquely susceptible to additional systemic factors that influence central neurodegenerative trajectories (9). However, the exact role of systemic factors in influencing the longitudinal hazard of developing central neurodegenerative diseases in this high-risk population has not been fully elucidated. Establishing such associations is critical for treating glaucoma as a multisystem disorder and for informing preventative strategies and interdisciplinary management in this aging population.
One such crucial and widespread systemic factor influencing these shared trajectories is vitamin D Deficiency (VDD), defined in this study as serum 25-hydroxyvitamin D (25(OH)D) levels < 30 ng/mL. Vitamin D's physiological influence extends far beyond its well-known role in calcium homeostasis (14). The active metabolite, 1,25-dihydroxyvitamin D, functions as a pleiotropic steroid hormone, binding the vitamin D Receptor (VDR), which is widely expressed in key CNS areas, including the retina, optic nerve head, and brain parenchyma (15–17). VDD has been implicated in diverse neurobiological processes, such as regulating immune responses (18, 19), stabilizing vascular endothelial function (20), and promoting the clearance of amyloid-beta (21–23). Vitamin D deficiency is linked to a higher risk of dementia and Alzheimer's disease, with low levels increasing dementia risk by about 49% (24). Accordingly, a substantial body of observational evidence independently links VDD to an elevated risk of all-cause dementia in the general population, with meta-analyses reporting HRs between 1.19 and 2.28 (25–27).
Although the neurodegenerative risks conferred by both glaucoma and VDD are individually well-characterized, the synergistic impact of VDD specifically on the longitudinal neurodegenerative risk within a cohort already compromised by glaucoma remains a significant clinical knowledge gap. Glaucoma patients offer a critical model to evaluate if a modifiable systemic factor like VDD accelerates pre-existing CNS decline.
Therefore, we conducted a large-scale, retrospective cohort study utilizing Propensity Score Matching (PSM) to assess the longitudinal association between baseline VDD and the subsequent 5-year incidence of three key neurodegenerative outcomes: unspecified dementia, AD, and Parkinson's disease (PD), in patients with glaucoma. By employing comprehensive PSM to create two highly comparable VDD and vitamin D Adequacy (VDA, ≥30 ng/mL) cohorts, we aimed to minimize the effects of systemic confounding. We hypothesized that VDD would function as a potential risk marker associated with a significantly higher hazard of neurodegenerative disease, particularly dementia, in this high-risk patient group.
Methods
2
Study design and data source
2.1
This investigation was conducted as a retrospective cohort study, utilizing de-identified, and patient-level data obtained from the TriNetX platform. TriNetX is a federated global health research network that aggregates real-world electronic health records (EHRs) from hospitals and healthcare systems across the United States. The analysis was executed within the US Collaborative Network on October 11, 2025, which encompasses 71 healthcare organizations providing comprehensive longitudinal clinical data. All data extraction and analyses were performed exclusively within the secure TriNetX cloud environment. Given that all data were fully de-identified in strict compliance with HIPAA and GDPR, the requirement for institutional review board approval and informed patient consent was waived by the platform. Nevertheless, the study protocol received independent review and approval from the Taipei Tzu Chi Hospital Institutional Review Board (Approval Number: 14-IRB134) and adhered to the ethical principles of the Declaration of Helsinki.
Study population and exposure definition
2.2
The initial population comprised adults (aged 18 years or older) with a documented glaucoma diagnosis (ICD-10-CM codes H40–H42, specifically including primary open-angle H40.1 and primary angle-closure H40.2) recorded between 1 January 2005 and 1 January 2020. The initial screen identified 761,232 patients. Cases were subsequently restricted to first-occurrence glaucoma without secondary causes by excluding any secondary glaucoma codes (H40.3–H40.6) recorded within 1 year on or before the index glaucoma diagnosis, resulting in 722,862 eligible patients.
Vitamin D status was determined based on serum 25-hydroxyvitamin D [25(OH)D] concentrations identified by LOINC code 1989-3. Measurements obtained within 1 year prior to the first glaucoma record were included, and for patients with multiple results, the value closest to the index date was selected to best reflect pre-observation physiological status. To ensure stable baseline exposure, individuals with any historical 25(OH)D value < 30 ng/mL were excluded from the VDA cohort, and those with any prior value ≥30 ng/mL were excluded from the VDD cohort, minimizing potential misclassification due to recent status changes. Over 92% of matched participants in both cohorts had complete baseline 25(OH)D data with minimal missing values. Patients were categorized into two exposure groups: VDD (< 30 ng/mL) and VDA (≥30 ng/mL), with 16,602 and 15,638 participants, respectively, prior to matching.
Index date and follow-up period
2.3
The index date was set as the earliest date a patient met all the criteria for a glaucoma diagnosis. The observational follow-up period commenced 1 day after the index date, with a maximum duration of 1,825 days (5 years), censored by the event of death or the end of available health records, whichever occurred first. Any patient with evidence of the primary outcome prior to the start of the observation window was excluded from the analyses to ensure the capture of incident outcomes.
Propensity score matching
2.4
To mitigate selection bias and minimize the influence of confounding factors, a 1:1 PSM procedure was implemented using a greedy nearest-neighbor algorithm with a caliper width of 0.1. Matching covariates included 46 clinically relevant variables, such as demographic features, comorbid cardiometabolic conditions, medication use, renal and metabolic laboratory indices, and inflammatory biomarkers. Crucially, the exposure-defining variable (serum 25(OH)D levels) was excluded from the covariate list to maintain the primary exposure contrast. First, the standardized mean differences (SMDs) were calculated post-matching to confirm acceptable covariate balance, with an SMD < 0.1 considered indicative of comparability. Second, the overlap of propensity score distributions (common support) was visually inspected to ensure that the matched cohort shared similar characteristics across the entire range of the propensity scores (Supplementary Figure S1). The final pre-matched cohorts comprised 16,602 patients in VDD and 15,638 in VDA. Following PSM, both the VDD and VDA cohorts contained 10,881 individuals.
Outcome measures
2.5
The primary endpoint was the incidence of neurodegenerative disorders during the 5-year follow-up period, defined as a composite outcome comprising the following ICD-10-CM codes: unspecified dementia (F03), Alzheimer's disease (G30), and Parkinson's disease (G20). Unspecified dementia captured clinically confirmed dementia without subtype specification, Alzheimer's disease included all sub codes representing Alzheimer's pathology—the most common specific dementia subtype—and Parkinson's disease represented primary Parkinsonism. These conditions were selected for their clinical relevance and high prevalence in U.S.-based EHR data, with Alzheimer's disease and unspecified dementia together accounting for most dementia diagnoses and providing a robust basis for evaluating associations with vitamin D status.
Statistical and sensitivity analysis
2.6
All statistical computations, including the estimation of absolute risks, risk ratios, and odds ratios, were executed using the integrated Risk Analysis features of the TriNetX platform. The cumulative incidence of time-to-event outcomes was visualized using Kaplan–Meier survival curves, and differences between the VDD and VDA groups were tested using the Log-Rank test. Cox proportional hazards models were subsequently employed to calculate the HRs and their associated 95% Confidence Intervals (CIs) for incident outcomes. Statistical significance was predefined by a two-sided p-value less than 0.05. Primary statistical analyses, including propensity score matching (PSM) and Cox proportional hazards regression, were performed within the TriNetX (Cambridge, MA, USA) analytics platform. For data visualization and figure generation, we utilized GraphPad Prism (version 8.0.1) and Microsoft Excel.
A comprehensive set of sensitivity analyses and one exploratory analysis were performed. We first conducted a Landmark Analysis to assess the time-varying effect of VDD on cumulative incidence and HRs at 1, 3, and 5 years post-index. For Confounding Assessment, we compared the unadjusted HRs with the primary PSM-matched HRs, which quantified the impact of controlling for confounders. We then performed a Severe Deficiency Adjustment by re-analyzing the data using a stricter classification for VDD, defined as 25(OH)D levels < 20 ng/mL, to investigate a potential dose-response relationship. To evaluate the potential mitigating effect of systemic anti-inflammation, we performed a non-steroidal anti-Inflammatory drugs (NSAID) confounding assessment by excluding individuals with recorded long-term NSAID use. Finally, an exploratory healthcare utilization analysis was performed by comparing the mean number of hospital visits between the matched VDD and VDA cohorts to assess baseline differences in health-seeking behavior or comorbidity burden.
To evaluate the potential influence of detection bias and systemic health disparities on study outcomes, we performed supplementary analyses of healthcare utilization over the 5-year follow-up period. Specifically, we compared the VDD and VDA cohorts in terms of hospital visit counts (Supplementary Table S5), frequency of all-cause hospitalizations (Supplementary Table S6), and utilization of ophthalmology-specific services and procedures (Supplementary Table S7), using independent t-tests and Chi-square tests. Finally, to address potential selection bias from missing data, we conducted a Restricted PSM sensitivity analysis by limiting matching covariates to 26 high-completeness variables (>85% data availability), ensuring that the observed association was not sensitive to less complete laboratory parameters (Supplementary Table S8).
Results
3
Cohort characteristics and propensity score matching
3.1
As shown in Figure 1, the derivation of the final study cohort commenced with the identification of 761,232 adult patients (aged 18 years or older) diagnosed with glaucoma (ICD-10 codes H40–H42). After applying exclusion criteria for secondary glaucoma, 722,862 individuals remained. Vitamin D status was determined by serum 25-hydroxyvitamin D (25(OH)D) levels: 16,602 individuals met the criteria for VDD (25(OH)D < 30 ng/mL), and 15,638 for VDA (25(OH)D ≥ 30 ng/mL).
Study flow diagram: cohort assembly and propensity-score matching (PSM) of glaucoma patients by vitamin D status. This schematic illustrates the analytic process used to construct the study cohorts from a retrospective dataset within the TriNetX research network, designed to evaluate the 5-year incidence risks of neurodegenerative diseases. The process began with an initial source population of 761,232 adults (aged 18 years or older) diagnosed with glaucoma (ICD-10 codes: H40–H42, specifically H40.1 and H40.2) recorded between 1 January 2005 and 1 January 2020. This group was subsequently refined to 722,862 individuals by excluding those with any secondary causes of glaucoma (H40.3–H40.6) recorded within the year preceding or on the index diagnosis date. Exposure groups were defined based on serum 25-hydroxyvitamin D (25(OH)D) levels (LOINC 1989-3) measured up to 1 year before the initial glaucoma diagnosis. This classification established two principal groups: the Vitamin D Deficiency (VDD) cohort (25(OH)D less than 30 ng/mL, n = 16,602) and the Vitamin D Adequacy (VDA) cohort (30 ng/mL or greater, n = 15,638). To ensure baseline comparability, a 1:1 Propensity Score Matching (PSM) procedure was employed. This matching utilized covariate including demographics (age, sex, race/ethnicity), relevant laboratory findings, and comorbid conditions. The final, balanced study cohorts used for comparative analysis consisted of 10,881 patients in the VDD group and 10,881 patients in the VDA group. The pre-specified 5-year outcomes analyzed were incident unspecified Dementia (ICD-10 F03), Alzheimer's disease (G30), and Parkinson's disease (G20).
To ensure unbiased comparisons, a comprehensive 1:1 PSM was performed using 46 covariates (excluding the exposure-defining variable, serum 25(OH)D), successfully creating two well-balanced cohorts, each containing 10,881 patients. As shown in Table 1, the matching process successfully resolved marked baseline imbalances, including the age difference (VDD 61.5 ± 11.3 years vs. VDA 61.6 ± 11.5 years; Standardized Mean Difference, SMD, SMD = 0.002). Furthermore, the propensity score density plots demonstrated near-perfect overlap between the matched cohorts, confirming robust common support (Supplementary Figure S1). These finalized cohorts were then followed for up to 5 years to assess the association of neurodegenerative outcomes.
Kaplan–Meier survival analysis
3.2
Kaplan–Meier survival analyses demonstrated a significant difference in the primary outcome, unspecified dementia, between glaucoma patients with VDD and those with VDA over the 5-year follow-up period, as shown in Figure 2A.
Kaplan–Meier survival curves: neurodegenerative outcomes by vitamin D status in glaucoma patients. Kaplan–Meier survival curves illustrating the cumulative incidence of developing three distinct neurocognitive outcomes in glaucoma patients. The analysis compares patients categorized by their 25-hydroxyvitamin D (25(OH)D) status in a Propensity Score-Matched (PSM) cohort: those with Vitamin D Deficiency (VDD, 25(OH)D < 30 ng/mL) and those with Vitamin D Adequacy (VDA, 25(OH)D ≥30 ng/mL). (A) depicts the incidence of Dementia, where the VDD cohort showed a significantly higher cumulative incidence compared to the VDA cohort, with statistical significance determined using an adjusted Cox proportional-hazards model (p = 0.005, derived from the log-rank test). (B, C) show the incidence of Alzheimer's Disease (AD) and Parkinson's Disease (PD), respectively. For these specific neurodegenerative subtypes, no significant difference in cumulative incidence was observed between the VDD and VDA groups; this non-significant finding is consistent with limitations in statistical power due to lower event rates for AD and PD.
VDD was associated with a higher risk of unspecified dementia, with a significantly lower survival probability throughout the observation window (Log-Rank chi-squared = 7.742; p = 0.005) and an increased hazard of disease (HR = 1.241; 95% CI: 1.066–1.446) (Figure 2A). The absolute 5-year risk was 3.2% in the VDD cohort vs. 2.6% in the VDA cohort (Supplementary Table S1).
By contrast, there was no statistically significant difference in the incidence of AD (Figure 2B) or PD (Figure 2C). For AD, the association was non-significant (HR 1.224; 95% CI: 0.965–1.552; p = 0.095). Similarly, PD incidence was nearly identical between the two groups (HR 1.066; 95% CI: 0.805–1.413; p = 0.655).
Landmark analyses
3.3
Landmark Kaplan–Meier analyses comparing glaucoma patients with VDD and VDA were conducted at 1, 3, and 5 years following the index diagnosis (Table 2).
The excess risk of dementia associated with VDD strengthened over the follow-up period. At 1 year, the difference was not yet statistically significant (HR 1.323, 95% CI 0.963–1.819; p = 0.083). However, the elevated risk became significant at the 3-year landmark (HR 1.396; p = 0.001) and remained significant at 5 years (HR 1.241; 95% CI 1.066–1.446; p = 0.005).
Across all landmark analyses, the incidence of AD and PD did not show statistically significant survival differences, indicating that the impact of VDD is primarily associated with the broader dementia diagnosis and the effect is most pronounced in the mid-to-long term.
Subgroup analyses
3.4
Due to limited case counts for specific outcomes, the subgroup analysis (Figure 3) and effect modification assessment were performed exclusively for unspecified dementia. Analysis across patient subgroups revealed that the 5-year dementia risk associated with VDD was markedly influenced by the presence of specific baseline characteristics.
Subgroup Analysis of 5-Year Dementia Risk Stratified by Vitamin D Status in Glaucoma Patients. Forest plot presenting hazard ratios (HR) for the 5-year risk of incident dementia, comparing the Vitamin D Deficiency (VDD, < 30 ng/mL) cohort against the Vitamin D Adequacy (VDA, ≥30 ng/mL) cohort across various clinical subgroups. The VDA group serves as the reference for all HR calculations. Each row displays the HR and its 95% Confidence Interval (CI). The vertical dashed line at HR = 1.0 indicates the null value. All HRs were calculated using Cox proportional-hazards models adjusted for age, sex, and race/ethnicity, highlighting the consistent association across demographics, cardiometabolic conditions (e.g., diabetes, hypertension), and inflammatory markers (e.g., CRP). G-OA, Open-angle glaucoma; VDD, Vitamin D Deficiency; VDA, Vitamin D Adequacy; HR, Hazard Ratio; CI, Confidence Interval; CRP, C-Reactive Protein; GFR, Glomerular Filtration Rate; BMI, Body Mass Index; DM, Diabetes Mellitus; HT, Hypertension.
Advanced age (65 years or older vs. 18–64 years) emerged as the most significant predictor (HR 6.84, 95% CI 5.15–9.08; p = 0.0001). Other major risk factors included hypertension (HR 2.70, 1.64–4.44; p < 0.0001), hypoalbuminemia (albumin < 4 vs. ≥4 g/dL: HR 2.64, 2.08–3.36; p < 0.0001), elevated inflammatory burden (CRP level 10 mg/L or greater vs. less than 10 mg/L; HR 1.38, 1.04–1.84; p = 0.026), and diabetes (HR 1.29, 1.03–1.92; p = 0.027). Conversely, higher BMI (30 kg/m^2^ or greater vs. less than 30 kg/m^2^) was associated with a paradoxical lower observed risk (HR 0.59, 0.44–0.77; p < 0.001). Glaucoma subtype was not a significantly associated with dementia risk (HR = 0.814; 95% CI: 0.63–1.05; p = 0.115).
Sensitivity and detection bias assessment
3.5
Sensitivity analyses confirmed the robustness of the primary findings under varied conditions. Before propensity score matching (PSM), VDD was associated with a lower hazard of unspecified dementia (HR = 0.871; 95% CI: 0.762–0.995; P = 0.042), which reversed after matching, showing a higher hazard (HR = 1.241; 95% CI: 1.066–1.446; P = 0.005) (Supplementary Table S2). Applying a stricter deficiency threshold (25[OH]D < 20 ng/mL) revealed a stronger association with dementia risk (HR = 1.493; 95% CI: 1.179–1.890; P < 0.001) than the primary threshold of < 30 ng/mL (Supplementary Table S3). Excluding long-term NSAID users attenuated the association, rendering it non-significant (HR = 1.178; 95% CI: 0.998–1.391; P = 0.053) (Supplementary Table S4). Finally, healthcare utilization during follow-up was examined (Supplementary Tables S5–S7). After matching, the VDA cohort had a higher baseline visit frequency (120.49 vs. 110.86 visits; P < 0.0001; Supplementary Table S5), while 5-year hospitalization rates were similar between groups (1.93 vs. 1.89 visits; P = 0.641; Supplementary Table S6). The VDA group also exhibited more ophthalmology-related encounters and procedures than the VDD group (3.17 vs. 2.87 visits; P < 0.0001; Supplementary Table S7).
The restricted sensitivity analysis confirmed that the hazard ratio remained stable when matching was limited to high-completeness variables (HR 1.239, p = 0.008; Supplementary Table S8).
Discussion
4
This large-scale retrospective cohort study, utilizing a PSM cohort of glaucoma patients, establishes a significant and independent association between VDD (25(OH)D < 30 ng/mL) and an increased hazard of developing unspecified dementia (HR 1.241; P = 0.005). This result suggests that VDD confers a modest, yet clinically meaningful, long-term increase in dementia risk within this vulnerable neurodegenerative population. This pattern is consistent with existing epidemiological literature, which reports the strongest risk association for VDD with unspecified dementia (25, 28), and inconsistent or null association with PD (29, 30).
The necessity of the PSM procedure is validated by the elimination of a substantial bias. Prior to PSM, VDD falsely suggested a protective effect (HR 0.871; p = 0.042); the correction revealed a significant, harmful association (HR 1.241; p = 0.005). Furthermore, the dose-response relationship confirmed in the sensitivity analysis, where a more severe deficiency (25(OH)D < 20 ng/mL) yielded a notably stronger signal (HR 1.493; p < 0.001), supports validity of this core finding.
Biological plausibility and mechanisms
4.1
The association between VDD and increased dementia risk is highly consistent with the known pleiotropic, non-skeletal actions of vitamin D. 1,25-dihydroxyvitamin D functions as a crucial steroid hormone by binding the VDR, which is widely expressed throughout the CNS, including the hippocampus, cortex, and key ocular neuroglial elements like retinal ganglion cells and optic nerve head astrocytes (19, 28, 31).
Vitamin D supports neural protection by aiding amyloid clearance and reducing neuronal toxicity, while deficiency may promote vascular dysfunction and brain atrophy associated with cognitive decline (27, 32) In neurological tissues, active vitamin D signaling regulates processes critical to neurodegeneration by down-modulating chronic inflammation and oxidative stress, such as suppressing the NF-kappa-B signaling pathway (18, 33). Since both glaucoma and dementia involve chronic low-grade neuroinflammation (34–37), VDD may act as an inflammatory sensitizer, compounding neuronal vulnerability and accelerating CNS decline (18, 38).
Systemic vulnerability and modifying factors
4.2
The inflammatory mechanism proposed is strongly supported by the sensitivity analysis focusing on NSAID use. Long-term NSAID use is epidemiologically linked to reduced dementia risk, and the protective effect appears more pronounced for NSAIDs without amyloid-β lowering properties, and cumulative dose does not play a major role (39, 40). The finding that the association between vitamin D deficiency and dementia risk diminishes to non-significance after excluding long-term NSAID users underscores a potentially complex relationship. It suggests that the anti-inflammatory effects of NSAIDs might not effectively reduce or could even influence the excess dementia risk linked to vitamin D deficiency, possibly acting as a systemic inflammation proxy or marker (41, 42). This attenuation indicates that long-term NSAID use may confound or modify the relationship between vitamin D status and dementia, emphasizing the role of systemic inflammation in dementia pathogenesis. Limited data exist on how vitamin D deficiency and NSAID use interact in relation to dementia risk, with no strong evidence for a synergistic or antagonistic effect. Current evidence suggests vitamin D deficiency raises the risk of dementia, while long-term NSAID use may modestly reduce it, likely via anti-inflammatory mechanisms (41, 42). However, NSAIDs are not recommended clinically for dementia prevention due to their potential adverse effects and inconsistent findings across studies, with research often limited to prescription use and possibly missing over-the-counter consumption (39).
Subgroup analysis revealed that the dementia risk associated with VDD is highly dependent on underlying systemic health. Markers of advanced age (HR 6.84), hypertension (HR 2.70), and hypoalbuminemia (HR 2.64) were powerful predictors, suggesting that VDD may function primarily as an indicator of an overall vulnerable systemic profile rather than the sole driver of pathology (28, 43).
Also, the elevated risk was also pronounced in patients with markers of systemic inflammation: elevated CRP (≥10 mg/L) (HR 1.38) and diabetes (HR 1.29), reinforcing that VDD compounds risk in individuals with high inflammatory and metabolic burdens, pointing toward a shared pathway involving microvascular compromise (44–46). The finding that higher BMI (≥30 kg/m^2^) was associated with a paradoxical lower observed risk (HR 0.59) must be interpreted with caution. Potential explanations include reverse causation, where pre-clinical dementia leads to weight loss, or that higher BMI may reflect better underlying nutritional reserves acting as a buffer against severe systemic decline and frailty (47, 48).
On the contrary, our analysis showed that glaucoma subtype (PACG vs. POAG) did not significantly influence the hazard for dementia (HR = 0.814, p = 0.115). This contrast emphasizes that systemic metabolic and inflammatory factors, rather than local ophthalmic classifications, are the primary drivers of neurodegenerative outcomes in this population.
Subtype findings and residual confounding
4.3
The decision to focus on “unspecified dementia” is validated by clinical practice: many patients initially present with cognitive decline that cannot be confidently classified, and thus “unspecified” or mixed dementia diagnoses account for the majority of incident cases (49, 50). These early, heterogeneous presentations provide greater statistical power. Conversely, the lower event rates for specific neurodegenerative subtypes (AD and PD) in our cohort resulted in limited power to detect subtype-specific associations.
Although comprehensive PSM accounted for multiple covariates, differences in healthcare utilization persisted. The VDA cohort showed higher frequencies of hospital visits and ophthalmic services (Supplementary Tables S5 and S7), which may reflect an underlying tendency for greater healthcare engagement or a different comorbidity profile—factors often cited as sources of unmeasured confounding in large-scale EHR studies (51–53). However, rather than weakening the results, this pattern strengthens their validity. Greater clinical contact in the VDA group would typically increase the chance of dementia detection, yet the VDD cohort still exhibited a higher dementia risk. This suggests that detection bias is unlikely to explain the association and, if present, would have reduced rather than exaggerated the observed effect. Comparable hospitalization rates between cohorts (Supplementary Table S6) further indicate that the findings are not driven by greater systemic disease burden in the VDD group. Consistent results across sensitivity analyses reinforce the robustness of these findings. When limiting the propensity score model to 26 high-completeness variables (Supplementary Table S8), the estimated hazard ratio for dementia remained virtually unchanged, confirming that the association between vitamin D deficiency and dementia risk is stable and not materially influenced by data completeness or model specification.
Limitations
4.4
This retrospective EHR study has inherent limitations precluding causal inference, including reliance on ICD-10 codes prone to inaccuracies, a single baseline 25(OH)D measure omitting longitudinal changes, and absence of granular ophthalmic staging (e.g., visual field indices, cup-to-disc ratios) despite no glaucoma subtype-dementia interaction (P = 0.115). The “unspecified dementia” endpoint limits etiological specificity; however, supplementary analyses refute detection bias from differential healthcare use, as the VDA group had more ophthalmology encounters (P < 0.0001). Although 1:1 propensity score matching and no multiple imputation were used, excellent covariate balance (all SMDs < 0.1), large sample size, and stable sensitivity analyses support robust, clinically relevant findings despite potential generalizability constraints from the federated EHR platform.
Conclusion
5
This large-scale, PSM-matched retrospective cohort study suggests that VDD is associated with an increased likelihood for developing unspecified dementia in patients with primary glaucoma (HR 1.241). This elevated risk, which is amplified by concurrent systemic inflammation and cardiometabolic diseases but not reduced by long-term NSAIDs, highlights the importance of considering a systemic approach in glaucoma management. Our findings support integrating vitamin D assessment and optimization into clinical care to potentially reduce neurocognitive decline. Given the observational nature of this cohort, further prospective research is warranted to account for potential residual confounding and ascertainment bias, and to clarify the therapeutic efficacy of vitamin D supplementation.
The reference list from the paper itself. Each links out to its DOI / PubMed record.
- 1Collaborators GBDNSD. Global, regional, and national burden of disorders affecting the nervous system, 1990-2021: a systematic analysis for the Global Burden of Disease Study 2021. Lancet Neurol. (2024) 23:344–81. doi: 10.1016/S 1474-4422(24)00038-338493795 PMC 10949203 · doi ↗ · pubmed ↗
- 2Jayaram H Kolko M Friedman DS Gazzard G. Glaucoma: now and beyond. Lancet. (2023) 402:1788–801. doi: 10.1016/S 0140-6736(23)01289-837742700 · doi ↗ · pubmed ↗
- 3Tham YC Li X Wong TY Quigley HA Aung T Cheng CY. Global prevalence of glaucoma and projections of glaucoma burden through 2040: a systematic review and meta-analysis. Ophthalmology. (2014) 121:2081–90. doi: 10.1016/j.ophtha.2014.05.01324974815 · doi ↗ · pubmed ↗
- 4Fernandez-Albarral JA Ramirez AI de Hoz R Matamoros JA Salobrar-Garcia E Elvira-Hurtado L . Glaucoma: from pathogenic mechanisms to retinal glial cell response to damage. Front Cell Neurosci. (2024) 18:1354569. doi: 10.3389/fncel.2024.135456938333055 PMC 10850296 · doi ↗ · pubmed ↗
- 5Ju WK Perkins GA Kim KY Bastola T Choi WY Choi SH. Glaucomatous optic neuropathy: Mitochondrial dynamics, dysfunction and protection in retinal ganglion cells. Prog Retin Eye Res. (2023) 95:101136. doi: 10.1016/j.preteyeres.2022.10113636400670 · doi ↗ · pubmed ↗
- 6Sacca SC Paluan F Gandolfi S Manni G Cutolo CA Izzotti A. Common aspects between glaucoma and brain neurodegeneration. Mutat Res Rev Mutat Res. (2020) 786:108323. doi: 10.1016/j.mrrev.2020.10832333339584 · doi ↗ · pubmed ↗
- 7Mirzaei M Gupta VB Chick JM Greco TM Wu Y Chitranshi N . Age-related neurodegenerative disease associated pathways identified in retinal and vitreous proteome from human glaucoma eyes. Sci Rep. (2017) 7:12685. doi: 10.1038/s 41598-017-12858-728978942 PMC 5627288 · doi ↗ · pubmed ↗
- 8Diaz-Torres S He W Thorp J Seddighi S Mullany S Consortium IIGG . Disentangling the genetic overlap and causal relationships between primary open-angle glaucoma, brain morphology and four major neurodegenerative disorders. E Bio Medicine. (2023) 92:104615. doi: 10.1016/j.ebiom.2023.10461537201334 PMC 10206164 · doi ↗ · pubmed ↗