Modeling dose to normal brain following hypofractionated stereotactic radiotherapy to a single brain metastasis
Erin Johns, Catriona Hargrave, Lisa Nissen, Tamara J Barry, Anne Bernard, Mark B Pinkham

TL;DR
This study develops models to predict low-dose exposure to normal brain tissue during radiotherapy for brain metastases, aiming to improve treatment planning.
Contribution
The study introduces predictive models for normal brain dose metrics in hypofractionated stereotactic radiotherapy for single brain metastases.
Findings
Three predictive models were developed to estimate low-dose distribution to normal brain tissue.
The models explain 68.6% to 78.3% of the variation in normal brain dose.
Key factors include PTV location, shape, volume, and arc combinations.
Abstract
Brain metastases (BM) occur in at least 20% of people with an advanced solid malignancy and can lead to morbidity or mortality if not controlled. Hypofractionated stereotactic radiotherapy (HF‐SRT) may be preferred to single fraction stereotactic radiosurgery (SRS) in certain clinical situations to improve the therapeutic ratio. Certain dose‐volume metrics can predict the risk of symptomatic radionecrosis or other toxicities after HF‐SRT but dosimetric predictors of more complex outcomes such as cognitive function are less well described. For this reason, clinicians aim to limit the dose to uninvolved brain so that it is as low as reasonably achievable rather than simply aiming for a threshold goal. The number of treatment arcs and arc length, floor angles and volumetric modulated arc therapy (VMAT) optimization strategies impact low dose distribution outside the target volume, and…
Genes, proteins, chemicals, diseases, species, mutations and cell lines named across the full text — each resolved to its canonical identifier and authoritative record.
Click any figure to enlarge with its caption.
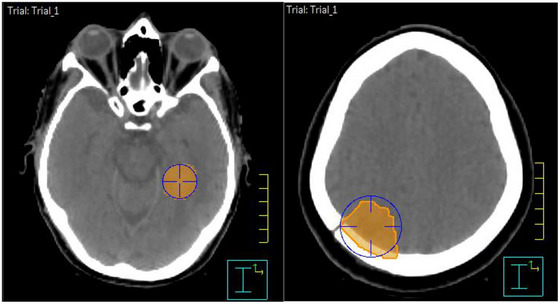 FIGURE 1
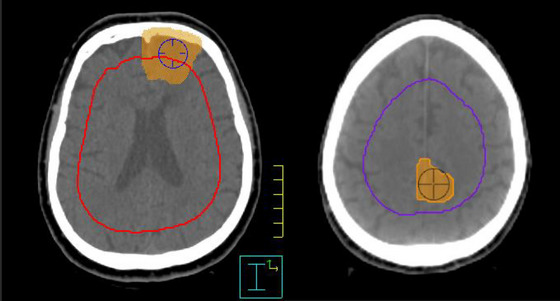 FIGURE 2
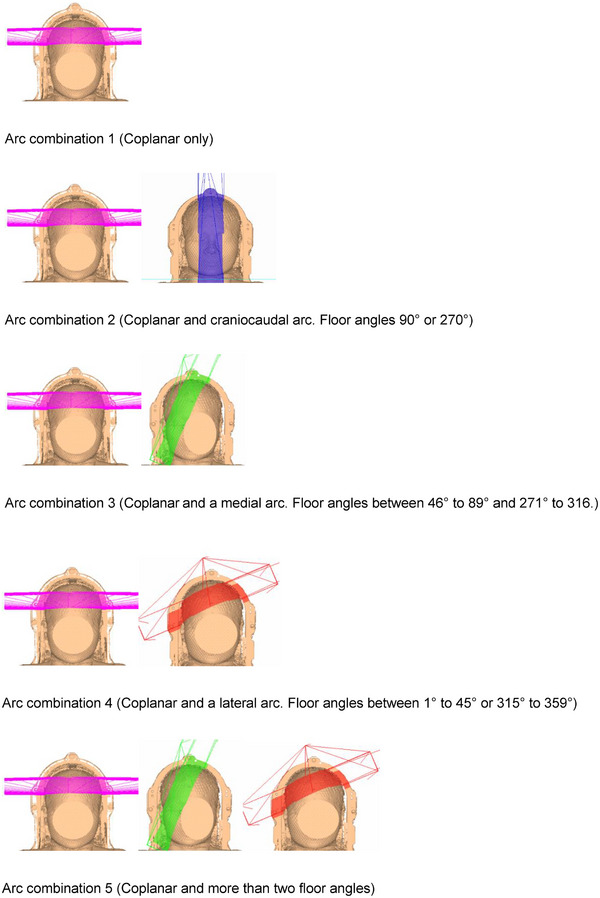 FIGURE 3
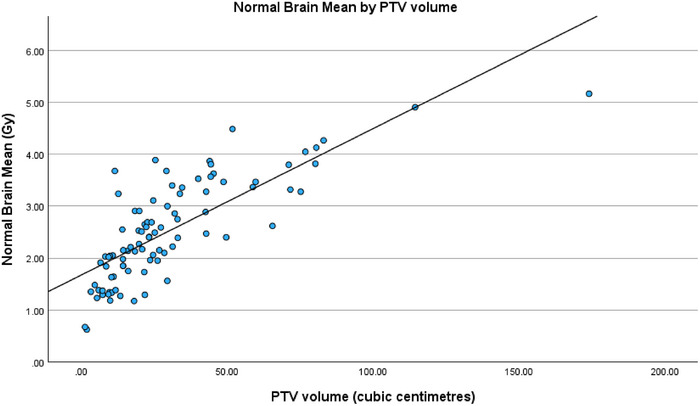 FIGURE 4
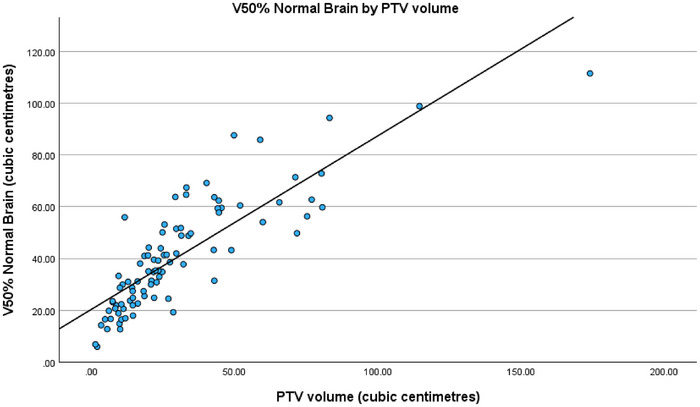 FIGURE 5
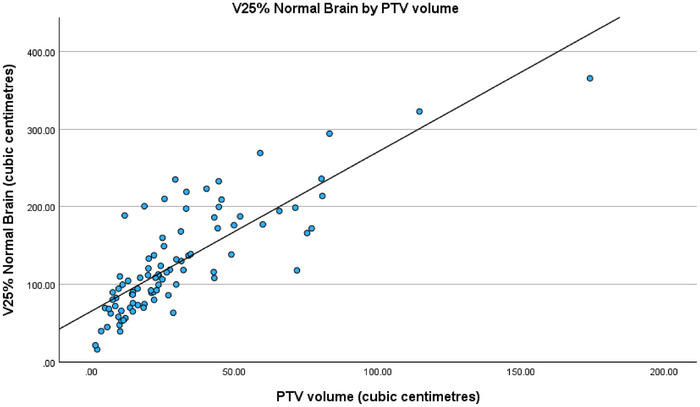 FIGURE 6
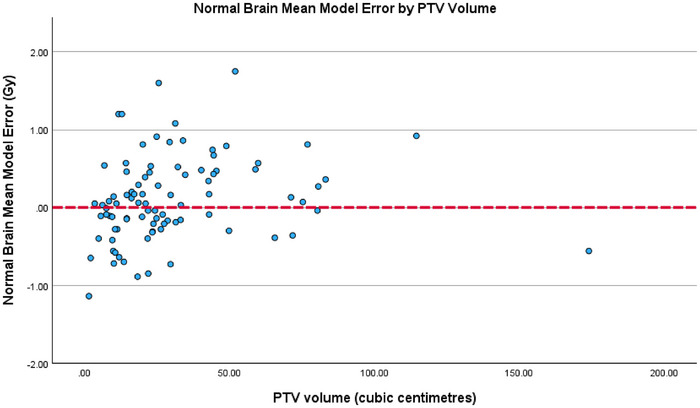 FIGURE 7
| Patient specific variables | Dosimetric variables | Treatment technique variables |
|---|---|---|
|
Prescription Simultaneous Integrated boost PTV volume PTV location PTV shape Number of OARs? Number of PRVs? Was there a competing OARs/PRVs? Number of competing OARs/PRVs? Normal Brain Volume Brain Volume (vertex to foramen magnum) Brain Avoid Volume (vertex to foramen magnum excluding PTV+1cm) |
PTV coverage Plan max Plan max as a percentage Monitor units per fraction Monitor units total Delivery time Brain Avoid max in Gy Brain Avoid max as a percentage Mean normal brain Integral normal brain Mean brain avoid Integral brain avoid Volume of normal brain receiving 50% Volume of normal brain receiving 25% Volume of normal brain receiving 10% Brain Avoid max dose constraint Brain Avoid mean dose constraint |
Number of arcs Arc angle start Arc angle finish Collimator angles Number of different collimator angles Floor angles Number of different floor angles Coplanar arc only Arc length Total arc lengths Arc directions Number of ROI rings |
| Variable |
| % | |
|---|---|---|---|
|
| Deep | 34 | 38% |
| Superficial | 56 | 62% | |
|
| Spherical | 19 | 21% |
| Irregular | 71 | 79% | |
|
| Arc combination 1 | 9 | 10% |
| Arc combination 2 | 42 | 47% | |
| Arc combination 3 | 14 | 16% | |
| Arc combination 4 | 19 | 21% | |
| Arc combination 5 | 6 | 6% | |
|
| Yes | 16 | 18% |
| No | 74 | 82% | |
|
| 1 | 9 | 10% |
| 2 | 75 | 83% | |
| 3 | 6 | 7% | |
|
| 1 | 45 | 50% |
| 2 or 3 | 45 | 50% | |
|
| 1 or 2 | 60 | 67% |
| 3 or 4 | 30 | 33% |
| Variable | Fixed or Modifiable | Statistical test |
|
|---|---|---|---|
| PTV volume | Fixed | Pearson correlation |
|
| PTV shape | Fixed | Mann–Whitney |
|
| PTV location | Fixed | Independent |
|
| Competing OAR | Fixed | Mann–Whitney |
|
| Arc combinations | Modifiable | ANOVA |
|
| Floor angles | Modifiable | Kruskal–Wallis |
|
| Total arc length | Modifiable | Pearson correlation |
|
| Number of arcs | Modifiable | Independent |
|
| Collimator angles | Modifiable | Independent |
|
| Normal Brain Mean | Fixed or Modifiable |
|
|---|---|---|
| PTV volume | Fixed |
|
| PTV shape | Fixed |
|
| PTV location | Fixed |
|
|
|
|
|
| PTV volume | Fixed |
|
| PTV shape | Fixed |
|
| PTV location | Fixed |
|
| Arc Combinations | Modifiable |
|
|
|
|
|
| PTV volume | Fixed |
|
| PTV shape | Fixed |
|
| PTV location | Fixed |
|
| Arc combinations | Modifiable |
|
| Variable | Coding for models |
|---|---|
| PTV volume | Volume of PTV in cm3 |
| PTV location |
0 = Superficial [referent] 1 = Deep |
| PTV shape |
0 = Irregular [referent] 1 = Spherical |
| Arc combinations |
1 = AC1 (Arc combination 1) 1 = AC2 (Arc combination 2) 1 = AC3 (Arc combination 3) 1 = AC4 (Arc combination 4) 0 = AC5 (Arc combination 5) [referent] *remove any unused variable from equation |
| Order of variable and standardized coefficients | |||||||
|---|---|---|---|---|---|---|---|
| Normal brain mean |
PTV volume 0.65 |
Superficial PTV 0.28 |
Irregular PTV −0.19 | N/A | N/A | N/A | N/A |
| V50% |
PTV volume 0.76 |
Superficial PTV 0.24 |
Arc combination 3 0.20 |
Irregular PTV −0.19 |
Arc combination 1 0.1 |
Arc combination 4 −0.02 |
Arc combination 2 0.01 |
| V25% |
PTV volume 0.74 |
Superficial PTV 0.28 |
Irregular PTV −0.15 |
Arc combination 3 0.15 |
Arc combination 1 0.13 |
Arc combination 4 0.03 |
Arc combination 2 0.03 |
- —Princess Alexandra Hospital Research Foundation
Peer Reviews
No public reviews on file for this paper yet. If you reviewed it on a platform where reviews are public (OpenReview, ICLR, NeurIPS, ICML), you can paste yours below so the community can read it here.
Videos
No videos yet. Explain this paper in a talk, walkthrough, or lecture? Add one.
Taxonomy
TopicsBrain Metastases and Treatment · Advanced Radiotherapy Techniques · Glioma Diagnosis and Treatment
INTRODUCTION
1
Brain metastases (BM) occur in at least 20% of people with an advanced solid malignancy and can lead to morbidity or mortality if not controlled. 1, 2, 3 Stereotactic radiosurgery (SRS) is a standard treatment option for people with a limited number of BM, either as definitive management or in combination with surgery.1, 4, 5 Hypofractionated stereotactic radiotherapy (HF‐SRT) may be preferred to single fraction SRS in certain clinical situations to improve the therapeutic ratio, for example, when treating larger BM, eloquent locations or surgical cavities.6, 7
Linac‐based HF‐SRT is commonly delivered using volumetric modulated arc therapy (VMAT) which is a highly conformal technique, but exposure of brain tissue beyond the target to radiation is unavoidable.8, 9 Maximum point doses and dose‐volume metrics can predict the risk of certain complications such as optic neuropathy or radionecrosis after HF‐SRT, but predictors of complex outcomes such as cognitive function are less well described 10, 11, 12 Unlike SRS, where there are established thresholds associated with the volume of healthy brain receiving 10 Gray (Gy), 12 Gy and 14 Gy (V10 Gy, V12 Gy and V14 Gy respectively), reported dose thresholds indicative of toxicity levels after HF‐SRT are varied.11 For this reason, clinicians aim to limit the dose to the uninvolved brain to be as low as reasonably achievable, but typically there is no threshold goal. In practice, it can be hard to know when that point has been reached during the dosimetry optimization process.
Human decision‐making is currently inherent to VMAT plan design, and plan quality can vary according to dosimetrist experience.13, 14 Low dose distribution outside the target volume might vary with arc lengths, arc floor angles or optimization strategies. On the other hand, variation in dose due to patient‐specific factors such as target size and location cannot be changed. The relative contributions and inter‐relations between these combinations of modifiable and fixed factors on low dose to uninvolved brain is not well understood.
Predictive modeling may help facilitate more standardized and efficient workflows, to minimize inter‐user variability, and reduce HF‐SRT planning times to achieve desired dosimetric goals. There is limited literature on predictive modeling in HF‐SRT brain planning. Shiraishi et al.,15 published a knowledge‐based predictive model for SRS patients. Bohoudi et al.,16 also published a SRS model specific to the volume of normal brain receiving 12 Gy. Ruschin et al.,17 investigated the difference in normal brain tissue dose in the HF‐SRT setting when comparing intact lesions and post‐operative brain cavities and their target volumes. A key finding was dose falloff and normal brain dose is largely influenced by planning target volume (PTV) size alone, irrespective of intact or a cavity. However, whether any other factors may influence low dose distribution remains unknown. Ruschin et al.,18 expanded on this research to include the impact of number of target lesions, target shape, target volume and comparison between two treatment techniques. They provided a framework for institutions to compare irradiated volume however the goal of the framework was not to provide the most optimal plan but merely to provide technique comparison. These studies considered a limited number of potential predictive factors on low dose. One of the most recent studies published by Tavakoli et al.,19 developed regression models for intermediate and low dose wash in intracranial BMs, analyzing total PTV volume and number of metastases. Interestingly, there was no correlation with number of lesions, but PTV volume was a principal predictor of low dose to normal brain. Again, this study only investigates a small number of variables. The aim of the current study was to investigate a wider range of modifiable technical and fixed patient‐specific factors to predict low dose distribution in normal brain to assist dosimetrists with plan generation for HF‐SRT for a single BM.
MATERIALS AND METHODS
2
Study cohort and VMAT HF‐SRT technique
2.1
Ethical and governance approvals were granted prior to commencement of this single center study (HREC/2022/QMS/76766). Consecutive patients already treated with VMAT HF‐SRT to a single BM or BM cavity between July 2017 and December 2019 were retrospectively identified from a prospectively maintained departmental database. The cohort was limited to single BM, which were predominantly treated with VMAT. Only a small proportion of multiple‐lesion cases were treated with VMAT, as most were managed with the Gamma Knife (Elekta AB, Stockholm, Sweden) system.
HF‐SRT was delivered in the supine position with thermoplastic mask immobilization on an appropriately commissioned linear accelerator (Elekta Versa HD, Elekta, Stockholm, Sweden). Target volume delineation was based on high resolution gadolinium‐enhanced magnetic resonance imaging (MRI) reconstructed into 1.5mm axial slices. This was co‐registered to their 1mm planning computed tomography (CT) scan which extended from the superior aspect of the shell board to inferior of the clavicles. For intact BM, the gross target volume was based on enhancing disease on the T1 weighted MRI sequences and isotropically expanded by 1.5mm to create the PTV. For cavities, the PTV was defined as a 1.5mm expansion on the clinical target volume as described in greater detail previously.2
The HF‐SRT dose was 24–30Gy in 3–5 fractions as a covering isodose to the PTV, according to prescribing physician discretion. All plans were created on Pinnacle^3^ (Philips Healthcare, Fitchburg, WI) and calculated on a 2mm dose grid with a 6MV VMAT technique. The collapsed‐cone convolution algorithm was used for heterogeneous dose calculations, and all plans used flattened beams. Dose‐controlling regions of interest (ROIs) including ring structures were used to drive optimization. Typical ROIs generated to optimize the plan included those related to the target volume to meet minimum dose requirements, rings around or at a distance from the edge of target volumes to conform high‐to‐intermediate doses and avoidance ROIs relating to organs at risk (OAR) or normal tissue. Low dose outside the normal tissue tolerance ROI was not routinely controlled. The approach to VMAT plan design and optimization was not standardized during the study period and therefore all plans were constructed according to the discretion of the dosimetrist involved.
Variable selection for model development of normal brain dose
2.2
Normal brain was defined as the entire organ as contoured on planning CT from vertex to foramen magnum, excluding the PTV. For each participant in the cohort, normal brain mean dose and the volume receiving 50% (V50%) and 25% (V25%) of the prescribed dose was recorded. Despite clinically relevant doses of V10 Gy and V12 Gy being reported for SRS6, 10, 20, there are no consistent dose‐volume thresholds reported for HFSRT.11, 21, 22, 23 Consequently, the choice of dose‐volume predictors of varying percentages was selected by the authors to allow different fractionation schedules to be compared appropriately and provide a range of low dose distributions. For each participant, over 60 patient‐specific, dosimetric and treatment technique variables were collected. A sample list of these variables can be seen in Table 1. Variable definitions can be found in supplementary materials with the full list of variables (data S1). This large number of variables was investigated to ensure no variables were excluded that may become significant in the modeling methods. A two‐phase statistical analysis was completed. The first stage involved an exploratory analysis, through univariate, bivariate and multivariate testing on IBM SPSS (Version 26). The second stage involved using MLR to model the relationship between the continuous outcomes and explanatory variables determined from the first stage. PTV shape and PTV location were dichotomized into clinically meaningful and simplified groups; spherical versus irregular and superficial versus deep, respectively. Method for categorizing these variables are demonstrated in Figures 1 and 2. Arc combinations considered the treatment couch floor angles and sweep of arc directions and were combined into five clinically meaningful groups for analysis (Figure 3). A competing OAR was defined as any abutting or overlapping with the PTV ROI, including any Planning Organ at Risk Volumes (PRV) which is a small 1.5mm margin added to the OAR to account for organ motion and setup inaccuracies.24 No cost functions or plan optimization variables were collected as this often involves multiple iterations with varying workflows and depends on prioritization of clinical risk endpoints. Due to the retrospective nature of this study, assumptions could only be made regarding the iterative clinical decision‐making processes used when determining cost functions and planning system tools.
PTV shape; spherical (left) and irregular (right). PTV shape was determined by placing a POI in the epicentre of the PTV and expanded to the closest diameter to visually determine shape.
PTV location. Superficial (left) and deep (right). PTV location was determined by creating a Brain‐1.5cm ROI (red contour on the example on the left and and blue contour on the example on the right) and using a POI in the epicentre of the PTV to determine if the point fell within or outside this ROI.
Combinations of different arc sweeps and floor angles. Arc combinations 1–5 from top to bottom.
Statistical analyses
2.3
Descriptive statistics and bivariate tests were completed on IBM SPSS Statistics (Version 26). Normality of continuous data was assessed using the Shapiro‐Wilk test. Parametric and non‐parametric tests were used to assess for correlations between the collected fixed and modifiable variables and the three outcomes of normal brain mean dose, V50% and V25% of the prescribed dose (data S2).
Specific statistical tests were selected based on variable type and distribution to ensure appropriate analysis. Pearson's correlation was used for normally distributed continuous variables, such as PTV volume and total arc length, and Spearman's correlation for non‐parametric continuous data. Independent t‐tests were applied to compare parametric two‐group categorical variables, while Mann–Whitney U tests were used for non‐parametric two‐group comparisons, including variables such as tumor shape and the presence of a competing OAR. Comparisons involving three or more groups, such as different arc‐combination or floor‐angle categories, were performed using ANOVA for parametric data or the Kruskal–Wallis test for non‐parametric data. Only the final statistical outputs are presented, as intermediate screening steps did not alter variable inclusion. Variables with p < 0.15 were selected to be included in the MLR. This p value was selected to ensure an adequate number of variables were investigated.
Model development
2.4
The General Linear Model function in SPSS was used to create the MLR models. A manual backward stepwise approach was employed to select variables in the final model. The nine most significant variables with the outcome of normal brain mean in Gy were included in the model development as this is a primary planning goal. These nine variables were selected out of the 60 based on the exploratory analysis and the parametric and non‐parametric bivariate testing results of p < 0.15. Initially, all nine variables were included and then eliminated one‐by‐one after each model iteration. A variable was eliminated when it had the largest p value that was not significant (p > 0.05). The adjusted R^2^ was also analyzed after each model iteration (see data S3). The adjusted R ^2^ represents the variation in the observed outcome that is explained by the model, ranging from 0 to 1. Generally, a higher value indicates a better fit of the model however this is a caveat as the adjusted R ^2^ will increase with an increasing number of explanatory variables. Therefore, it is important the parsimony principle is employed, ensuring a balance of the adjusted R ^2^ and explanatory variables so the best fitted model is selected.25
The Akaike Information Criterion (AIC) is another statistical value to assist in determining how well the model fits and was generated in the R statistical software (https://www.r‐project.org/) using the lm and AIC function. The AIC is insignificant on its own but can be used to compare models with the same outcomes.26 The lower the AIC means the fit of the model is improving which was the method employed to evaluate model performance. The standardized coefficients for each model were also generated using the lm.beta function to identify which variables have the most influence.
All model assumptions regarding independent variables, linearity, equal variances, normally distributed residuals, and multi‐collinearity were checked.
RESULTS
3
Study cohort
3.1
There were 90 patients with a single BM or cavity receiving VMAT HF‐SRT included in the modeling. Mean brain volume was 1432.5 cm^3^ (range 1077.4‐1875.8, SD ± 163). Mean PTV volume was 30.3 cm^3^ (range 1.4‐174, SD ± 26.8). The prescribed doses were 24 Gy in 3 fractions (21%), 25 Gy in 5 fractions (21%), 27.5 Gy in 5 fractions 47%) and 30 Gy in 5 fractions (11%). The average normal brain mean dose was 2.5 Gy (range 0.6‐5.2, SD ± 1.0). The average normal brain V50% was 40.7 cm^3^ (range 5.9‐111.6, ± SD 21.4) and V25% was 127.5 cm^3^ (Range 16–365.6, SD ± 67.7), respectively. Additional details pertaining to technical variables for HF‐SRT in the cohort are shown in Table 2.
Variable selection for model development
3.2
The nine most significant variables from the bivariate testing (p < 0.15) with the outcome of normal brain mean in Gy included in MLR model development are shown in Table 3. Six of the variables were also significant for V50% and V25% with some interchange for the remaining three variables.
The fitted models
3.3
The final models included three or four variables: PTV volume, PTV location, PTV shape and arc combinations. The p‐values of these variables from the MLR modeling can be seen in Table 4 for all three models.
The fitted models are presented below. Coding outputs relevant to the models are shown in Table 5.
Normal brain mean
3.3.1
Volume of normal brain receiving 50% of the prescribed dose
3.3.2
Volume of normal brain receiving 25% of the prescribed dose
3.3.3
Model evaluation
3.4
All three of the models were significant (p < 0.001). The Adjusted R^2^ for the normal brain in mean model (Equation 1) was 0.686, meaning 68.6% of the variation in normal brain mean is explained by the model. This model had an AIC value of −105.8. The Adjusted R^2^ for the V50% model (Equation 2) was 0.783, meaning 78.3% of the variation in volume of normal brain receiving 50% of the prescribed dose is explained by the model. This model had an AIC value of 421.4. Lastly, the Adjusted *R^2^
- for the V25% model (Equation 3) was 0.731. So, 73.1% of the variation in volume of normal brain receiving 25% of the prescribed dose is explained by the model. This model had an AIC value of 648.9. All MLR model assumptions for each model were met. The variables and their standardized coefficients from most influential to least influential for the three models can be seen in Table 6. PTV volume and superficial location of PTV are the two most influential variables in all three models.
When analyzing the regression fits of the three models with PTV volume, a strong positive correlation can be seen as displayed in Figures 4, 5 and 6. Unsurprisingly, increases in PTV volume were associated with higher mean normal brain dose as well as larger V50% and V25% normal brain volumes.
Regression fit of normal brain mean (Gy) by PTV volume (cm3).
Regression fit of V50% normal brain (cm3) by PTV volume (cm3).
Regression fit of V25% normal brain (cm3) by PTV volume (cm3).
DISCUSSION
4
This study aimed to investigate both fixed and modifiable variables on low dose distribution to normal brain for patients receiving VMAT HF‐SRT, and then create predictive models for three dose metrics of mean dose, V50% and V25%. The models presented explain a good range of the observed variation in the outcome, between 68.6% to 78.3% with all models being significant (p < 0.001). The remaining unexplained variation may reflect the influence of outliers, planning cost functions not captured in this study, and other variables such as proximity of the PTV to competing OARs. While these latter factors did not demonstrate significance within the current dataset, they may become more apparent in larger cohorts and warrant further investigation.
As there is limited literature on using MLR for predictive modeling in radiation therapy, it is difficult to provide context on how well these models perform. However, one study by Gui et al.,27, 28 included two models which predict changes in measures of verbal memory and changes in whole brain volume at 6 months after whole brain radiation therapy. The model predicting change in verbal memory produced an adjusted R^2^ value of 0.35 and the other model predicting change in whole brain volume produced an R ^2^ value of 0.34. Whilst the study only chose to use two explanatory variables, these adjusted R ^2^ values are much lower than the ones reported in this research of 0.68, 0.72, and 0.78. It is anticipated that the models will identify a dose which the radiation therapist (RT) planners and radiation oncologist's (ROs) can use as a guide to what may be as low as reasonably achievable. For the RT, this saves time in the planning phase knowing when to stop optimizing the plan and for the ROs, the model outcomes can give an indication that low doses to the normal brain might not be improved further. A follow up study validating the models and the clinical implementation framework is currently being finalized. The anticipated clinical benefits of using the models may potentially reduce negative neurocognitive effects caused by radiation to healthy brain tissue.
The models contain three or four fixed and modifiable variables that predict low dose to normal brain; PTV volume, PTV shape, PTV location, and arc combinations. When analyzing the standardized coefficients for each of the variables in the model, PTV volume is by far the most influential variable in all three models (Table 6). For normal brain mean dose, V50% and V25%, the standardized coefficients were 0.65, 0.76, and 0.74, respectively. This suggests PTV volume has the largest impact on low dose which is consistent with the recent findings of Tavakoli et al.19 where PTV volume emerged as the strongest predictor of low dose. This finding highlights the importance of reducing PTV margins where possible, considering dose to normal brain within and beyond the target volume.
Although PTV volume emerged as the most influential predictor based on its standardized coefficient, the residual analysis displayed in Figure 7 indicates that it does not introduce systematic bias. The residuals plotted against PTV volume show no systematic trend, with errors distributed evenly across the full volume range. While greater variability is noted at larger PTV's, the absence of directional deviation from the zero‐error line supports the assumption of homoscedasticity. Thereby, reinforcing the model's robustness across varying target sizes.
Normal brain mean model error (Gy) by PTV volume (cm3).
The choice of mean brain dose, V50%, and V25% to reflect low dose in the brain may need to be revisited in the future as more evidence on the relationship between these metrics and patient outcomes become available. However, they were selected for this study as mean brain dose is a primary planning goal in HF‐SRT and the V50% and V25% are indicative of lower doses which allow different dose fractionations to be compared appropriately. Ruschin et al.,17 recorded mean dose to normal brain for intact lesions receiving 30 Gy in five fractions of 2.9 Gy (ranging from 1.0–8.4) and for cavities 3.4 Gy (ranging from 1.5–6.5). The mean dose to normal brain for intact lesions receiving 27.5 Gy in 5 fractions was 3.8 Gy (ranging from 1.1‐8.6) and for cavities was 5 Gy (ranging from 2.0–7.1). Lastly, for intact lesions for 25 Gy in 5 fractions the mean dose was 3.2 Gy (ranging from 1.1–7.2) and for cavities 3.9 Gy (ranging from 1.0‐6.5). Ruschin et al.,17 defined normal brain as the volume of the whole brain tissue minus all CTVs. The study also included multiple BM which resulted in larger mean doses. This makes it challenging to compare findings with this research. In a subsequent paper, Ruschin et al.,18 provided a framework for differing volumes of normal brain receiving percentages of the prescribed dose down to 50%. They included V50% as this represents a clinically relevant lower limit to compare dose falloff which consequently was a consideration in selecting V50% as one of the modeling outcomes in the current study.18, 29 50% dose clouds have also been used in another study as an intermediate dosimetric quantity.19
A strength of the current study is the range of variability within the model training cohort, thus improving generalizability. For example, the PTV volumes in this study range from 1.4 cm^3^ to 174 cm^3^ with the mean volume being 30.3 cm^3^ (SD ± 26.8). This suggests the model would be most accurate for the cases where the PTV volume ranges from 3.5 cm^3^ to 57.0 cm^3^ and may potentially over‐ or underestimate outside this. Nonetheless, this provides reassurance the models will be mostly accurate for this range of PTV volumes.
As mentioned above, a possible limitation is the choice of modelled outcomes because there is limited information on which subunits or dose‐volume combinations are best to measure for HF‐SRT from the literature. A further challenge is the categorization of some of the modifiable variables which may be oversimplified and therefore not provide a true representation of their influence on low dose distribution in the brain. Additionally, the low numbers in some categories will reduce power to identify a true statistically significant correlation. Validation on an external data to confirm model accuracy in a different treatment planning system with different beam models and new clinicians prescribing potentially different doses would be helpful.
CONCLUSION
5
This study has produced three predictive models which estimate an achievable amount of low dose to normal brain tissue for single BM VMAT HF‐SRT 6MV plans. The models include three or four statistically significant variables of: PTV volume, PTV location, PTV shape and arc combinations. This is one of the first studies to investigate both fixed and modifiable variables on low dose distribution.
AUTHOR CONTRIBUTION
Erin Johns conceived and designed the research and wrote the manuscript. Anne Bernard assisted Erin Johns with statistical analysis. Mark B Pinkham, Tamara J Barry, Lisa Nissen, and Catriona Hargrave provided critical feedback on the manuscript. All authors reviewed and approved the final version.
ETHICAL STATEMENT
Ethical and governance approvals were granted prior to commencement of this single center study (HREC/2022/QMS/76766).
CONFLICT OF INTEREST STATEMENT
The authors have no relevant conflicts of interest to disclose.
Supporting information
Supporting Information
The reference list from the paper itself. Each links out to its DOI / PubMed record.
- 1Andrews DW , Scott CB , Sperduto PW , et al. Whole brain radiation therapy with or without stereotactic radiosurgery boost for patients with one to three brain metastases: phase III results of the RTOG 9508 randomised trial. Lancet. 2004;363(9422):1665‐1672. doi:10.1016/S 0140‐6736(04)16250‐8 15158627 10.1016/S 0140-6736(04)16250-8 · doi ↗ · pubmed ↗
- 2Garimall S , Shanker M , Johns E , et al. Evidence of dose‐response following hypofractionated stereotactic radiotherapy to the cavity after surgery for brain metastases. J Neuro‐oncol. 2020;146(2):357‐362. doi:10.1007/s 11060‐019‐03383‐w 10.1007/s 11060-019-03383-w 31907796 · doi ↗ · pubmed ↗
- 3Loo M , Clavier J‐B , Khalifa JA , Moyal E , Khalifa J . Dose‐response effect and dose‐toxicity on stereotactic radiotherapy for brain metastases: a review. Cancers. 2021;13(23):6086. doi:10.3390/cancers 13236086 34885193 10.3390/cancers 13236086 PMC 8657210 · doi ↗ · pubmed ↗
- 4Kocher M , Soffietti R , Abacioglu U , et al. Adjuvant whole‐brain radiotherapy versus observation after radiosurgery or surgical resection of one to three cerebral metastases: results of the EORTC 22952–26001 study. J Clin Oncol. 2011;29(2):134‐41. doi:10.1200/JCO.2010.30.1655 21041710 10.1200/JCO.2010.30.1655 PMC 3058272 · doi ↗ · pubmed ↗
- 5Mahajan A , Ahmed S , Mc Aleer MF , et al. Post‐operative stereotactic radiosurgery versus observation for completely resected brain metastases: a single‐centre, randomised, controlled, phase 3 trial. Lancet Oncol. 2017;18(8):1040‐1048. doi:10.1016/S 1470‐2045(17)30414‐X 28687375 10.1016/S 1470-2045(17)30414-XPMC 5560102 · doi ↗ · pubmed ↗
- 6Minniti G , Scaringi C , Paolini S , et al. Single‐fraction versus multifraction (3 × 9 Gy) stereotactic radiosurgery for large (>2 cm) brain metastases: a comparative analysis of local control and risk of radiation‐induced brain necrosis. Int J Radiat Oncol Biol Phys. 2016;95(4):1142‐1148. doi:10.1016/j.ijrobp.2016.03.013 27209508 10.1016/j.ijrobp.2016.03.013 · doi ↗ · pubmed ↗
- 7Pinkham MB , Whitfield GA , Brada M . New developments in intracranial stereotactic radiotherapy for metastases. Clin Oncol (R Coll Radiol). 2015;27(5):316‐23. doi:10.1016/j.clon.2015.01.007 25662094 10.1016/j.clon.2015.01.007 · doi ↗ · pubmed ↗
- 8Brun L , Dupic G , Chassin V , et al. Hypofractionated stereotactic radiotherapy for large brain metastases: optimizing the dosimetric parameters. Cancer Radiother. 2021;25(1):1‐7. doi:10.1016/j.canrad.2020.04.011 33257109 10.1016/j.canrad.2020.04.011 · doi ↗ · pubmed ↗