Contribution of a Novel TetR/AcrR Family Transcriptional Regulator RalT of Ralstonia pseudosolanacearum Strain OE1‐1 to the Fine‐Tuning of Its Virulence
Tatsuya Ueyama, Masayuki Tsuzuki, Sora Tateda, Yuki Terazawa, Aoi Ikeuchi, Akinori Kiba, Kouhei Ohnishi, Yasufumi Hikichi

TL;DR
The study identifies a new regulator, RalT, that fine-tunes the virulence of a plant pathogen by controlling gene expression related to quorum sensing and ralfuranone.
Contribution
Discovery of RalT, a TetR/AcrR family regulator, as a key player in fine-tuning virulence gene regulation in Ralstonia pseudosolanacearum.
Findings
RalT negatively regulates ralT and QS/Ral-dependent genes like ralA and xpsR.
Deletion of ralT increases EPS I production and enhances virulence in the pathogen.
Ralfuranone biosynthesis genes are regulated via positive feedback through RalT.
Abstract
During the quorum‐sensing (QS)‐active state, the Gram‐negative phytopathogenic Ralstonia pseudosolanacearum strain OE1‐1 activates the transcriptional regulator PhcA, regulating the QS‐dependent genes including ralfuranone production‐related genes such as ralA and major exopolysaccharide EPS I production‐related genes such as xpsR encoding the transcriptional regulator XpsR, which are responsible for OE1‐1 virulence. Ralfuranone affects the regulation of more than 80% (QS/Ral‐dependent genes) of QS‐dependent genes, indicating the ralfuranone‐mediated feedback regulation of QS. To elucidate the mechanisms underlying the regulation of QS/Ral‐dependent genes, we analyzed the transcriptomes of phcA‐deletion (ΔphcA) and ralfuranone‐deficient (ΔralA) mutants, as well as strain OE1‐1 by RNA‐sequencing. We found a novel TetR/AcrR family transcriptional regulator (RalT)‐encoding gene (ralT); the…
Genes, proteins, chemicals, diseases, species, mutations and cell lines named across the full text — each resolved to its canonical identifier and authoritative record.
Click any figure to enlarge with its caption.
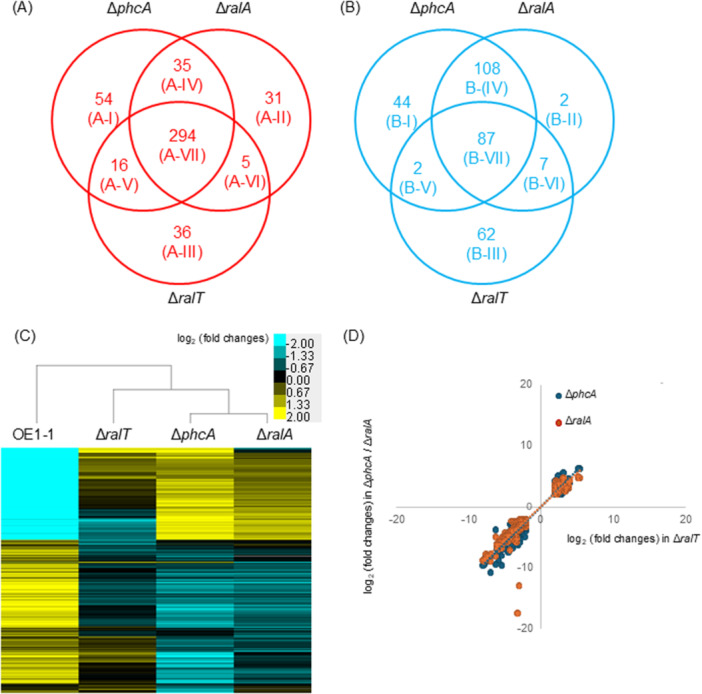 Figure 1
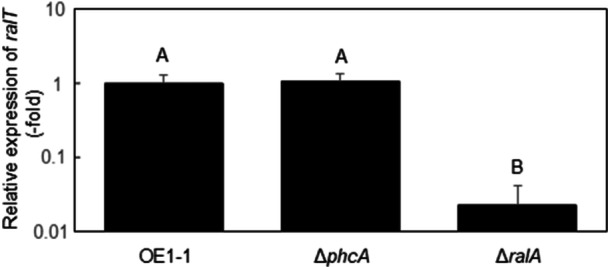 Figure 2
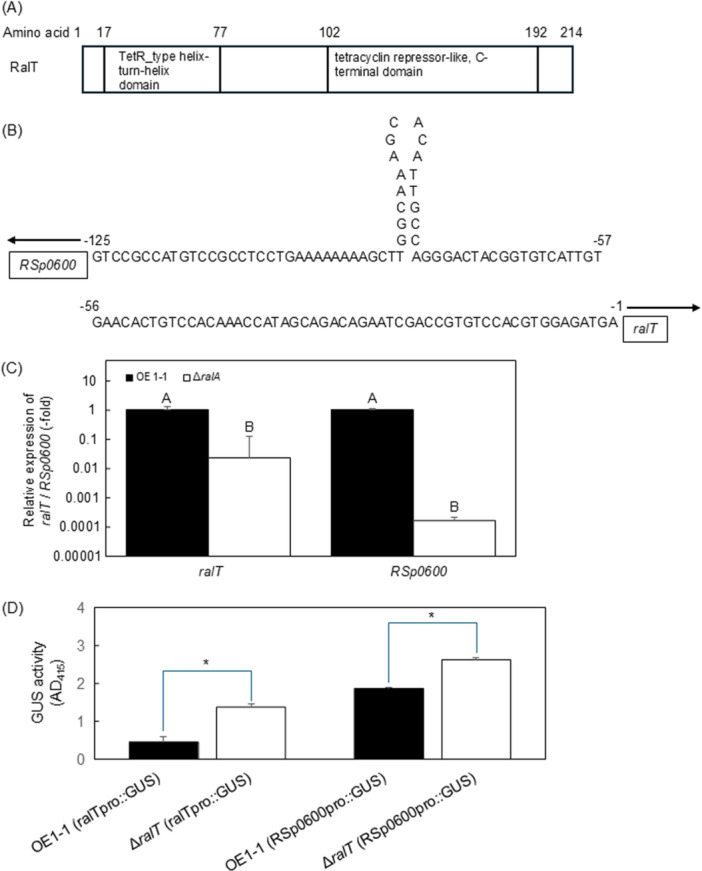 Figure 3
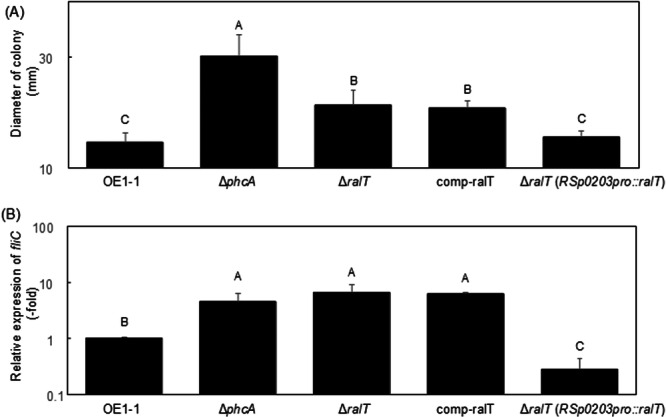 Figure 4
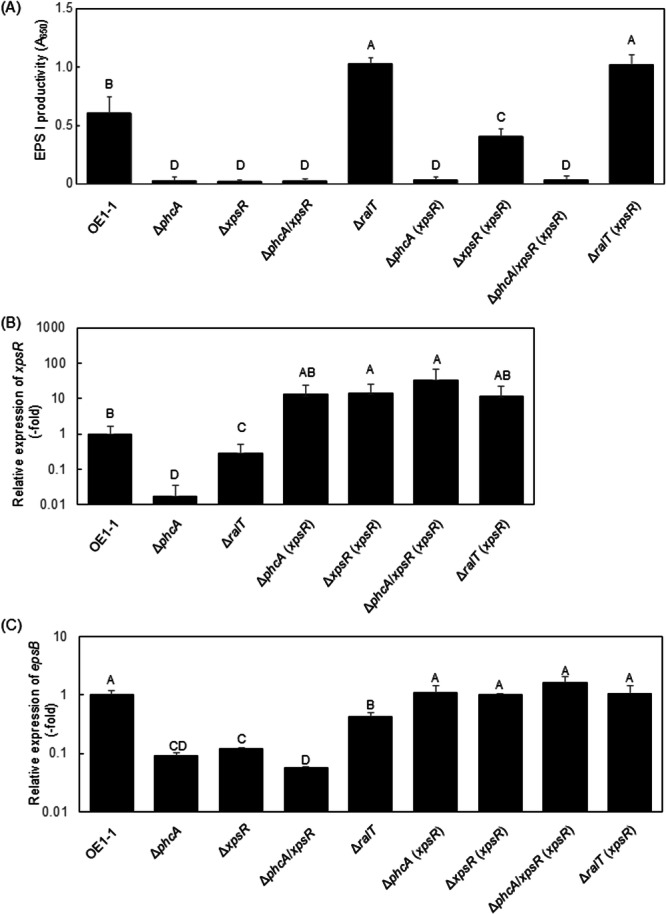 Figure 5
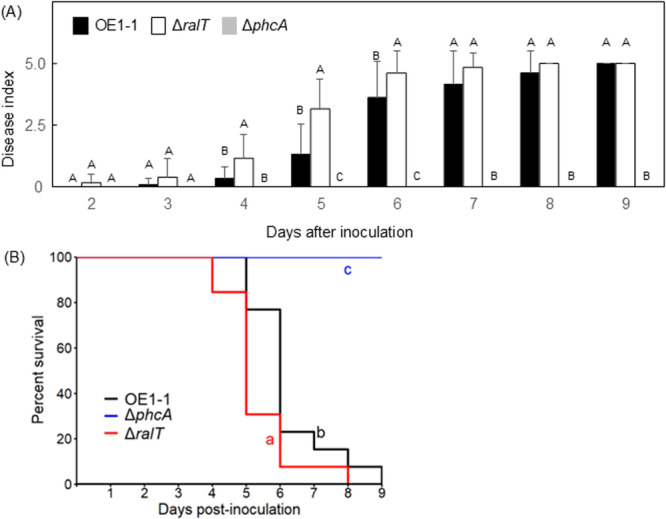 Figure 6
| Relevant characteristics | Source | |
|---|---|---|
| Plasmids | ||
| pUC118 | Ampr | Takara Bio |
| pHM1 | Spr, | Innes et al. ( |
| pHM1‐GUS | pHM1 derivative carrying a gus gene | Ikawa and Tsuge ( |
| pralTproGUS | pHM1 derivative carrying 2.7‐kbp DNA fragment including the | This study |
| pRSp0600proGUS | pHM1 derivative carrying 2.1‐kbp DNA fragment including the | This study |
| pK18mobsacB | Kmr, | Kvitko and Collmer ( |
| pdeltaralT | pK18mobsacB derivative carrying 1.6‐kbp DNA fragment for | This study |
| pUC18‐mini‐Tn | Gmr | Choi et al. ( |
| pTNS2 | helper plasmid carrying T7 transposase gene | Choi et al. ( |
| pralT | pUC18‐mini‐Tn | This study |
| pRSp0203proralT | pUC18‐mini‐Tn | This study |
| pdelta‐xpsR | pK18mobsacB derivative carrying 1.3‐kbp DNA fragment for | This study |
| pRSc0900proxpsR | pUC18‐mini‐Tn | This study |
|
| ||
| DH5α |
| Takara Bio |
|
| ||
| OE1‐1 | Wild‐type strain, phylotype I, race 1, biovar 4, | Kanda et al. ( |
| Δ |
| Mori et al. ( |
| Δ |
| Kai et al. ( |
| Δ | RSp0599‐deletion mutant of OE1‐1 | This study |
| comp‐ralT | A transformant of Δ | This study |
| Δ | A transformant of Δ | This study |
| OE1‐1 ( | A transformant of OE1‐1 with pralTproGUS, Spr | This study |
| Δ | A transformant of Δ | This study |
| OE1‐1 ( | A transformant of OE1‐1 with pRSp0600proGUS, Spr | This study |
| Δ | A transformant of Δ | This study |
| Δ |
| This study |
| Δ |
| This study |
| Δ | A transformant of Δ | This study |
| Δ | A transformant of Δ | This study |
| Δ | A transformant of Δ | This study |
| Δ | A transformant of Δ | This study |
| Plasmid | Primers | Nucleotide sequences |
|---|---|---|
| pdeltaralT | RSp0599‐1FW | 5ʹ‐CGgaattcTTGTAGCGCATCAGCCTGTC‐3ʹ |
| RSp0599‐1RV | 5ʹ‐GATCCAGCTATAGCATGTCATCTCCACGTGGACAC‐3ʹ | |
| RSp0599‐2FW | 5ʹ‐GGAGATGACATGCTATAGCTGGATCGCCGGC‐3ʹ | |
| RSp0599‐2RV | 5ʹ‐CGggatccGCTTTGCGGTGGAAGAGGTG‐3ʹ | |
| pralT | RSp0599pro‐FW | 5ʹ‐GTtctagaGCTCGGGAACCGGCATCGGCA‐3ʹ |
| RSp0599pro‐RV | 5ʹ‐GTTgagctcCTATAGGCCGTTCTCCACCA‐3ʹ | |
| pRSp0203proralT | RSp0203‐1FW | 5ʹ‐GTTctgcagGAGAACGGGCATGAGTGACC‐3ʹ |
| RSp0203‐1RV | 5ʹ‐GCTGGGTCATTCTGCCTGAAAGCTGCTGCG‐3ʹ | |
| RSp0203‐2FW | 5ʹ‐TTCAGGCAGAATGACCCAGCAGCACGCCC‐3ʹ | |
| RSp0203‐2RV | 5ʹ‐GTTgagctcCTATAGGCCGTTCTCCACCA‐3ʹ | |
| pralTproGUS | RSp0599pro‐FW | 5ʹ‐GTTctgcagGGCGCCGGCATGCTCGG‐3ʹ |
| RSp0599pro‐RV | 5ʹ‐GTTggtaccCAGGGCAATGCCCGGCATC‐3ʹ | |
| pRSp0600proGUS | RSp0600pro‐FW | 5ʹ‐GTTctgcag |
| RSp0600pro‐RV | 5ʹ‐GTTggtacc | |
| pdelta‐xpsR | xpsR‐1FW | 5ʹ‐CGCggtaccTGCCGAATCAATCAAACCGAGAG‐3ʹ |
| xpsR‐1RV | 5ʹ‐CTTGCTGAGTCACATTTCGGTAATTTCCCTCCGG‐3ʹ | |
| xpsR‐2FW | 5ʹ‐GAATTACCGAAATGTGACTCAGCAAGATGCCGG‐3ʹ | |
| xpsR‐2RV | 5ʹ‐CCCaagcttGCATGACCACGGCGTTC‐3ʹ | |
| pRSc0900proxpsR | pUCxpsR ‐1FW | 5ʹ‐GGggtaccAGATGCCGTAGATGATGCC‐3ʹ |
| pUCxpsR ‐1RV | 5ʹ‐CTTCTGTTCCATATTTCTCCTCTCAGGATGAG‐3ʹ | |
| pUCxpsR ‐2FW | 5ʹ‐GAGAGGAGAAATATGGAACAGAAGCTCATCTTCTC‐3ʹ | |
| pUCxpsR ‐2RV | 5ʹ‐CCCaagcttCGGTTTAGTTGA ATGTGGCTG‐3ʹ |
| Genes | Primers | Nucleotide sequences |
|---|---|---|
|
| rpoD‐FW | 5ʹ‐ATCGTCGAGCGCAACATCCC‐3ʹ |
| rpoD‐RV | 5ʹ‐AGATGGGAGTCGTCGTCGTCGTG‐3ʹ | |
|
| fliC‐RV2 | 5ʹ‐ATTGGAAGGTCGTCGAAGCCAC‐3ʹ |
| fliC‐FW2 | 5ʹ‐CAAACGCAAGGTATTCAGAACG‐3ʹ | |
|
| RSp0599‐qPCR‐FW | 5ʹ‐TTTGCGCAACAGGAGACC‐3ʹ |
| RSp0599‐qPCR‐RV | 5ʹ‐AGCAACTGGAACGGATTGAG‐3ʹ | |
|
| RSp0600‐RT‐FW43 | 5ʹ‐CGTGCGCTGATCCAGGAATG‐3ʹ |
| RSp0600‐RT‐RV209 | 5ʹ‐CGAACCAGTCCTGCCAGTTG‐3ʹ | |
|
| xpsR‐qPCR‐FW | 5ʹ‐TCTTCTCGCGCGAACA‐3ʹ |
| xpsR‐qPCR‐RV | 5ʹ‐AACCAGCGACTCTGTC‐3ʹ | |
|
| epsB‐FW | 5ʹ‐ATGGTCGAGCTGATGGATA‐3ʹ |
| epsB‐RV2 | 5ʹ‐TGGAGCTGCTTGATCGTCTC‐3ʹ |
| Cluster | GO term |
| Fold enrichment | numDEInCat |
|---|---|---|---|---|
| A‐II | phenylacetate catabolic process | 2.82E‐06 | 59.8202765 | 3 |
| maltose alpha‐D‐glucosyltransferase activity | 0.00287586 | 139.5806452 | 1 | |
| phenylacetyl‐CoA 1,2‐epoxidase activity | 0.0038603 | 139.5806452 | 1 | |
| A‐III | histidine catabolic process to glutamate and formamide | 0.00031422 | 60.09722222 | 2 |
| histidine catabolic process to glutamate and formate | 0.00031422 | 60.09722222 | 2 | |
| propionate catabolic process, 2‐methylcitrate cycle | 0.00052095 | 48.07777778 | 2 | |
| allantoin metabolic process | 0.00621749 | 120.1944444 | 1 | |
| urate catabolic process | 0.00621749 | 120.1944444 | 1 | |
| 2‐oxo‐4‐hydroxy‐4‐carboxy‐5‐ureidoimidazoline decarboxylase activity | 0.00621749 | 120.1944444 | 1 | |
| ribokinase activity | 0.00681115 | 120.1944444 | 1 | |
| D‐ribose catabolic process | 0.00681115 | 120.1944444 | 1 | |
| 1‐phosphofructokinase activity | 0.00681533 | 120.1944444 | 1 | |
| formimidoylglutamase activity | 0.00685296 | 120.1944444 | 1 | |
| xylan catabolic process | 0.0068655 | 120.1944444 | 1 | |
| metal ion binding | 0.00690893 | 2.907930108 | 6 | |
| ethylene biosynthetic process | 0.00693655 | 120.1944444 | 1 | |
| 2‐oxoglutarate oxygenase/decarboxylase (ethylene‐forming) activity | 0.00693655 | 120.1944444 | 1 | |
| fumarylacetoacetase activity | 0.00726208 | 120.1944444 | 1 | |
| acetaldehyde dehydrogenase (acetylating) activity | 0.00760752 | 120.1944444 | 1 | |
| catalase activity | 0.00761999 | 120.1944444 | 1 | |
| hydrogen peroxide catabolic process | 0.00761999 | 120.1944444 | 1 | |
| urocanate hydratase activity | 0.00800165 | 120.1944444 | 1 | |
| A‐IV | D‐xylose transmembrane transport | 0.00496513 | 123.6285714 | 1 |
| monosaccharide binding | 0.00496513 | 123.6285714 | 1 | |
| 4‐hydroxybutyrate dehydrogenase activity | 0.00990697 | 61.81428571 | 1 | |
| mannose‐6‐phosphate isomerase activity | 0.00990827 | 61.81428571 | 1 | |
| A‐VI | citrate synthase activity | 0.00145618 | 865.4 | 1 |
| propionate metabolic process, methylcitrate cycle | 0.00486466 | 432.7 | 1 | |
| ATPase‐coupled cation transmembrane transporter activity | 0.00840014 | 288.4666667 | 1 | |
| A‐VII | lipopolysaccharide biosynthetic process | 0.00012595 | 9.811791383 | 4 |
| integral component of membrane | 0.00033515 | 1.130009682 | 82 | |
| oxidoreductase activity | 0.00153168 | 1.925678683 | 14 | |
| acylphosphatase activity | 0.00259002 | 14.71768707 | 2 | |
| polysaccharide transport | 0.00317369 | 14.71768707 | 2 | |
| cellulose catabolic process | 0.00370254 | 14.71768707 | 2 | |
| tRNA aminoacylation for protein translation | 0.00374334 | 14.71768707 | 2 | |
| extracellular space | 0.00409855 | 14.71768707 | 2 | |
| heme binding | 0.00633789 | 2.354829932 | 8 | |
| quorum sensing | 0.00750931 | 9.811791383 | 2 | |
| A‐VII | organonitrogen compound biosynthetic process | 0.0079367 | 9.811791383 | 4 |
| Cluster | GO term |
| Fold enrichment | numDEInCat |
|---|---|---|---|---|
| B‐I | structural constituent of ribosome | 0 | 23.24421488 | 13 |
| translation | 0 | 20.29256854 | 13 | |
| ribosome | 2.71E‐11 | 21.07305195 | 9 | |
| rRNA binding | 3.18E‐05 | 12.60780886 | 5 | |
| large ribosomal subunit rRNA binding | 7.32E‐05 | 98.34090909 | 2 | |
| succinate‐CoA ligase (ADP‐forming) activity | 7.82E‐05 | 98.34090909 | 2 | |
| regulation of translation | 0.00043465 | 49.17045455 | 2 | |
| tRNA binding | 0.00054648 | 13.56426332 | 4 | |
| small ribosomal subunit | 0.00107487 | 32.78030303 | 2 | |
| nitrate metabolic process | 0.00109517 | 98.34090909 | 2 | |
| nitrate reductase complex | 0.00184183 | 65.56060606 | 2 | |
| large ribosomal subunit | 0.0019857 | 24.58522727 | 2 | |
| transmembrane signaling receptor activity | 0.00205597 | 15.52751196 | 3 | |
| translation elongation factor activity | 0.00272986 | 32.78030303 | 2 | |
| RNA helicase activity | 0.0045057 | 39.33636364 | 2 | |
| nitrate reductase activity | 0.00535516 | 39.33636364 | 2 | |
| ATP‐dependent activity, acting on DNA | 0.00558897 | 28.0974026 | 2 | |
| signal transduction | 0.00702577 | 11.34702797 | 3 | |
| methylenetetrahydrofolate reductase NADH activity | 0.00869301 | 98.34090909 | 1 | |
| methylenetetrahydrofolate reductase NADPH activity | 0.00869301 | 98.34090909 | 1 | |
| NADH dehydrogenase activity | 0.00984111 | 98.34090909 | 1 | |
| NADH oxidation | 0.00984111 | 98.34090909 | 1 | |
| B‐III | viral capsid assembly | 1.05E‐06 | 69.79032258 | 3 |
| inorganic phosphate transmembrane transporter activity | 1.44E‐06 | 52.34274194 | 3 | |
| phosphate ion transmembrane transport | 0.00014358 | 46.52688172 | 2 | |
| site‐specific DNA‐methyltransferase (cytosine‐N4‐specific) activity | 0.00686045 | 69.79032258 | 1 | |
| ATPase‐coupled phosphate ion transmembrane transporter activity | 0.00807828 | 69.79032258 | 1 | |
| B‐IV | structural constituent of ribosome | 0 | 10.92676768 | 15 |
| translation | 0 | 9.539241623 | 15 | |
| rRNA binding | 0 | 12.32763533 | 12 | |
| ribosome | 3.73E‐09 | 8.58531746 | 9 | |
| protein secretion by the type III secretion system | 1.10E‐08 | 33.38734568 | 5 | |
| modulation by symbiont of host defense‐related programmed cell death | 1.93E‐08 | 33.38734568 | 5 | |
| large ribosomal subunit | 2.21E‐06 | 20.03240741 | 4 | |
| signal transduction | 0.00044029 | 7.70477208 | 5 | |
| extracellular region | 0.00053432 | 10.0162037 | 4 | |
| protein secretion | 0.00103767 | 7.284511785 | 4 | |
| transmembrane signaling receptor activity | 0.00127946 | 8.434697856 | 4 | |
| type III protein secretion system complex | 0.00149349 | 26.70987654 | 2 | |
| small ribosomal subunit | 0.00271095 | 13.35493827 | 2 | |
| cytochrome bo3 ubiquinol oxidase activity | 0.00281254 | 13.35493827 | 2 | |
| chemotaxis | 0.006475 | 4.85634119 | 4 | |
| protein targeting | 0.00984047 | 10.0162037 | 2 | |
| B‐V | chemotaxis | 0.00878679 | 65.56060606 | 1 |
| B‐VI | siderophore uptake transmembrane transporter activity | 0.00577146 | 88.30612245 | 1 |
| signaling receptor activity | 0.00577146 | 88.30612245 | 1 | |
| B‐VII | cytoskeletal motor activity | 0 | 49.73563218 | 8 |
| bacterial‐type flagellum basal body | 0 | 44.76206897 | 9 | |
| bacterial‐type flagellum‐dependent cell motility | 0 | 49.73563218 | 16 | |
| chemotaxis | 2.16E‐14 | 21.09996517 | 14 | |
| structural molecule activity | 3.74E‐08 | 41.44636015 | 5 | |
| bacterial‐type flagellum organization | 6.84E‐08 | 35.52545156 | 5 | |
| bacterial‐type flagellum assembly | 1.13E‐07 | 24.86781609 | 6 | |
| bacterial‐type flagellum hook | 7.45E‐07 | 49.73563218 | 4 | |
| siderophore biosynthetic process | 8.16E‐07 | 49.73563218 | 4 | |
| bacterial‐type flagellum | 1.59E‐06 | 33.15708812 | 4 | |
| bacterial‐type flagellum basal body, rod | 6.02E‐06 | 49.73563218 | 3 | |
| extracellular region | 3.50E‐05 | 15.54238506 | 5 | |
| siderophore uptake transmembrane transporter activity | 4.90E‐05 | 28.42036125 | 4 | |
| signaling receptor activity | 4.90E‐05 | 28.42036125 | 4 | |
| signal transduction | 9.76E‐05 | 11.47745358 | 6 | |
| acid‐amino acid ligase activity | 0.00012612 | 37.30172414 | 3 | |
| protein‐glutamine glutaminase activity | 0.00038634 | 49.73563218 | 2 | |
| archaeal or bacterial‐type flagellum‐dependent cell motility | 0.00100179 | 33.15708812 | 2 | |
| protein secretion | 0.00192411 | 9.042842215 | 4 | |
| transmembrane signaling receptor activity | 0.00259412 | 10.47065941 | 4 | |
| plasma membrane | 0.00904467 | 2.103248127 | 17 |
- —SPS KAKENHI
- —Institute for Fermentation
- —Sasakawa Scientific Research Grants from the Japan Science Society
Peer Reviews
No public reviews on file for this paper yet. If you reviewed it on a platform where reviews are public (OpenReview, ICLR, NeurIPS, ICML), you can paste yours below so the community can read it here.
Videos
No videos yet. Explain this paper in a talk, walkthrough, or lecture? Add one.
Taxonomy
TopicsInfections and bacterial resistance · Plant Pathogenic Bacteria Studies · Bacterial biofilms and quorum sensing
Introduction
1
Quorum sensing (QS) is a process whereby bacteria secrete and sense small molecules (i.e., QS signals) that accumulate in the extracellular space, regulating bacterial gene expression in response to fluctuations in cell population density (Ham 2013; Papenfort and Bassler 2016; Rutherford and Bassler 2012). Bacteria thus sense QS signal concentrations via specialized receptors, enabling them to estimate bacterial concentrations. Upon reaching a threshold concentration, bacteria activate QS to synchronously control the expression of genes that facilitate their adaptation to environmental conditions as well as virulence (Moreno‐Gámez et al. 2023).
The soil‐borne Gram‐negative beta‐proteobacterium Ralstonia solanacearum species complex (RSSC; Remenant et al. 2010) is composed of four phylotypes (I–IV), with three distinct species: Ralstonia pseudosolanacearum (phylotypes I and III), R. solanacearum (phylotype II), and Ralstonia syzygii (phylotype IV) (Safni et al. 2014). Notably, RSSC causes a devastating bacterial wilt disease that decreases crop production worldwide (Mansfield et al. 2012). Each RSSC strain produces methyl 3‐hydroxymyristate (3‐OH MAME) or methyl 3‐hydroxypalmitate as a QS signal via a reaction catalyzed by the methyltransferase PhcB (Flavier et al. 1997; Kai 2023; Kai et al. 2015; Ujita et al. 2019).
A phylotype I strain of RSSC, R. pseudosolanacearum strain OE1‐1 first attaches to the surface of the epidermis in tomato seedling root elongation zones and then colonizes the cortex surface and activates QS (Inoue et al. 2023; Tsuzuki et al. 2023). During the QS‐activation state, RSSC strains produce plant cell wall‐degrading enzymes (PCWDEs), such as β‐1,4‐cellobiohydrolase (CbhA; Liu et al. 2005; Senuma et al. 2023), endoglucanase (Roberts et al. 1988), and pectin methylesterase (Tans‐Kersten et al. 1998), and secreted PCWDEs via the type II secretion machinery (Tsujimoto et al. 2008). Strain OE1‐1 degrades the cell wall of cortical cells adjacent to the epidermis using PCWDEs to infect the damaged cortical cells and forms mushroom‐shaped biofilms, leading to the subsequent infection of xylem vessels and virulence (Inoue et al. 2023; Tsuzuki et al. 2023). QS‐deficient mutants did not infect the cortical cells and lost their virulence (Inoue et al. 2023; Senuma et al. 2023; Terazawa et al. 2024; Takemura et al. 2023; Tsuzuki et al. 2023). Therefore, QS is required for the virulence of strain OE1‐1 during an infection of tomato roots.
Strain OE1‐1 produces 3‐OH MAME as a QS signal (Kai 2023; Kai et al. 2015; Ujita et al. 2019). It is thought that the sensor histidine kinase PhcS assisted by the histidine kinase VsrA contributes to sensing 3‐OH MAME, leading to the autophosphorylation of the histidine at amino acid position 230 of PhcS (H230‐PhcS; Senuma et al. 2024). The putative cognate response regulators to PhcS, PhcR, PhcQ, and ChpA are required for the gene regulation by the LysR family transcriptional regulator PhcA (Takemura et al. 2021, 2023). Furthermore, though the phosphorylated H230‐PhcS is required for the full expression of phcA along with the alternative sensor histidine kinase PhcK, independently of 3‐OH MAME sensing (Senuma et al. 2020, 2025).
In the QS‐active strain OE1‐1, the activated PhcA controls the expression of genes (hereafter referred to as QS‐dependent genes) responsible for QS‐dependent activities, including virulence (Hikichi et al. 2017). Especially, activated PhcA induces expression of the major exopolysaccharide EPS I production‐related genes such as xpsR and eps operon (Garg et al. 2000), lecM encoding a lectin LecM (Mori et al. 2016), and cbhA encoding a PCWDE, CbhA (Senuma et al. 2023). During the QS‐active state, strain OE1‐1 thus induces the production of virulence‐related EPS I, LecM, and CbhA (Tsuzuki et al. 2023). EPS I is involved in the regulatory effects of PhcA on expression of QS‐dependent genes (Hayashi et al. 2019b). LecM is speculated to locate in outer membranes (Carter et al. 2024; Meng et al. 2015) and exhibits mannose, fructose, fucose, galactose, and arabinose affinities (Sudakevitz et al. 2002, 2004). Furthermore. LecM influences the volume of extracellularly secreted 3‐OH MAME (Hayashi et al. 2019a) as well as the attachment to plant surfaces (Mori et al. 2016). CbhA contributes to the full phcA expression (Senuma et al. 2023) as well as the invasion of cortical cells by strain OE1‐1. It is thus thought that these virulence‐related compounds participate in the feedback regulation of QS, contributing to virulence of strain OE1‐1 (Tsuzuki et al. 2023).
RSSC synthesizes aryl‐furanone secondary metabolites known as ralfuranones A, B, I, J, K, and L, which are secreted extracellularly (Kai 2023; Kai et al. 2014, 2016; Pauly et al. 2013). Ralfuranone I is a precursor for other ralfuranones; ralfuranones A, B, I, J, K, and L are hereafter referred to as ralfuranone. The expression of ralA, which encodes a ralfuranone synthase involved in the biosynthesis of ralfuranone, is induced by activated PhcA (Kai et al. 2014, 2016; Schneider et al. 2009; Wackler et al. 2011). During the QS‐active state, strain OE1‐1 thus induces the production of ralfuranone, which contributes to the development of mushroom‐shaped biofilms (Mori et al. 2018a). In addition, ralfuranone productivity‐deficiency leads to a change in the regulation of more than 80% of QS‐dependent genes, independently of QS, suggesting that the ralfuranone‐mediated regulation modulates the regulatory effects of PhcA on the expression of these QS‐dependent genes (Hayashi et al. 2019b; Mori et al. 2018b). The evidence indicates that ralfuranone is also involved in the feedback regulation of QS (Mori et al. 2018b; Tsuzuki et al. 2023).
To elucidate the mechanisms underlying the ralfuranone‐mediated gene regulation in strain OE1‐1, we first analyze the transcriptomes of the ralfuranone‐deficient ralA‐deletion (ΔralA) and phcA‐deletion (ΔphcA) mutants conducting RNA‐sequencing (RNA‐seq) experiments. The generated data revealed that the expression of RSp0599 (hereafter designated as ralT) encoding a novel type I TetR family (TetR/AcrR family) transcriptional regulator RalT decreased significantly in ΔralA, but not in ΔphcA. We then generated a ralT‐deletion (ΔralT) mutant and analyzed the transcriptomes of R. pseudosolanacearum strains by RNA‐seq. Furthermore, we examined their virulence as well as QS‐dependent phenotypes.
Materials and Methods
2
Bacterial Strains and Growth Conditions
2.1
We used R. pseudosolanacearum strain OE1‐1 (Table 1; Kanda et al. 2003) as well as the ΔphcA (Table 1; Mori et al. 2016) and ΔralA (Kai et al. 2014) mutants of strain OE1‐1. All R. pseudosolanacearum strains were routinely grown in quarter‐strength M63 medium [4 mM (NH_4_)2_SO_4, 20 mM KH_2_PO_4_, 450 nM FeSO_4_·7H_2_O, 0.67 mM MgSO_4_, and 20 mM C_5_H_8_NO_4_Na·H_2_O] at 30°C. Escherichia coli strain DH5α (Table 1) and its transformants carrying recombinant plasmids (Table 1) were grown in Luria–Bertani medium (Hanahan 1983) at 37°C. The following antibiotics were used in selective media in the amounts indicated (μg/mL): gentamycin, 50; kanamycin, 50.
General DNA Manipulations
2.2
Ralstonia pseudosolanacearum was transformed by electroporation as described previously (Allen 1991). Double‐stranded DNA sequencing templates were pre‐pared with Fast GeneTM Plasmid miniprep kits (NIPPON Genetics, Tokyo, Japan) and sequences were determined using an Automated DNA Sequencer Model 373 (Applied Biosystems, Foster City, CA, USA). DNA sequence data were analyzed using the DNASYS‐Mac software (Hitachi Software Engineering, Yokohama, Japan). Enzymes, including restriction endonucleases (Takara, Ohtsu, Japan), were used according to the manufacturer's instructions.
Generation of ΔralT and ΔralT Transformants
2.3
To generate the ΔralT mutant (Table 1), we created a plasmid, pdeltaralT (Table 1), by inserting a recombinant fragment derived from a PCR amplification using specific primers (Table 2) into pK18mobsacB (Kvitko and Collmer 2011). Plasmid pdeltaralT was electroporated into strain OE1‐1 competent cells, which were prepared as previously described by Allen (1991). A kanamycin‐sensitive, sucrose‐resistant recombinant, ΔralT, was then selected.
To generate the comp‐ralT transformant containing the native ralT promoter region and open reading frame, we created a plasmid, pralT (Table 1), by inserting a recombinant fragment obtained by PCR using specific primers (Table 2) into pUC18‐mini‐Tn7T‐Gm (Table 1; Choi et al. 2005). This plasmid was electroporated into ΔralT cells along with the T7 transposase expression vector pTNS2 (Choi et al. 2005), after which a gentamycin‐resistant transformant, comp‐ralT, was selected.
To generate plasmid pRSp0203proralT, which includes the RSp0203 promoter fused to the ralT open reading frame, we completed a PCR amplification of a recombinant fragment using specific primers (Table 2) and ligated it into pUC18‐mini‐Tn7T‐Gm. We then electroporated pRSp0203proralT into ΔralT cells along with pTNS2, after which a gentamycin‐resistant transformant, ΔralT (RSp0203pro::ralT) was selected.
Assay of ralT and RSp0600 Promoter Activities
2.4
To analyze ralT and RSp0600 promoter activities, we first amplified DNA fragments comprising the ralT and RSp0600 promoter regions by PCR using specific primers (Table 2). The amplified fragments were digested with PstI (Takara, Ohtsu, Japan) and KpnI (Takara) and ligated into PstI‐ and KpnI‐digested pHM1‐GUS (Ikawa and Tsuge 2016) derived from pHM1 (Innes et al. 1988) to generate plasmids pralTproGUS and pRSp0600proGUS. The recombinant plasmids were electroporated into strain OE1‐1 and ΔralT competent cells. Spectinomycin‐resistant OE1‐1 (ralTpro::GUS) and ΔralT (ralTpro::GUS) as well as OE1‐1 (RSp0600pro::GUS) and ΔralT (RSp0600pro::GUS) were then selected.
We measured the GUS activity of R. pseudosolanacearum strains according to a modified version of the method described by Tsuge et al. (2002). Briefly, bacterial strains were grown in quarter‐strength M63 medium until the OD_600_ reached 1.0, after which 75 μL culture was added to an equal volume of 2 × assay buffer (0.1 M phosphate buffer pH 7.0, 0.15% β‐mercaptoethanol, and 0.2% Triton X‐100) containing 2 mM p‐nitrophenyl β‐d‐glucuronide as the substrate. After an incubation at 37°C for 2 h, the culture was centrifuged at 15,000 rpm. Pelleted bacterial cells were removed and the absorbance of the supernatant was measured at 415 nm (A_415_). The analysis was completed using eight technical replicates. Means were analyzed for significant differences between R. pseudosolanacearum strains via an analysis of variance (ANOVA) based on Tukey–Kramer's honestly significant difference test (p < 0.05).
Generation of the ΔxpsR Mutant and Its Transformants With Ectopic Expression of xpsR
2.5
To create xpsR‐deletion mutants, we first generated the pK18mobsacB‐based plasmid pdelta‐xpsR (Table 1) by inserting a recombinant fragment derived from a PCR amplification using specific primers (Table 2) into pK18mobsacB. Next, pdelta‐xpsR was electroporated into strain OE1‐1 and ΔphcA competent cells and then the kanamycin‐sensitive, sucrose‐resistant recombinants xpsR‐deletion (ΔxpsR), and xpsR and phcA‐deletion (ΔphcA/xpsR) mutants were selected.
To create transformants with ectopic expression of xpsR, we generated the pUC18‐mini‐Tn7T‐GM‐based plasmid pRSc0900proxpsR (Table 1) carrying the RSc0900 promoter fused to xpsR by inserting a recombinant fragment obtained from a PCR amplification using specific primers (Table 2) into pUC18‐mini‐Tn7T. Plasmid pRSc0900proxpsR was electroporated into ΔphcA, ΔxpsR, ΔphcA/xpsR, and ΔralT competent cells to produce the spectinomycin‐resistant transformants ΔphcA (xpsR), ΔxpsR (xpsR), ΔphcA/xpsR (xpsR), and ΔralT (xpsR), respectively.
qRT‐PCR
2.6
Total RNA was extracted from R. pseudosolanacearum strains that were grown in quarter‐strength M63 medium until the OD_600_ reached 0.3 using a High Pure RNA Isolation kit (Roche Diagnostics, Tokyo, Japan) and DNase I (Takara) at concentration of 167 nU/μL as previously described (Hayashi et al. 2019a). A quantitative real‐time polymerase chain reaction (qRT‐PCR) analysis involving gene‐specific primers (Table 3) was completed using a SYBR GreenER qPCR Reagent system (Invitrogen, Tokyo, Japan) and a 7300 Real‐Time PCR platform (Applied Biosystems, Foster City, CA, USA). The rpoD transcript level was used as the internal standard to normalize all values and 2‐ΔΔCt for the calculation of gene expression. There were no significant differences in the rpoD transcript level among R. pseudosolanacearum strains. Means were analyzed for significant differences between R. pseudosolanacearum strains by an ANOVA based on Tukey–Kramer's honestly significant difference test (α = 0.05).
Transcriptome Analysis Based on RNA‐Seq
2.7
We eliminated ribosomal RNA from the extracted total RNA of R. pseudosolanacearum strains using a Ribo‐Zero rRNA Removal kit (Gram‐negative bacteria) (Illumina, Madison, WI, USA). An oriented, paired‐end RNA‐seq (2 × 100 bp) analysis was then performed using an Illumina HiSeq. 2500 system (Illumina) and a DNBSEQ‐G400 system (MGI Tech, Shenzhen, China) by Bioengineering Lab Co. (Sagamihara, Japan). The generated reads were trimmed using Cutadapt (Martin 2011) and Trimmomatic (Bolger et al. 2014) and then mapped to the GMI1000 strain genome (Salanoubat et al. 2002) using the TopHat program (Trapnell et al. 2009). We analyzed at least three independent biological replicates per strain.
GO Enrichment Analysis
2.8
RNA‐seq data were statistically analyzed in the R environment (R Core Team 2022). We excluded genes with zero counts in at least one strain OE1‐1 sample in the raw count data set. RNA‐seq read counts of the remaining genes were normalized using the function calcNormFactors (trimmed mean of M‐values normalization) in the package edgeR (Robinson et al. 2010). To extract genes with significant changes in transcript levels, the following thresholds were applied: q‐value < 0.05 and |log_2_(fold‐change)| ≥ 2. The false discovery rate (q‐value) was calculated from p‐values estimated by edgeR according to the Benjamini–Hochberg method (Benjamini and Hochberg 1995). Hierarchical clustering of all normalized mean transcript values based on their relative transcript levels (counts per million) was performed using Cluster3.0 software (de Hoon et al. 2004). The average of at least three replicates per strain was calculated. Heatmaps were created using TreeView (Eisen et al. 1998). GO terms were obtained from the QuickGO database (https://www.ebi.ac.uk/QuickGO/annotations) using R. solanacearum GMI1000 gene annotation data. A GO enrichment analysis was conducted using the R package goseq (Young et al. 2010). Fold enrichments were calculated as follows: the ratio of differentially expressed genes (DEGs) annotated with a specific GO term to the expected ratio for all genes. Scores were calculated as follows: the proportion of all DEGs annotated with a GO term was divided by the proportion of all genes annotated with that GO term.
Swimming Motility Assay
2.9
For the swimming motility assay, 5‐μl aliquots of R. pseudosolanacearum cell suspensions at a cell density of 5.0 × 10^5^ colony‐forming units (cfu)/mL were added to the surface of quarter‐strength M63 medium solidified with 0.25% w/v agar (Mori et al. 2018b). Swimming area diameters were measured after a 48 h incubation. Fifteen technical replicates were prepared per group. Means were analyzed for significant differences between R. pseudosolanacearum strains by an ANOVA based on Tukey–Kramer's honestly significant difference test (α = 0.05).
EPS I Production Assay
2.10
EPS I produced by R. pseudosolanacearum cells grown on quarter‐strength M63 medium solidified with 1.5% agar was analyzed in an enzyme‐linked immunosorbent assay (Agdia, Elkhart, IN, USA) and quantified according to A_650_ as previously described (Mori et al. 2016). Twenty‐one technical replicates were prepared per group. Means were analyzed for significant differences between R. pseudosolanacearum strains by an ANOVA based on Tukey–Kramer's honestly significant difference test (α = 0.05).
Virulence Assays
2.11
Tomato plants (Solanum lycopersicum cultivar Ohgata‐Fukuju; Marutane, Kyoto, Japan) were grown in pots containing a mixture of vermiculite and peat moss (3: 1) in a growth room at 25°C under 10,000 lx for 16 h per day; they were watered with fivefold‐diluted Hoagland's solution (Hikichi et al. 1999). Eighteen‐day‐old tomato plants were inoculated with R. pseudosolanacearum strains at 1.0 × 10^8^ cfu/ml using a root‐dip method as previously described (Mori et al. 2016). We monitored plants daily for wilting symptoms, which were rated according to the following disease index scale and plants with at least 50% of wilting were considered as dead for the statistical survival analysis: 0, no wilting; 1, 1%–25% wilting; 2, 26%–50% wilting; 3, 51%–75% wilting; 4, 76%–99% wilting; 5, dead. For each bacterial strain, 20 technical replicates were tested. Means were analyzed for significant differences between R. pseudosolanacearum strains by an ANOVA based on Tukey–Kramer's honestly significant difference test (α = 0.05). Disease scoring was transformed into binary data, with a disease index below 3 corresponding to 0 and a disease index equal to or higher than 3 corresponding to 1 (Perrier et al. 2019). Log‐rank pairwise tests were used to determine significant difference between strains. A p‐value smaller than 0.05 was considered significant, indicating that the Ho hypothesis of similarity of the survival experience of the tested strains can be rejected. Statistical analyses were done with RStudio (Posit team 2025).
Results
3
Identification of RalT as a Novel TetR/AcrR Family Transcriptional Regulator
3.1
We first performed an RNA‐seq analysis of the transcriptomes of the ΔphcA and ΔralA mutants and strain OE1‐1 that were grown in quarter‐strength M63 medium until the optical density at 600 nm (OD_600_) reached 0.3. On the basis of the mapping of RNA‐seq reads for strain OE1‐1 to the GMI1000 genome (Salanoubat et al. 2002), we identified 4327 protein‐coding transcripts (Table S1). The following thresholds were applied to identify genes with transcript levels in the ΔphcA and ΔralA mutants that differed significantly from those in strain OE1‐1: q‐value < 0.05 and |log_2_(fold‐change)| ≥ 2. The expression levels of 399 genes and 241 genes decreased and increased significantly, respectively, in the ΔphcA mutants (hereafter referred to as positively and negatively QS‐dependent genes) (Figure 1A,B; Table S2). Among the QS‐dependent genes, the expression levels of 329 genes (hereafter referred to as positively QS/Ral‐dependent genes) and 195 genes (hereafter referred to as negatively QS/Ral‐dependent genes) decreased and increased significantly, respectively, in the ΔralA mutants (Figure 1A,B; Table S3). These results suggest that the regulation of 82.4% and 80.9% of positively and negatively QS‐dependent genes, respectively, are ralfuranone‐mediated, which is consistent with the findings of our previous study (Mori et al. 2018b), although the underlying mechanisms are unclear.
RNA‐sequencing analysis of the transcriptomes of Ralstonia pseudosolanacearum strain OE1‐1 and phcA‐deletion (ΔphcA), ralA‐deletion (ΔralA), and ralT‐deletion (ΔralT) mutants grown in quarter‐strength M63 medium until the OD600 reached 0.3. (A) Number of genes with transcript‐level log2(fold‐change) ≤ −2 in ΔphcA, ΔralA, and ΔralT (relative to their transcript levels in OE1‐1) (q < 0.05). Roman numerals in parentheses are responsive to clusters in Table 4. (B) Number of genes with transcript‐level log2(fold‐change) ≥ 2 in ΔphcA, ΔralA, and ΔralT (relative to their transcript levels in OE1‐1) (q < 0.05). Roman numerals in parentheses are responsive to clusters in Table 5. (C) Hierarchical clustering of the relative expression of QS/Ral/p0599‐dependent genes in R. pseudosolanacearum strains. (D) Correlations among the expression levels of QS/Ral/p0599‐dependent genes revealed by the comparison of ΔralT with ΔphcA and ΔralA.
To identify the transcriptional regulator‐encoding genes involved in the ralfuranone‐mediated regulation of QS‐dependent genes, we identified the 36 genes with expression levels that decreased significantly in ΔralA, but not in ΔphcA, included a putative transcriptional regulator‐encoding gene (ralT) (Figure 1A; Table S4). A quantitative real‐time polymerase chain reaction (qRT‐PCR) assay also showed that the expression level of ralT in ΔralA, but not in ΔphcA, significantly reduced, compared to that in strain OE1‐1 (α = 0.05; Figure 2). An analysis of the RalT amino acid sequence deduced according to the strain OE1‐1 genome using the BLAST algorithm and InterProScan indicated that RalT has a highly conserved N‐terminal helix‐turn‐helix motif and a C‐terminal tetracycline repressor‐like domain (Figure 3A), similar to type I TetR family (TetR/AcrR family) transcriptional regulators (Ahn et al. 2012; Colclough et al. 2019; Cuthbertson and Nodwell 2013; Ramos et al. 2005). Many TetR/AcrR family transcriptional regulators act as repressors by binding palindromic sequences overlapping promoters, thereby preventing the recruitment and binding of RNA polymerase. We detected a palindromic sequence (5′‐TGGCAAAGCACATTGCCA‐3′; Figure 3B) in the putative ralT promoter region. Furthermore, a qRT‐PCR analysis showed that the expression levels of ralT and RSp0600 in ΔralA significantly reduced, compared to those in OE1‐1 (α = 0.05; Figure 3C). We thus hypothesized that RalT may bind and repress the expression of both ralT and RSp0600 (genes with divergent promoters). To test this hypothesis, we used pHM1 (Gu et al. 2005) to generate recombinant plasmids pralTproGUS and pRSp0600proGUS, which contained a β‐glucuronidase (GUS)‐encoding gene under the control of the ralT promoter (ralTpro::GUS) and the RSp0600 promoter (RSp0600pro::GUS), respectively. We then transformed strain OE1‐1 and the ΔralT mutant with these recombinant plasmids. Transformants were selected according to spectinomycin resistance and analyzed in terms of GUS activity. The deletion of ralT significantly enhanced GUS activity derived from both ralTpro::GUS and RSp0600pro::GUS (Means were analyzed for significant differences between R. pseudosolanacearum strains via an ANOVA based on Tukey–Kramer's honestly significant difference test (α = 0.05; Figure 3D), suggesting that RalT is a repressor that negatively regulates RSp0600 and ralT expression.
The ralT expression level in Ralstonia pseudosolanacearum strain OE1‐1, phcA‐deletion (ΔphcA), and ralA‐deletion (ΔralA) mutants according to a quantitative real‐time polymerase chain reaction analysis. For assays of the ralT expression level, strains were grown in quarter‐strength M63 medium until the optical density at 600 nm (OD600) reached 0.3 and then used for an RNA extraction. The rpoD transcript level was used as the internal standard to normalize all values and 2‐ΔΔCt for the calculation of ralT expression level. There were no significant differences in the rpoD transcript level among R. pseudosolanacearum strains. Experiments were conducted using five biological replicates. Bars indicate standard errors. Means were analyzed for significant differences between strains via an ANOVA followed by Tukey–Kramer's honestly significant difference test. Statistically significant differences are indicated by different lowercase letters (α = 0.05).
A novel type I TetR family (TetR/AcrR family) transcriptional regulator (RalT) of Ralstonia pseudosolanacearum strain OE1‐1. (A) Domains in RalT were identified by analyzing deduced amino acid sequences using a BLAST algorithm and InterProScan. (B) ralT and RSp0600 promoter sequences. (C) The expression level of ralT and RSp0600 in strain OE1‐1 and ralA‐deletion (ΔralA) mutants according to a quantitative real‐time polymerase chain reaction analysis. For assays of the expression levels of ralT and RSp0600, strains were grown in quarter‐strength M63 medium until the optical density at 600 nm (OD600) reached 0.3 and then used for an RNA extraction. The rpoD transcript level was used as the internal standard to normalize all values and 2‐ΔΔCt for the calculation of ralT expression level. There were no significant differences in the rpoD transcript level among R. pseudosolanacearum strains. Experiments were conducted using five biological replicates. Bars indicate standard errors. Means were analyzed for significant differences between strains via an ANOVA followed by Tukey–Kramer's honestly significant difference test. Statistically significant differences are indicated by different lowercase letters (α = 0.05). (D) Effect of RalT on ralT and RSp0600 promoter activities. We measured the absorbance at 415 nm (A415) to determine the GUS activity of the transformants [OE1‐1 (ralTpro::GUS), ΔralT (ralTpro::GUS)] of strain OE1‐1 and the ralT‐deletion (ΔralT) mutant, with the ralT promoter fused to GUS, and the transformants [OE1‐1 (RSp0600pro::GUS), ΔralT (RSp0600pro::GUS)] of strain OE1‐1 and ΔralT, with the RSp0600 promoter fused to GUS. Eight technical replicates were prepared. Means were analyzed for significant differences between R. pseudosolanacearum strains via an ANOVA followed by Tukey–Kramer's honestly significant difference test (α = 0.05).
RNA‐Seq Analysis of the ΔralT Transcriptome
3.2
To characterize RalT as a transcriptional regulator, we conducted an RNA‐seq analysis of the ΔralT transcriptome. A comparison with strain OE1‐1 revealed a lack of significant changes in the expression levels of QS‐related genes, such as phcB, phcK, phcS, vsrA, phcQ, phcR, and chpA, in the ΔralT mutant (Table S5). However, in the ΔralT mutant, 351 genes (hereafter referred to as positively p0599‐dependent genes) had significantly downregulated expression levels, whereas 158 genes (hereafter referred to as negatively p0599‐dependent genes) had significantly upregulated expression levels (Figure 1A,B; Table S6). Of the positively and negatively p0599‐dependent genes, 310 and 89 genes, respectively, were included among the positively and negatively QS‐dependent genes (hereafter referred to as positively and negatively QS/p0599‐dependent genes). Furthermore, of the positively and negatively QS/p0599‐dependent genes, expression level of 294 and 87 genes, respectively, decreased and increased significantly, after the ralA‐deletion (hereafter referred to as positively and negatively QS/Ral/p0599‐dependent genes) (Figure 1A,B; Table S7).
A dendrogram for the hierarchical clustering of R. pseudosolanacearum strains was created on the basis of relative expression levels normalized against the expression of QS/Ral/p0599‐depenent genes, which revealed that the ΔralT mutant was clustered with the ΔphcA and ΔralA mutants (Figure 1C). Furthermore, QS/Ral/p0599‐dependent gene transcript levels were positively correlated between ΔralA and ΔralT [y, log_2_(fold‐change) in ΔralA; x, log_2_(fold‐change) in ΔralT; y = 1.1056x + 0.0322, r ^2^ = 0.9024, Figure 1D]. Additionally, QS/Ral/p0599‐dependent gene transcript levels were highly positively correlated between ΔphcA and ΔralT [y, log_2_(fold‐change) in ΔphcA; x, log_2_(fold‐change) in ΔralT; y = 1.201x − 0.0137, r ^2^ = 0.9457].
Data in the transcriptome analysis of ΔralT as well as ΔphcA and ΔralA suggest that RalT may participate in the regulation of 89.4% of positively QS/Ral‐dependent genes and 44.6% of negatively QS/Ral‐dependent genes (Figure S1).
Gene Ontology Enrichment Analysis of QS/Ral/p0599‐Dependent Genes
3.3
To characterize the functions of proteins encoded by QS/Ral/p0599‐dependent genes, we performed a Gene Ontology (GO) enrichment analysis of the QS/Ral/p0599‐dependent genes (cluster A‐VII; Figure 1A). For the positively QS/Ral/p0599‐dependent genes, typical GO terms, including “lipopolysaccharide biosynthetic process” were enriched among 163 genes affected by the genotype (Table 4). In the GO term, “quorum sensing,” which are the SolI/R and RasI/R systems using N‐acyl‐homoserine lactones (ATL) as QS signals (Li et al. 2024), is included, suggesting that the QS using 3‐OH MAME as a QS signal regulates the AHL‐based QS systems.
For the negatively QS/Ral/p0599‐dependent genes (cluster B‐VII), GO terms related to bacterial motility, including “chemotaxis,” “bacterial‐type flagellum basal body,” and “bacterial‐type flagellum‐dependent cell motility,” were enriched among 312 genes affected by the genotype (Figure 1B). Other terms, such as “siderophore biosynthetic process” and “siderophore uptake transmembrane transporter activity” were enriched (Table 5). The GO term “viral capsid assembly” was included in the cluster B‐III, of which genes were included in the negatively p0599‐dependent genes but not the negatively QS‐dependent genes and Ral‐dependent genes.
Swimming Motility of ΔralT
3.4
Under culture conditions, flagella‐driven RSSC swimming motility is a growth‐phase dependent process that is negatively controlled by PhcA during the QS‐active state (Tans‐Kersten et al. 2001). Furthermore, the ralA‐deletion significantly enhanced the expression level of fliC included in fli operon genes, leading to a significant increase in swimming motility of the ΔralA mutant (Mori et al. 2018b). A GO analysis indicated that GO terms related to bacterial motility, such as “chemotaxis,” “bacterial‐type flagellum basal body,” and “bacterial‐type flagellum‐dependent cell motility,” were enriched among negatively QS/Ral/p0599‐dependent genes. The transcriptome analysis showed that the deletion of ralT significantly enhanced the expression of fli operon genes, including fliC (Table S8). We examined the in vitro swimming motility of R. pseudosolanacearum strains grown in quarter‐strength M63 medium solidified with 0.25% w/v agar. Compared with strain OE1‐1, the ΔralT mutant exhibited significantly enhanced swimming motility, similar to ΔphcA (α = 0.05; Figure 4A).
Swimming motility (A) of Ralstonia pseudosolanacearum strains and the fliC expression level (B) in strains according to a quantitative real‐time polymerase chain reaction analysis. (A) Strain OE1‐1, phcA‐deletion (ΔphcA), ralA‐deletion (ΔralA), and ralT‐deletion (ΔralT) mutants, transformant (comp‐ralT) with the ralT promoter and open reading frame, and transformant [ΔralT (RSp0203pro::ralT)] with the RSp0203 promoter fused to the ralT open reading frame were grown on quarter‐strength M63 medium containing 0.3% w/v agar. Fifteen technical replicates were prepared per group. Bars indicate standard errors. Means were analyzed for significant differences between R. pseudosolanacearum strains via an analysis of variance (ANOVA) followed by Tukey–Kramer's honestly significant difference test. Statistically significant differences are indicated by different lowercase letters (α = 0.05). (B) Strains were grown in quarter‐strength M63 medium until the optical density at 600 nm (OD600) reached 0.3 and then used for an RNA extraction. The rpoD transcript level was used as the internal standard to normalize all values and 2‐ΔΔCt for the calculation of fliC expression level. There were no significant differences in the rpoD transcript level among R. pseudosolanacearum strains. Experiments were conducted using five biological replicates. Bars indicate standard errors. Means were analyzed for significant differences between R. pseudosolanacearum strains via an ANOVA followed by Tukey–Kramer's honestly significant difference test. Statistically significant differences are indicated by different lowercase letters (α = 0.05).
The swimming motility of the ΔralT mutant transformed with the pUC18‐mini‐Tn7T‐GM‐based plasmid (pralT) carrying the native ralT promoter and open reading frame (comp‐ralT) was similar to that of ΔralT (Figure 4A). Furthermore, comp‐ralT was also similar to ΔralT in terms of fliC expression (Figure 4B). Thus, we hypothesized that ralT may not be expressed in comp‐ralT. A transcriptome analysis showed that the deletion of phcA, ralA, or ralT did not alter the expression level of RSp0203 encoding acyl‐CoA thioester hydrolase‐related protein. Moreover, count values of RSp0203 were similar level to those of ralT in strain OE1‐1 (Table S1). We then transformed ΔralT with plasmid pRSp0203proralT (Table 1), which includes the RSp0203 promoter fused to the ralT open reading frame, to generate the ΔralT (RSp0203pro::ralT) transformant. Compared with ΔralT, ΔralT (RSp0203pro::ralT) had a significantly lower fliC expression level (Figure 4B). Furthermore, ΔralT (RSp0203pro::ralT) exhibited significantly decreased swimming motility (relative to that of ΔralT) (Figure 4A). These results suggest that RalT may repress fli operon expression, thereby suppressing the swimming motility of strain OE1‐1.
EPS I Production of ΔralT
3.5
During QS, activated PhcA induces the transcription of xpsR, with the encoded transcriptional regulator (XpsR) binding to the promoter of eps operon genes, including epsB, and increasing expression (XpsR‐regulated pathway; Garg et al. 2000). The ralA‐deletion leads to a significant decrease in EPS I production (Mori et al. 2018b). Furthermore, the transcriptome analysis showed that the deletion of phcA or ralA significantly reduces expression level of EPS I production‐related genes including epsB as well as xpsR (Table S9). To examine contribution RalT to EPS I production, we examined the in vitro EPS I production of R. pseudosolanacearum strains grown in quarter‐strength M63 medium solidified with 1.5% agar. The xpsR‐deletion led to a significant decrease in EPS I production, similar to the phcA‐deletion (α = 0.05; Figure 5A). Furthermore, the qRT‐PCR analysis showed that the phcA‐deletion led to a significant decrease in the expression level of xpsR (α = 0.05; Figure 5B). The expression level of epsB significantly decreased in ΔphcA at the similar level in ΔxpsR, compared to that in OE1‐1 (α = 0.05; Figure 5C). These results suggest that the PhcA/XpsR‐regulated pathway mainly contributes to the induction of EPS I production.
Major exopolysaccharide EPS I production (A) in Ralstonia pseudosolanacearum strains, and expression levels of xpsR (B) and epsB (C) in strains according to a quantitative real‐time polymerase chain reaction analysis. (A) Strain OE1‐1, phcA‐deletion (ΔphcA), ralA‐deletion (ΔralA), ralT‐deletion (ΔralT), xpsR‐deletion (ΔxpsR), and phcA/xpsR‐deletion (ΔphcA/xpsR) mutants, and ΔphcA (xpsR), ΔxpsR (xpsR), ΔphcA/xpsR (xpsR), and ΔralT (xpsR) transformants, which were derived from ΔphcA, ΔxpsR, ΔphcA/xpsR, and ΔralT transformed with the pHM1‐based plasmid pRSc0900proxpsR containing the constitutively active RSc0900 promoter fused to xpsR, were incubated on quarter‐strength M63 medium solidified with 1.5% agar. The EPS I content of supernatants was quantified in an enzyme‐linked immunosorbent assay involving anti‐R. solanacearum EPS I antibodies. EPS I production was quantified according to the absorbance at 650 nm (A650). Twenty‐one technical replicates were prepared per group. Bars indicate standard errors. Means of EPS I production were analyzed for significant differences between strains via an analysis of variance (ANOVA) followed by Tukey–Kramer's honestly significant difference test. Statistically significant differences are indicated by different lowercase letters (α = 0.05). (B, C) Strains were grown in quarter‐strength M63 medium until the optical density at 600 nm (OD600) reached 0.3 and then used for an RNA extraction. The rpoD transcript level was used as the internal standard to normalize all values and 2‐ΔΔCt for the calculation of epsB expression level. There were no significant differences in the rpoD transcript level among R. pseudosolanacearum strains. Experiments were conducted using five biological replicates. Bars indicate standard errors. Means were analyzed for significant differences between strains via an ANOVA followed by Tukey–Kramer's honestly significant difference test. Statistically significant differences are indicated by different lowercase letters (α = 0.05).
On the other hand, the ΔralT mutant produced significantly more EPS I than strain OE1‐1 (α = 0.05; Figure 5 A), suggesting that RalT is involved in the negative regulation of EPS I production. However, an RNA‐seq analysis showed that the deletion of ralT led to a significant decrease in the expression levels of eps genes including epsB as well as xpsR (Table S9). In addition, though the qRT‐PCR analysis showed that the expression levels of xpsR and epsB in ΔralT is significantly lower than those in strain OE1‐1, ΔralT significantly exhibited high expression levels of xpsR and epsB than ΔphcA (α = 0.05; Figure 5B,C). Thus, we hypothesized that the factor(s) other than the XpsR may be positively regulated by PhcA but not XpsR and be required for the induction of EPS I.
To assess this hypothesis, we generated ΔxpsR and ΔphcA/xpsR mutants from strain OE1‐1 and ΔphcA, respectively. RNA‐seq data indicated that the deletion of phcA, ralA, or ralT did not affect expression of RSc0900 encoding signal peptide protein of which function is unknown. In addition, count values of RSc0900 were similar level to those of xpsR in strain OE1‐1 (Table S1). We then transformed the ΔphcA, ΔxpsR, ΔphcA/xpsR, and ΔralT mutants with the pHM1‐based plasmid pRSc0900proxpsR, which contains xpsR fused to the constitutively activated RSc0900 promoter, thereby generating the ΔphcA (xpsR) ΔxpsR (xpsR), ΔphcA/xpsR (xpsR), and ΔralT (xpsR) mutants, respectively. The qRT‐PCR analysis showed that all transformants expressed similar expression levels of xpsR (Figure 5B), leading to the similar expression level of epsB in these mutants, compared to that in strain OE1‐1 (Figure 5 C). We then assayed EPS I production in the transformants. The ΔphcA/xpsR mutant produced significantly less EPS I than strain OE1‐1, similar to the ΔxpsR and ΔphcA mutants (α = 0.05; Figure 5A). The ΔxpsR (xpsR) mutant had significantly more EPS I than the ΔxpsR mutant. However, the induction of xpsR expression independent of PhcA did not enhance the production of EPS I in the ΔphcA, ΔphcA/xpsR, and ΔralT mutants. These results suggest that the XpsR‐independent factor(s) is positively regulated by PhcA and are required for EPS I production. The ralT‐deletion led to a decrease in xpsR expression levels (Figure 5B) and an increase in EPS I production (Figure 5A). It is thus thought that RalT may contribute to the negative regulation of the XpsR‐independent factor(s) as well as the positive regulation of xpsR.
Virulence of ΔralT
3.6
The ΔralA loses its virulence (Kai et al. 2014) as well as the ΔphcA (Hikichi et al. 2017). To investigate the effects of RalT on strain OE1‐1 virulence, we inoculated 18‐day‐old tomato plants with R. pseudosolanacearum strains according to the root‐dip method (Hayashi et al. 2019a) and then examined disease development. For the tomato plants inoculated with strain OE1‐1, wilt symptoms were detectable 3 days after inoculation (DAI), and all plants were dead by 9 DAI (Figure 6A). Tomato plants inoculated with ΔphcA did not exhibit any wilt symptom. Notably, the tomato plants inoculated with ΔralT mutant had a much higher disease index, compared to those with OE1‐1. Furthermore, the Kaplan–Meier survival analysis of tomato plants showed that the tomato plants inoculated with ΔralT mutant had a significantly lower survival rate, compared to those with OE1‐1 (Figure 6B).
Virulence (A) of Ralstonia pseudosolanacearum strains on tomato plants and survival rate of the tomato plants (B). (A) Eighteen‐day‐old tomato plants were inoculated with R. pseudosolanacearum strain OE1‐1 or the phcA‐deletion (ΔphcA) and ralT‐deletion (ΔralT) mutants. Plants were rated according to the following disease index scale: 0, no wilting; 1, 1%–25% wilting; 2, 26%–50% wilting; 3, 51%–75% wilting; 4, 76%–99% wilting; 5, dead. For each bacterial strain, 20 technical replicates were tested. Bars indicate standard errors. Means were analyzed for significant differences between R. pseudosolanacearum strains via an analysis of variance followed by Tukey–Kramer's honestly significant difference test. Statistically significant differences are indicated by different lowercase letters (α = 0.05). (B) Disease scoring was transformed into binary data, with a disease index below 3 corresponding to 0 and a disease index equal to or higher than 3 corresponding to 1. Log‐rank pairwise tests were used to determine significant difference between strains. A p‐value smaller than 0.05 was considered significant, indicating that the Ho hypothesis of similarity of the survival experience of the tested strains can be rejected. Statistical analyses were done with RStudio.
Discussion
4
The members of the TetR/AcrR family of transcriptional regulators harbor a diverse ligand‐binding domain that recognizes the same series of compounds as the transporters they regulate (Colclough et al. 2019; Routh et al. 2009). RalT has a C‐terminal ligand‐binding domain as well as an N‐terminal helix‐turn‐helix motif, similar to TetR/AcrR family transcriptional regulators (Figure 3A). Furthermore, the TetR/AcrR family transcriptional regulators usually bind to incomplete palindromic sequences in the upstream region of their own gene and repress expression (Deng et al. 2013). In the current study, the putative ralT promoter region was revealed to contain a palindromic sequence (Figure 3B). The ralA‐deletion reduced the expression levels of RSp0600 as well as ralT (Figure 3C). A GUS activity assay showed that RalT repressed the expression of ralT as well as RSp0600 (Figure 3D). Therefore, ralT encodes a novel TetR/AcrR family transcriptional regulator.
QS is tightly linked to the production of various types of chemical compounds. Moreover, the positive feedback regulation of QS is important for the rapid activation of QS and the synchronization of QS‐dependent gene regulation (Engebrecht and Silverman 1984; More et al. 1996; Ng and Bassler 2009; Schaefer et al. 1996). The production of an aryl‐furanone secondary metabolite, ralfuranone, is induced in the QS‐active state (Kai 2023; Kai et al. 2014, 2016) and is involved in the positive QS feedback regulation by influencing the regulation of QS/Ral‐dependent genes (Mori et al. 2018b). Results in this study showed that ralfuranone, but not QS, participates in the positive regulation of ralT expression (Figure 2). Of the positively and negatively QS/Ral‐dependent genes, 89.4% and 44.6% had expression levels that decreased and increased significantly, respectively, after the deletion of ralT (Figure 1A,B). In addition, QS/Ral/p0599‐dependent gene expression levels were positively correlated between ΔralT and ΔphcA or ΔralA (Figure 1C,D). These results indicate the contribution of RalT on the regulation of some QS/Ral‐dependent genes (Figure S1).
In many bacterial species, TetR/AcrR family transcriptional regulators act as chemical sensors that monitor the cellular environment to regulate a wide range of cellular activities, properties, and components, including osmotic stress responses, homeostasis, biosynthesis of antibiotics, multidrug resistance, efflux pumps, enzymes implicated in different catabolic pathways, and virulence (Ahn et al. 2012; Colclough et al. 2019; Deng et al. 2013; Ramos et al. 2005; Routh et al. 2009). In the present study, the deletion of ralA but not phcA resulted in significantly reduced expression of ralT (Figure 2). RalT repressed the expression of ralT (Figure 3D) and induced the expression of ralA and ralD encoding ralfuranone biosynthesis‐related proteins (Table S6), suggesting that ralfuranone biosynthesis‐related genes are regulated via positive feedback through RalT (Figure S1). Thus, the regulation of QS/Ral/p0599‐dependent genes may be fine‐tuned through RalT.
Flagella biogenesis in RSSC is negatively regulated during the QS‐activation state because of activated PhcA (Tans‐Kersten et al. 2001). Furthermore, ralfuranone deficiency enhances swimming motility (Mori et al. 2018b). The results of the current study showed that RalT negatively regulates the expression of swimming motility‐related genes, including fliC, which were included among the ralfuranone‐mediated negative QS‐genes (Table S8). The transformation of ΔralT with pRSp0203proralT (with a constitutively activated promoter) resulted in a significant decrease in swimming motility to a level that was similar to that of strain OE1‐1 (Figure 4). Accordingly, RalT may directly repress the expression of swimming motility‐related genes along with PhcA (Figure S1), thereby decreasing swimming motility.
In the QS‐active state, PhcA binds to the promoter of xpsR, which encodes the transcriptional regulator XpsR, to enhance expression (Garg et al. 2000; Genin and Denny 2012). XpsR positively regulates eps operon genes involved in the production and secretion of EPS I, resulting in enhanced EPS I production. The requirement of XpsR for EPS I production (Figure 5A) suggests that the XpsR‐regulated pathway mainly contributes to the induction of EPS I production. The experiment involving the QS‐independent and ectopic expression of xpsR suggests that XpsR‐independent factor(s), which is positively regulated by PhcA, is required for EPS I production. It is thought that RalT contributes to both positive regulation of xpsR and the negative regulation of the XpsR‐independent factor(s) (Figure 5B). Because ralT was regulated independently of PhcA (Figure 2), RalT contributes to the sophisticated regulation of EPS I production, which is positively regulated through PhcA and XpsR.
RalT positively regulated many virulence‐related genes such as lecM, cbhA, and egl of QS/Ral/p0599‐dependent genes (Table S6). However, tomato plants inoculated with ΔralT wilted faster than those inoculated with strain OE1‐1 (Figure 6), suggesting RalT negatively regulates strain OE1‐1 virulence. In RSSC, a deficiency in the type III secretion machinery leads to a loss of virulence (Genin and Denny 2012; Hikichi et al. 2017). Although genes encoding the type III secretion machinery components and the type III effectors were included among the negative QS/Ral‐dependent genes but not negatively QS/Ral/p0599‐dependent genes (cluster B‐ IV), their regulation was independent of RalT. However, EPS I, which is a major virulence factor of RSSC (Genin and Denny 2012), contributes to the positive QS feedback regulation separately from ralfuranone (Hayashi et al. 2019b). In the present study, deleting ralT led to enhanced EPS I production (Figure 5A). We thus speculated that RalT may negatively regulate strain OE1‐1 virulence by decreasing EPS I production.
VsrAD and VsrBC two‐component sensor histidine kinase/response regulator systems affect the regulation of flagella biogenesis (Genin and Denny 2012). Furthermore, PhcA and the VsrAD two‐component system are necessary to fully activate xpsR transcription and positively regulate the eps operon, thereby enhancing EPS I production (Garg et al. 2000; Genin and Denny 2012). Both XpsR and the VsrC bind to the promoters of eps operon genes, including epsB, to enhance expression (Garg et al. 2000). Schneider et al. (2009) reported that VsrAD functions upstream of PhcA and contributes to ralfuranone biosynthesis. Therefore, QS‐dependent phenotypes, such as swimming motility and EPS I production, are regulated through RalT along with VsrAD and VsrBC two‐component systems. Results in this study indicate that RalT negatively regulated ralT (Figure 3D) and is involved in the positive feedback regulation of ralfuranone production‐related genes (Table S6). Considered together, these findings indicate that RalT‐mediated gene regulation may lead to the comprehensive regulation of RSSC virulence, with QS representing a critical regulatory system. In terms of future research, in vitro experiments using purified proteins and signal transduction assays will be important for elucidating the QS mechanisms governing RalT‐mediated gene regulation. Because inhibiting QS via the application of phc quorum sensing inhibitors (PQIs) can control bacterial wilt caused by strain OE1‐1 (Yoshihara et al. 2020), comprehensively and precisely characterizing the QS mechanism, including RalT‐mediated gene regulation, may reveal molecular targets appropriate for improving disease control measures.
Author Contributions
Tatsuya Ueyama: funding acquisition, investigation, methodology, validation and visualization. Masayuki Tsuzuki: conceptualization, funding acquisition, investigation, methodology, validation, visualization, writing – review and editing. Sora Tateda: funding acquisition, investigation, methodology, validation and visualization. Yuki Terazawa: investigation, methodology, validation and visualization. Aoi Ikeuchi: investigation, methodology, validation and visualization. Akinori Kiba: conceptualization. Kouhei Ohnishi: conceptualization. Yasufumi Hikichi: conceptualization, funding acquisition, writing – original draft.
Ethics Statement
The authors have nothing to report.
Conflicts of Interest
The authors declare no conflicts of interest.
Supporting information
FIGURE S1: Predicted regulation of QS/Ral/p0599‐dependent genes via RalT in Ralstonia pseudosolanacearum strain OE1‐1.
TABLE S1: RNA‐sequencing data for transcripts of genes in Ralstonia pseudosolanacearum strain OE1‐1, and phcA‐deletion (ΔphcA), ralA‐deletion (ΔralA) and ralT‐deletion (ΔralT) mutants, grown in quarter‐strength M63 medium, and predicted function of proteins encoded the genes.
TABLE S2: RNA‐sequencing data for transcripts of QS‐dependent genes in Ralstonia pseudosolanacearum strain OE1‐1, and phcA‐deletion (ΔphcA), ralA‐deletion (ΔralA) and ralT‐deletion (ΔralT) mutants, grown in quarter‐strength M63 medium, and predicted function of proteins encoded the genes.
TABLE S3: RNA‐sequencing data for transcripts of QS/RalA‐dependent genes in Ralstonia pseudosolanacearum strain OE1‐1, and phcA‐deletion (ΔphcA), ralA‐deletion (ΔralA) and ralT‐deletion (ΔralT) mutants, grown in quarter‐strength M63 medium, and predicted function of proteins encoded the genes.
TABLE S4: RNA‐sequencing data for transcripts of genes whose expression levels were reduced in the ralA deletion (ΔralA) mutant but not the phcA deletion (ΔphcA), compared to Ralstonia pseudosolanacearum strain OE1‐1, and predicted function of proteins encoded the genes.
TABLE S5: RNA‐sequencing data for quorum sensing‐related genes in Ralstonia pseudosolanacearum strain OE1‐1, and phcA‐deletion (ΔphcA), ralA‐deletion (ΔralA) and ralT‐deletion (ΔralT) mutants, grown in quarter‐strength M63 medium, and predicted function of proteins encoded the genes.
TABLE S6: RNA‐sequencing data for transcripts of p0599‐dependent genes in Ralstonia pseudosolanacearum strain OE1‐1, and phcA‐deletion (ΔphcA), ralA‐deletion (ΔralA) and ralT‐deletion (ΔralT) mutants, grown in quarter‐strength M63 medium, and predicted function of proteins encoded the genes.
TABLE S7: RNA‐sequencing data for transcripts of QS/Ral/p0599‐dependent genes in Ralstonia pseudosolanacearum strain OE1‐1, and phcA‐deletion (ΔphcA), ralA‐deletion (ΔralA) and ralT‐deletion (ΔralT) mutants, grown in quarter‐strength M63 medium, and predicted function of proteins encoded the genes.
TABLE S8: RNA‐sequencing data for transcripts of flagellar motility‐related genes in Ralstonia pseudosolanacearum strain OE1‐1, and phcA‐deletion (ΔphcA), ralA‐deletion (ΔralA) and ralT‐deletion (ΔralT) mutants, grown in quarter‐strength M63 medium, and predicted function of proteins encoded the genes.
TABLE S9: RNA‐sequencing data for transcripts of EPS I production‐related genes in Ralstonia pseudosolanacearum strain OE1‐1, and phcA‐deletion (ΔphcA), ralA‐deletion (ΔralA) and ralT‐deletion (ΔralT) mutants, grown in quarter‐strength M63 medium, and predicted function of proteins encoded the genes.
The reference list from the paper itself. Each links out to its DOI / PubMed record.
- 1Ahn, S. K. , L. Cuthbertson , and J. R. Nodwell . 2012. “Genome Context as a Predictive Tool for Identifying Regulatory Targets of the Tet R Family Transcriptional Regulators.” P Lo S One 7, no. 11: e 50562. 10.1371/journal.pone.0050562.23226315 PMC 3511530 · doi ↗ · pubmed ↗
- 2Allen, C. 1991. “Cloning of Genes Affecting Polygalacturonase Production in Pseudomonas solanacearum .” Molecular Plant‐Microbe Interactions 4, no. 2: 147–154. 10.1094/MPMI-4-147. · doi ↗
- 3Benjamini, Y. , and Y. Hochberg . 1995. “Controlling the False Discovery Rate: A Practical and Powerful Approach to Multiple Testing.” Journal of the Royal Statistical Society Series B: Statistical Methodology 57, no. 1: 289–300. 10.1111/j.2517-6161.1995.tb 02031.x. · doi ↗
- 4Bolger, A. M. , M. Lohse , and B. Usadel . 2014. “Trimmomatic: A Flexible Trimmer for Illumina Sequence Data.” Bioinformatics 30, no. 15: 2114–2120. 10.1093/bioinformatics/btu 170.24695404 PMC 4103590 · doi ↗ · pubmed ↗
- 5Carter, M. D. , T. M. Tran , M. L. Cope‐Arguello , et al. 2024. “Lectins and Polysaccharide EPS I Have Flow‐Responsive Roles in the Attachment and Biofilm Mechanics of Plant Pathogenic Ralstonia .” P Lo S Pathogens 20, no. 9: e 1012358. 10.1371/journal.ppat.1012358.39312573 PMC 11449490 · doi ↗ · pubmed ↗
- 6Choi, K. H. , J. B. Gaynor , K. G. White , et al. 2005. “A Tn 7‐Based Broad‐Range Bacterial Cloning and Expression System.” Nature Methods 2, no. 6: 443–448. 10.1038/nmeth 765.15908923 · doi ↗ · pubmed ↗
- 7Colclough, A. L. , J. Scadden , and J. M. A. Blair . 2019. “Tet R‐Family Transcription Factors in Gram‐Negative Bacteria: Conservation, Variation and Implications for Efflux‐Mediated Antimicrobial Resistance.” BMC Genomics 20, no. 1: 731. 10.1186/s 12864-019-6075-5.31606035 PMC 6790063 · doi ↗ · pubmed ↗
- 8Cuthbertson, L. , and J. R. Nodwell . 2013. “The Tet R Family of Regulators.” Microbiology and Molecular Biology Reviews 77, no. 3: 440–475. 10.1128/MMBR.00018-13.24006471 PMC 3811609 · doi ↗ · pubmed ↗