Cancer‐associated fibroblasts are associated with CD8+ T cell depletion and poor prognosis in colorectal adenocarcinoma: a multi‐omics and machine learning analysis
Myungsun Shim, One‐Zoong Kim, Byoung Kwan Son, Jung Ki Jo, Seung Wook Lee, Hong Sang Moon, Hyung Suk Kim, Mi Jung Kwon, Sung Hak Lee, Yung‐Kyun Noh, Kyueng‐Whan Min

TL;DR
This study shows that cancer-associated fibroblasts are linked to reduced T cell presence and worse outcomes in colorectal cancer patients.
Contribution
The study introduces a machine learning model that improves survival prediction by incorporating aCAF features and multi-omics data.
Findings
aCAFs correlate with advanced tumor stage and reduced CD8+ and CD4+ T cell infiltration.
aCAF-related genes are involved in immunosuppressive and tumor progression pathways.
Machine learning models using aCAFs show better prognostic accuracy for survival outcomes.
Abstract
Fibroblastic proliferation in various tumor microenvironments influences cancer survival through complex interactions with diverse immune responses. This study investigated the impact of histologically unique activated cancer‐associated fibroblasts (aCAFs) on survival outcomes and immune responses and examined their association with various pathophysiological mechanisms. We analyzed a total of 1,024 colorectal adenocarcinoma patients from two cohorts. aCAFs were evaluated based on hematoxylin and eosin‐stained whole‐slide images, and their associations with clinicopathological features, immune cell infiltration, and survival were assessed. We developed a machine learning‐based survival prediction model incorporating aCAFs and clinicopathologic parameters. Additionally, we performed differential gene expression analysis, functional enrichment analyses, and in vitro drug screening of…
Genes, proteins, chemicals, diseases, species, mutations and cell lines named across the full text — each resolved to its canonical identifier and authoritative record.
Click any figure to enlarge with its caption.
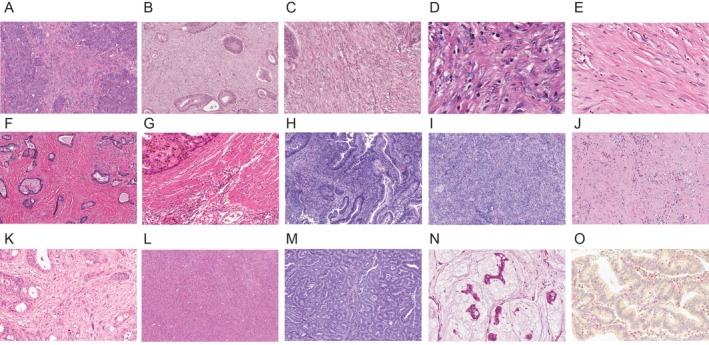 Figure 1
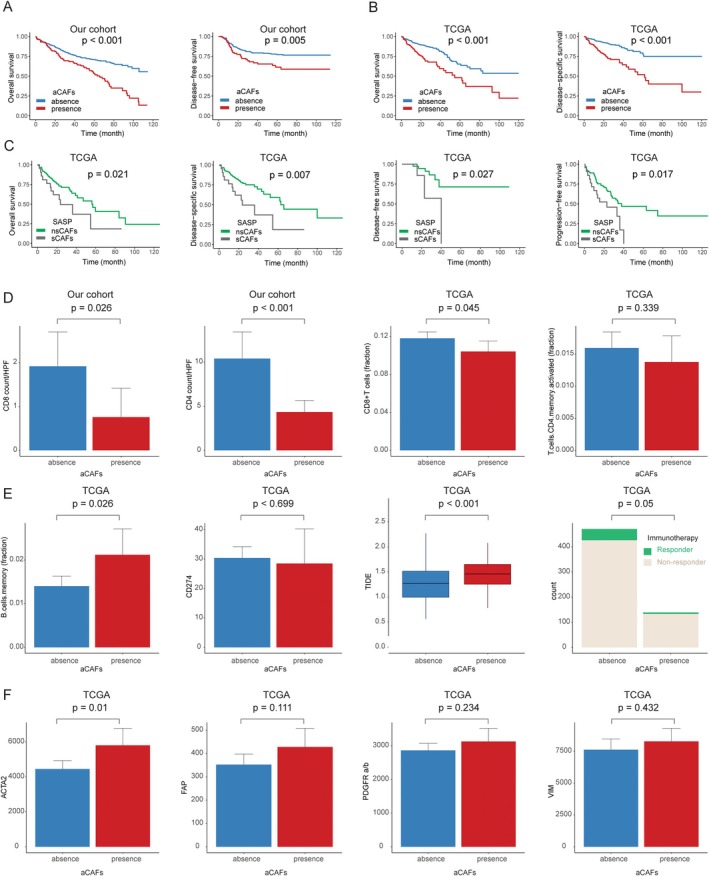 Figure 2
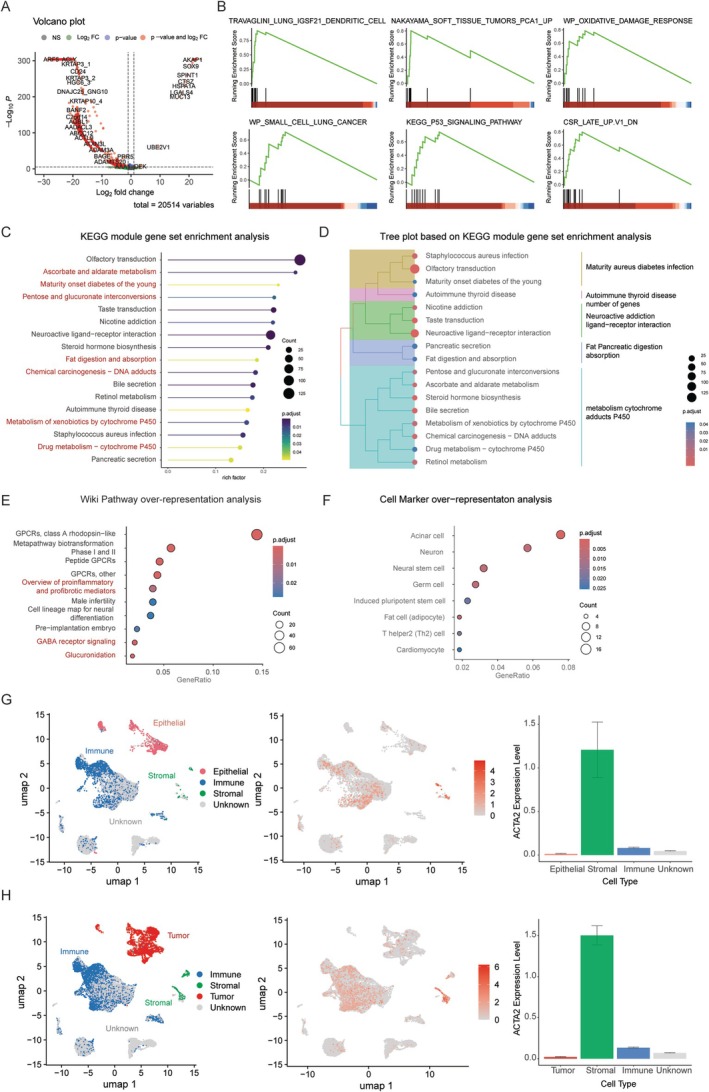 Figure 3
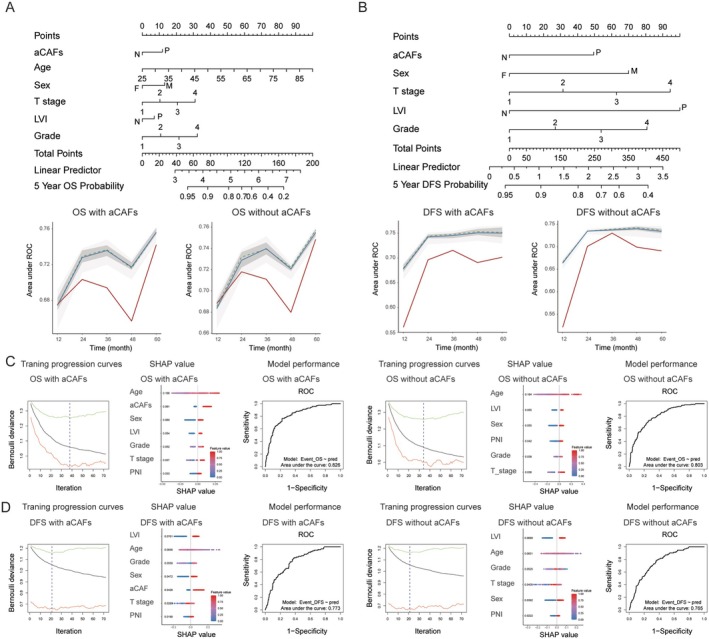 Figure 4
|
| Activated cancer‐associated fibroblasts |
| |
|---|---|---|---|
| Absence ( | Presence ( | ||
| Age (years) | 62.4 ± 11.3 | 66.6 ± 11.2 | 0.001 |
| Tumor size (cm) | 5.0 ± 2.2 | 5.0 ± 2.0 | 0.959 |
| Sex | |||
| Female | 118 (38.7) | 40 (40.4) | 0.853 |
| Male | 187 (61.3) | 59 (59.6) | |
| T stage | |||
| 1 | 31 (10.2) | 4 (4.0) | 0.041 |
| 2 | 35 (11.5) | 5 (5.1) | |
| 3 | 186 (61.0) | 67 (67.7) | |
| 4 | 53 (17.4) | 23 (23.2) | |
| N stage | |||
| 0 | 148 (48.5) | 36 (36.4) | 0.026 |
| 1 | 76 (24.9) | 23 (23.2) | |
| 2 | 81 (26.6) | 40 (40.4) | |
| Location | |||
| Cecum to sigmoid | 196 (64.3) | 59 (59.6) | 0.403 |
| Rectosigmoid to rectum | 109 (35.7) | 40 (40.4) | |
| Histological grade | |||
| Well differentiated | 29 (9.5) | 2 (2.0) | 0.015 |
| Moderately differentiated | 136 (44.6) | 52 (52.5) | |
| Poorly differentiated | 140 (45.9) | 45 (45.5) | |
| Lymphovascular invasion | |||
| Negative | 141 (46.2) | 31 (31.3) | 0.013 |
| Positive | 164 (53.8) | 68 (68.7) | |
| Perineural invasion | |||
| Negative | 166 (54.4) | 41 (41.4) | 0.033 |
| Positive | 139 (45.6) | 58 (58.6) | |
| Tumor necrosis | |||
| Negative | 137 (45.5) | 20 (20.2) | <0.001 |
| Positive | 164 (54.5) | 79 (79.8) | |
| Univariate | Multivariate | HR | 95% CI | ||
|---|---|---|---|---|---|
| Disease‐free survival | |||||
| aCAFs (absence versus presence) | 0.005 | 0.042 | 1.600 | 1.016 | 2.518 |
| Age (≤55 versus >55) | 0.653 | 0.570 | 0.866 | 0.526 | 1.424 |
| Sex (women versus men) | 0.016 | 0.008 | 1.876 | 1.175 | 2.993 |
| T stage (1, 2 versus 3, 4) | <0.001 | 0.025 | 2.913 | 1.142 | 7.430 |
| Histological grade (1, 2 versus 3) | <0.001 | 0.007 | 1.832 | 1.182 | 2.842 |
| LVI (absence versus presence) | <0.001 | 0.008 | 2.145 | 1.221 | 3.770 |
| PNI (absence versus presence) | <0.001 | 0.353 | 1.262 | 0.772 | 2.062 |
| Necrosis (absence versus presence) | 0.134 | 0.923 | 1.023 | 0.644 | 1.626 |
| Overall survival | |||||
| aCAFs (absence versus presence) | <0.001 | 0.001 | 1.738 | 1.237 | 2.443 |
| Age (≤55 versus >55) | 0.002 | 0.011 | 1.847 | 1.149 | 2.971 |
| Sex (women men) | 0.019 | 0.025 | 1.489 | 1.052 | 2.108 |
| T stage (1, 2 versus 3, 4) | <0.001 | 0.019 | 2.068 | 1.125 | 3.800 |
| Histological grade (1, 2 versus 3) | 0.001 | 0.018 | 1.486 | 1.071 | 2.063 |
| LVI (absence versus presence) | <0.001 | 0.256 | 1.258 | 0.847 | 1.869 |
| PNI (absence versus presence) | <0.001 | 0.098 | 1.379 | 0.943 | 2.018 |
| Necrosis (absence versus presence) | 0.120 | 0.923 | 1.018 | 0.714 | 1.449 |
- —NRF/MSIT10.13039/501100014188
- —IITP/MSIT10.13039/501100014188
- —The research fund of Hanyang University
Peer Reviews
No public reviews on file for this paper yet. If you reviewed it on a platform where reviews are public (OpenReview, ICLR, NeurIPS, ICML), you can paste yours below so the community can read it here.
Videos
No videos yet. Explain this paper in a talk, walkthrough, or lecture? Add one.
Taxonomy
TopicsCancer Immunotherapy and Biomarkers · Ferroptosis and cancer prognosis · Cancer Cells and Metastasis
Introduction
Colorectal adenocarcinoma (CRC) represents a significant global health burden, with rising incidence and mortality rates influenced by genetic predisposition, environmental factors, and lifestyle choices [1]. Despite significant advancements in surgical techniques, chemotherapy, and immunotherapy, patient outcomes remain suboptimal, particularly in advanced‐stage disease. A key determinant of CRC progression is the tumor microenvironment (TME), which plays a crucial role in immune evasion and therapeutic resistance [2]. Among the immune components, CD8+ T cells are central to antitumor immunity, as they mediate cytotoxic responses against malignant cells. The immunosuppressive nature of the TME in CRC often results in impaired CD8+ T cell infiltration and function, thereby facilitating disease progression and resistance to therapy [3].
Cancer‐associated fibroblasts (CAFs) represent a critical stromal component within the CRC microenvironment, playing a pivotal role in tumor progression and immune modulation [4]. These cells have been shown to promote tumor proliferation, invasion, and metastasis through extracellular matrix remodeling and the secretion of immunosuppressive cytokines. In the context of cancer progression, CAFs have been observed to impede immune cell function through the action of transforming growth factor‐beta (TGF‐β) and other immunosuppressive mediators [5], while concomitantly inducing LRG1 expression in tumor cells via the STAT3 pathway, thus promoting processes such as epithelial–mesenchymal transition, migration, and invasion [6].
Recent advancements in single‐cell RNA sequencing have enabled the extensive classification of CAF phenotypes, including myoblast‐like CAFs (myCAFs), inflammatory CAFs (iCAFs), and antigen‐presenting CAFs (apCAFs). These classifications are based on marker genes, biological functions, spatial distribution within the TME, and cellular interactions [7]. Recent research has identified additional subpopulations, including senescent CAFs. These cells are distinguished by their senescence‐associated secretory phenotype (SASP), which is characterized by the expression of specific SASP‐related genes, such as interleukins (IL‐6, IL‐8), chemokines (CCL2, CXCL1), and matrix metalloproteinases (MMPs) [8, 9]. However, these classifications are limited by their molecular phenotyping approach and lack intuitive histopathological features for identification.
The present study employs classical approaches to identify histologically distinctive activated cancer‐associated fibroblasts (aCAFs) through direct examination of hematoxylin and eosin (H&E)‐stained whole slide images. This approach aims to investigate their clinical significance and diverse biological implications beyond the molecularly classified CAF subtypes in CRC. In this study, an integrated analysis was employed to evaluate the potential impact of aCAFs on disease progression and immune response. This analysis combined histopathological examination, large‐scale genomic data, bioinformatics, and machine learning approaches (supplementary material, Figure S1).
Materials and methods
Patient selection
This study included 404 patients with surgically resected CRC (305 colon, 99 rectum) treated between 2000 and 2010 at hospitals affiliated with Eulji Medical Center. Clinicopathological parameters collected included patient age, sex, tumor location, histological grade, pathological stage according to the 8th edition of the American Joint Committee on Cancer (AJCC) staging system, lymphovascular invasion (LVI), perineural invasion (PNI), and tumor necrosis. The study protocol received approval from the Institutional Review Board of Uijeongbu Eulji University Hospital (IRB number: 2023‐12‐005‐006), which covers hospitals affiliated with Eulji Medical Center, and adhered to the ethical standards outlined in the Declaration of Helsinki, revised in 2008. Due to the retrospective nature of the study and the anonymized data used, informed consent was not obtained from individual participants. The IRB granted permission to waive the requirement for documented informed consent.
For validation, we obtained data from The Cancer Genome Atlas (TCGA) dataset (https://gdc.cancer.gov/about-data/publications/pancanatlas) (https://portal.gdc.cancer.gov/) comprising 620 CRC cases (449 colon, 171 rectum) with available clinicopathological information [10, 11, 12].
Evaluation of cancer associated fibroblasts and immunohistochemistry
We evaluated aCAFs within stromal components using H&E‐stained whole‐slide images from both our cohort and the TCGA dataset.
aCAFs were identified based on characteristic morphological features including spindle‐shaped cell morphology with large, plump nuclei exhibiting irregular contours, prominent nucleoli, coarse and heterogeneous chromatin distribution, and elevated nuclear‐to‐cytoplasmic ratios (Figure 1). Representative high‐power images demonstrating these cytologic features of activated CAFs are shown in Figure 1C, D. In contrast, Figure 1E presents a high‐power image of inactivated CAFs, illustrating the distinct cytologic differences between activated and mature stromal fibroblasts. The remaining images demonstrate the architectural distribution of CAFs within the tumor stroma at lower magnification (Figure 1A, B, F–N). Inactivated CAFs displayed a monomorphic spindle morphology characterized by diminutive, thin, wavy, and slender nuclei with pale chromatin, indistinct nucleoli, and reduced nuclear‐to‐cytoplasmic ratios.
Histopathological characterization of the colorectal adenocarcinoma microenvironment representative microscopic images demonstrating: (A, B) Activated cancer‐associated fibroblasts (aCAFs) infiltrating between tumor cells (×200). (C) Higher magnification view of aCAFs traversing tumor cell clusters (×400). (D) High‐power view of aCAFs demonstrating large, oval, euchromatic nuclei with prominent nucleoli (×1,000). (E) Mature cancer‐associated fibroblasts exhibiting flattened morphology with small, hyperchromatic nuclei (×1,000). (F) Collagen fiber bundle deposition within the tumor stroma (×200). (G) Adjacent proper muscle tissue (×200). (H) Tumor‐infiltrating lymphocytes (TILs) (×200). (I) Neutrophilic abscess formation (×200). (J) Area of tumor necrosis (×200). (K) Spindle‐shaped tumor cell nuclei mimicking aCAF morphology (×400). (L) Large tumor cell aggregates lacking stromal components (×200). (M) Representative area of stroma‐poor tumor (×200). (N) Tumor cell clusters suspended within mucin pools (×400). (O) Immunohistochemical dual staining demonstrating CD8+ T cells (red) and CD4+ T cells (brown) (×400). All magnifications indicated represent total magnification (objective × eyepiece).
To ensure accurate identification, the following structures were excluded from aCAF assessment: (1) dense collagen fiber bundles, (2) mature fibroblasts with typical quiescent morphology, (3) thick collagen bundles, (4) smooth muscle tissue, (5) clusters of inflammatory cells including tumor‐infiltrating lymphocytes (TILs) and neutrophils, and (6) mucin pools.
Three pathologists (K‐WM, MJK, YCW), blinded to clinical and outcome data, independently evaluated each case by systematically assessing 10 representative high‐density cancer fields at ×100 magnification. These fields encompassed both the tumor mass center and the invasive front, including intratumoral and peritumoral stromal regions. A tumor was classified as aCAF‐positive when >10% of stromal cells across the evaluated fields demonstrated the aforementioned morphological features of fibroblasts. This semiquantitative threshold was established based on CAF assessment methodologies validated in other solid organ malignancies and was refined through consensus review among the three pathologists to ensure reproducibility despite inherent variability in stromal composition and tumor sampling areas [13, 14, 15].
A quantitative analysis of TILs was conducted at the leading edge of tumor invasion and within the intratumoral region, employing a high‐power field (original magnification ×400). Immunostaining for anti‐CD8 (clone 4B11, Leica Biosystems, Newcastle, UK) and anti‐CD4 (clone 4B12, Leica Biosystems, Newcastle, UK) was performed using the Bond Polymer Refine Detection System (Leica Biosystems, Newcastle Ltd., Newcastle, UK) according to the manufacturer's instructions (Figure 1O).
A comparative analysis of marker gene expression was conducted using RNA sequencing (RNA‐seq) data across three well‐characterized molecular subtypes of CAFs: myCAFs characterized by ACTA2, TAGLN, MMP11, HOPX, POSTN, TPM1, and TPM2 expression; iCAFs defined by IL6, IL8, PDGFRA, CXCL1, CXCL2, CXCL12, CCL2, CFD, DPT, LMNA, AGTR1, and HAS1 markers; and apCAFs distinguished by CD74, SLPI, SAA3P, HLA‐DRA, HLA‐DRB1, and CIITA expression [16, 17]. Based on this established molecular framework, we conducted a comprehensive evaluation of the molecular characteristics and gene expression patterns of morphologically identified aCAFs.
The TCGA cases were further stratified into two groups: senescent cancer‐associated fibroblasts (sCAFs; n = 22) and non‐senescent cancer‐associated fibroblasts (nsCAFs) (n = 120). This stratification was based on the expression of SASP‐related factors. The identified factors encompassed inflammatory cytokines (IL‐6, IL‐8) [18, 19] growth factors (VEGFA) [20, 21] chemokines (CCL2) [22] and proteases (MMP‐1, TIMP‐1) [20, 21]. Cases were classified as SASP‐positive when they showed high expression (above the mean values) in four or more of these six factors.
Functional enrichment analysis, in silico cytometry, and immune dysfunction
For biological interpretation, we investigated the Gene Ontology (GO) and the associations between various diseases and aCAF‐linked gene clusters by analyzing functional similarities across 620 cases of CRC from the TCGA dataset containing 20,514 mRNA sequences. We analyzed differentially expressed genes (DEGs) between patients with and without aCAFs using the EnhancedVolcano tool (https://github.com/kevinblighe/EnhancedVolcano). DEGs were identified using threshold criteria of p value <0.05 and false discovery rate <0.05. For semantic similarity analysis, we employed DOSE, an R/Bioconductor package that enables comprehensive exploration of molecular functions and their associated genes [23]. We conducted pathway analysis using three curated and peer‐reviewed databases: KEGG pathways (https://www.genome.jp/kegg), WikiPathways (data.wikipathways.org), and CellMarker (http://bio-bigdata.hrbmu.edu.cn/CellMarker) [24], allowing for thorough examination of molecular pathways [25].
In the TCGA dataset, we employed in silico cytometry using CIBERSORT for the analysis of leukocyte subsets [11]. Furthermore, we utilized the Tumor Immune Dysfunction and Exclusion (TIDE) tool to evaluate immune cell dysfunction [26].
Single‐cell RNA‐seq data processing and analysis
We obtained the processed single‐cell RNA‐seq dataset (GSE200997) from the Gene Expression Omnibus (GEO), which includes colorectal cancer tissues (n = 16) and paired normal samples (n = 7) [27]. The annotation file containing cell barcodes and metadata was loaded, and the raw Unique Molecular Identifier (UMI) count matrix was imported. Data preprocessing and downstream analyses were performed using the Seurat package (v4.0). Raw UMI counts were converted into a Seurat object with the following parameters: min.cells = 3 and min.features = 200. Normalization, variable feature selection (2,000 features), scaling, principal component analysis (PCA), and UMAP dimensionality reduction were subsequently applied. Cell clusters were annotated based on canonical marker expression: epithelial/tumor cells, stromal cells, and immune cells. For visualization, we generated UMAP plots to display cell‐type distributions in normal and tumor tissues. ACTA2 (Actin Alpha 2, α‐SMA) expression was further evaluated, and relative expression across major cell types was quantified.
Machine learning algorithms
We constructed predictive survival models using two machine learning (ML) algorithms: adaptive elastic net (AEN) based on linear regression [incorporating both lasso (L1) and ridge (L2) penalties] and gradient boosting machine (GBM) based on decision trees [28]. A survival prediction model was developed by integrating aCAFs with clinicopathological parameters, including T stage, age, sex, histological grade, lymphovascular invasion, and perineural invasion. The ML algorithms were applied to 404 cases of CRC from our cohort, which was stratified into training (70%) and validation (30%) sets [29].
In the case of the AEN, regularization was balanced using an alpha value of 0.5. The regularization strength was optimized through 10‐fold cross‐validation. Survival models were constructed by incorporating candidate genes to predict status (death or recurrence) and survival period. Model parsimony was achieved through variable selection, a process that involved the elimination of parameters with negligible weights. The performance of the model was evaluated using both nomograms and time‐dependent receiver operating characteristic (ROC) curves.
For the AEN, performance optimization was achieved by balancing lasso and ridge regularization with an alpha value of 0.5. The regularization strength was determined through 10‐fold cross‐validation, ensuring a balanced representation of aCAFs in each fold. The GBM implementation utilized a learning algorithm that autonomously selected and combined multiple covariates based on multivariate Bernoulli models. Hyperparameter optimization, including learning rate adjustment, was performed for each combination of selected covariates and learning algorithm using grid‐search cross‐validation across predefined ranges. The final optimal models were subsequently trained using the selected covariates and optimized hyperparameters. Model performance for the GBM algorithm was evaluated using ROC curves. To assess the contribution of each candidate gene to the survival prediction models (affecting survival probability and Cox risk score values), we utilized SHapley Additive exPlanation (SHAP) [30].
Statistical analysis
Statistical analyses were performed as follows: correlations between clinicopathological parameters and aCAF presence were evaluated using the χ ^2^ test, while continuous variables were compared using Student's t‐test. Survival analyses were conducted using the Kaplan–Meier method with log‐rank test comparisons. Independent prognostic markers for survival were identified through multivariate Cox regression analyses. Inter‐observer reproducibility for aCAF assessment was evaluated using Fleiss’ κ statistics, which quantifies the degree of agreement among multiple raters beyond chance alone [31]. Statistical significance was defined as a two‐sided p value <0.05. All analyses were performed using R and SPSS Statistics software (version 25, IBM Corporation, Armonk, NY, USA).
Results
Inter‐observer reproducibility of aCAF assessment
To validate the robustness of morphological criteria for aCAF identification, inter‐observer agreement among three independent pathologists was quantified using Fleiss' κ statistics. In the institutional cohort (n = 404), substantial agreement was achieved with κ = 0.775 (p < 0.001) (supplementary material, Table S1). External validation in the TCGA cohort (n = 620) demonstrated almost perfect agreement with κ = 0.82 (p < 0.001) (supplementary material, Table S2). These findings confirm that semiquantitative identification of aCAFs based on defined morphological criteria is highly reproducible across independent observers and geographically distinct patient populations.
Clinicopathological characteristics and survival outcomes associated with aCAFs and sCAFs
Among the 404 patients analyzed in our cohort, aCAFs were identified in 99 cases (24.5%), while 305 cases (75.5%) were aCAF‐negative. The presence of aCAFs was significantly associated with adverse clinicopathological features, including advanced age, higher T and N stages, high histological grade, LVI, PNI, and tumor necrosis (all p < 0.05) (Table 1). Kaplan–Meier survival analyses revealed that patients with aCAF‐positive tumors demonstrated significantly inferior disease‐free survival (DFS) (p = 0.005) and overall survival (OS) (p < 0.001) compared to aCAF‐negative cases (Figure 2A). These associations persisted in multivariate Cox regression analysis after adjusting for age, sex, T stage, histological grade, LVI, PNI, and tumor necrosis (DFS: p = 0.042; OS: p = 0.001) (Table 2).
Survival outcomes and immune profile analysis. (A) Kaplan–Meier analysis of overall survival and disease‐free survival stratified by activated cancer‐associated fibroblast (aCAF) status in the study cohort. (B) Overall survival and disease‐specific survival curves from The Cancer Genome Atlas (TCGA) cohort stratified by aCAF presence. (C) Survival analyses (overall, disease‐specific, disease‐free, and progression‐free survival) in the TCGA cohort comparing non‐senescent CAFs (nsCAFs) versus senescent CAFs (sCAFs). (D) Comparative analyses of CD4+ and CD8+ T cell densities per high‐power field (HPF) between aCAF‐positive and aCAF‐negative groups in our cohort, with corresponding CD8+ T cell and memory CD4+ T cell fractions in the TCGA dataset. (E) Distribution of memory B cell fractions, CD274 (PD‐L1 coding gene) expression levels, tumor immune dysfunction and exclusion (TIDE) scores, and immunotherapy response patterns in the TCGA dataset. (F) Expression profiles of aCAF‐associated biomarkers, including ACTA2 (α‐smooth muscle actin‐encoding gene), FAP (fibroblast activation protein‐α), PDGFRA/PDGFRB (platelet‐derived growth factor receptor α/β), and VIM (vimentin‐encoding gene) in the TCGA.
To validate the clinicopathological significance of aCAFs in an independent cohort, we analyzed data from TCGA CRC dataset (n = 617). Consistent with our institutional cohort, aCAF‐positive tumors in the TCGA cohort were significantly associated with advanced T stage, higher N stage, LVI, PNI, and prominent tumor necrosis (all p < 0.05), though no significant differences were observed in patient age or tumor size between groups (supplementary material, Table S3). Survival analysis confirmed that aCAF positivity was significantly associated with reduced disease‐specific survival (DSS) and OS (both p < 0.001) (Figure 2B). In multivariate Cox regression analysis, aCAFs remained an independent adverse prognostic factor for both DSS and OS (both p < 0.001) (supplementary material, Table S4).
Among the 142 TCGA cases with aCAF‐positive tumors, the subset demonstrating sCAFs exhibited significantly worse clinical outcomes compared to those with nsCAFs, including decreased OS (p = 0.021), DSS (p = 0.007), DFS (p = 0.027), and progression‐free survival (PFS) (p = 0.017) (Figure 2C).
Characteristics of aCAFs and associated immune response
Analysis of immune parameters revealed significant correlations between the presence of aCAFs and reduced infiltration of both CD8+ T cells and CD4+ T cells (p = 0.026 and <0.001, respectively) in our cohort. These findings were corroborated in the TCGA dataset, where the presence of aCAFs significantly correlated with decreased CD8+ T cell fraction, reduced memory B cell fraction, and elevated TIDE scores (all p < 0.05). Furthermore, patients with aCAFs demonstrated a higher frequency of non‐response to immunotherapy compared to those without aCAFs (p = 0.05). Among established aCAF‐associated biomarkers (ACTA2, FAP, PDGFR‐α/β, and VIM), ACTA2, which encodes α‐smooth muscle actin, showed significantly elevated expression in aCAF‐positive patients (p = 0.01) (Figure 2D–F).
Transcriptomic analysis of the TCGA dataset, encompassing RNA sequencing data from 620 patients with 20,514 genes, was performed to identify DEGs between patients stratified by aCAFs status. Among the total gene set, 4,859 genes demonstrated significant differential expression, with 1,210 genes showing upregulation and 3,649 showing downregulation (Figure 3A). Gene Set Enrichment Analysis (GSEA) identified several significantly enriched biological pathways. The analysis showed enrichment of gene signatures associated with dendritic cell markers (TRAVAGLINI LUNG IGSF21 DENDRITIC CELL), soft tissue tumor progression (NAKAYAMA SOFT TISSUE TUMORS PCA1 UP), and cellular responses to oxidative stress (WP OXIDATIVE DAMAGE RESPONSE). Additionally, there was significant enrichment of cancer‐related pathways, including small cell lung cancer signatures (WP SMALL CELL LUNG CANCER) and p53 signaling pathway components (KEGG P53 SIGNALING PATHWAY). The analysis also revealed enrichment of genes downregulated in the late cellular stress response (CSR LATE UP.V1 DN). These findings suggest potential mechanistic links between activated cancer‐associated fibroblasts and multiple cancer‐promoting and stress‐response pathways (Figure 3B).
Bioinformatic analysis of activated cancer‐associated fibroblasts (aCAFs)‐associated molecular signatures. (A) Differential gene expression analysis revealing aCAFs‐specific transcriptional signatures. (B) Gene set enrichment analysis (GSEA) using MSigDB, highlighting significant pathways. (C, D) Functional enrichment analysis and hierarchical tree plot based on the Kyoto Encyclopedia of Genes and Genomes (KEGG) pathways. (E) Over‐representation analysis utilizing Wiki Pathways database. (F) Cell type–specific over‐representation analysis based on CellMarker database. (G) Distribution and expression of ACTA2 in normal and tumor colorectal tissues. UMAP visualization of single‐cell populations from normal colorectal tissue, classified into epithelial, immune, stromal, and unknown groups (left). ACTA2 expression is shown in red, primarily localized to stromal cells (middle). Bar plot indicates significantly higher expression of ACTA2 in stromal cells compared to other cell types (right). (H) UMAP plots of colorectal cancer tissue showing tumor, immune, stromal, and unknown cell populations (left). ACTA2 expression is enriched in stromal cells with minor expression in tumor and immune compartments (middle). Bar plot demonstrates an overall increase in ACTA2 expression in tumor‐associated stromal cells compared to stromal cells in normal tissue (right).
A Kyoto Encyclopedia of Genes and Genomes (KEGG) module analysis revealed an overrepresentation of aCAFs‐related genes in ascorbate and aldarate metabolism, chemical carcinogenesis via DNA adducts, and drug metabolism (Figure 3C, D). Wiki Pathway over‐representation analysis demonstrated significant enrichment of aCAF‐related genes in multiple signaling cascades, including proinflammatory and profibrotic mediator pathways, GABA receptor signaling, and glucuronidation pathways (Figure 3E). CellMarker over‐representation analysis identified significant enrichment of aCAFs‐related genes in markers characteristic of diverse cell populations, notably adipocytes, neurons, and Th2 cells (Figure 3F).
Gene expression analysis of aCAFs revealed significantly higher levels of ACTA2, TAGLN, MMP11, HOPX, POSTN, TPM1, and TPM2 (all p < 0.05), which is consistent with the molecular signatures of myCAFs rather than iCAFs or apCAFs. However, no significant differences were observed for iCAFs or apCAF markers (data not shown).
To investigate the cellular distribution of ACTA2 expression, we analyzed scRNA‐seq data from the GSE200997 dataset. In normal colorectal tissue, cell clusters were classified into epithelial, immune, and stromal groups. ACTA2 expression was predominantly observed in stromal cells, with minimal expression in epithelial and immune populations (Figure 3G). In colorectal cancer tissue, cell clusters were categorized into tumor, immune, and stromal compartments. Consistent with normal tissue, ACTA2 was mainly expressed in stromal cells, with low‐level expression detected in tumor and immune subsets (Figure 3H). Notably, the overall expression level of ACTA2 was slightly elevated in stromal cells from tumor tissue compared to normal stromal cells.
Survival prediction of aCAFs using machine learning
A survival prediction model was developed using the AEN, incorporating aCAFs status, age, sex, T stage, lymphovascular invasion, and histological grade. During the machine learning process, while the ‘age’ factor was excluded from the DFS nomogram, it remained a significant component in the OS nomogram. For the OS prediction (5‐year survival), the model incorporating aCAFs demonstrated superior performance with a mean area under the curve (AUC) of 0.756 (range: 0.674–0.756) in the training set and 0.742 (range: 0.675–0.742) in the validation set, compared to the model without aCAFs, which achieved AUCs of 0.755 (range: 0.683–0.755) and 0.748 (range: 0.688–0.748) in the training and validation sets, respectively (Figure 4A). Similarly, for DFS prediction, the aCAFs‐inclusive model showed enhanced performance with mean AUCs of 0.750 (range: 0.678–0.751) in the training set and 0.701 (range: 0.560–0.715) in the validation set, surpassing the model without aCAFs, which achieved AUCs of 0.734 (range: 0.663–0.739) and 0.690 (range: 0.521–0.730) in the training and validation sets, respectively (Figure 4B).
Predictive Modeling and Drug Response Analysis. (A) Nomogram for overall survival prediction using adaptive elastic net regression (upper panel) and time‐dependent ROC curve comparison of models with and without activated cancer‐associated fibroblasts (aCAFs) parameters (lower panels). (B) Nomogram for disease‐free survival prediction using adaptive elastic net regression (upper panel) and time‐dependent ROC curve comparison of models with and without aCAFs parameters (lower panels). (C, D) Development and validation of gradient boosting machine learning models with and without aCAF parameters. Training progression curves comparing aCAF‐inclusive and aCAF‐exclusive models. SHAP (SHapley Additive exPlanations) value analysis demonstrating the relative contribution of individual parameters to overall survival (OS) and disease‐free survival (DFS) prediction. Model performance assessment using receiver operating characteristic (ROC) curves based on multivariate Bernoulli distribution.
The survival prediction models using the GBM further confirmed the superior predictive capability of models that incorporate aCAFs. The OS model incorporating aCAFs achieved a mean AUC of 0.826, compared to 0.803 for the model without aCAFs (Figure 4C). This pattern was consistently observed in the DFS model, where the aCAFs‐inclusive model achieved a mean AUC of 0.773 compared to 0.765 for the model without aCAFs. Among all clinicopathological variables analyzed, age emerged as the strongest predictor for OS, while lymphovascular invasion demonstrated the highest predictive value for DFS (Figure 4D).
Discussion
This study diverges from previous research in that it focuses on aCAFs, which exhibit distinct histopathological findings among intra‐ and peritumoral stromal components. A critical consideration in establishing such morphology‐based CAF classification is the reproducibility of histological assessment. In this study, aCAF identification was performed independently by three board‐certified pathologists blinded to clinical outcomes, and Fleiss' κ analysis demonstrated substantial inter‐observer agreement in both cohorts. The 10% threshold for aCAF positivity, derived from established semiquantitative CAF assessment methods, showed high reproducibility and consistent associations with adverse clinical outcomes, validating its practical utility despite the inherent semiquantitative nature of stromal evaluation.
Based on this reproducible histopathological classification, we investigated the associations between aCAF status and clinical outcomes as well as immune responses in CRC. aCAFs were associated with unfavorable outcomes, including reduced CD8+ T‐cell infiltration, elevated TIDE scores, and an impaired response to immunotherapy, findings that were validated in two independent cohorts. Furthermore, SASP‐based stratification revealed that sCAFs were linked to worse survival compared to nsCAFs.
CAFs exert immunosuppressive effects through multiple mechanisms. Previous studies have demonstrated that CAFs secrete cytokines such as TGF‐β and IL‐6, which inhibit CD8+ T‐cell recruitment and activation while fostering an immunosuppressive microenvironment [32]. Additionally, CAFs contribute to extracellular matrix remodeling, creating physical barriers that impede immune cell infiltration [33]. Recent studies in breast cancer models have demonstrated that CAF‐rich tumors generate an immunologically cold microenvironment by excluding CD8+ T‐cells, mediated in part by the CAF receptor Endo180 (MRC2), which is predominantly expressed on myCAFs [34]. Deletion of MRC2 reduces αSMA‐expressing CAFs, promotes CD8+ T‐cell infiltration, and enhances responses to immune checkpoint blockade. Consistent with these findings, high MRC2 expression in human tumors correlates with poor response to anti‐PD‐1 therapy. Additional mechanisms include FAP+ CAF‐derived CXCL12 and stromal TGF‐β signaling, both of which restrict CD8+ T‐cell infiltration and attenuate responses to checkpoint blockade [35, 36]. In our study, aCAF presence was associated with reduced CD8+ T‐cell infiltration and elevated TIDE scores, consistent with these reported immunosuppressive mechanisms and supporting their role in resistance to immunotherapy.
The molecular characterization of morphologically identified aCAFs in our study revealed signatures closely resembling myCAFs [37]. These cells, characterized by high nuclear‐to‐cytoplasmic ratios and prominent nucleoli resembling primitive immature fibroblasts, exhibited substantial upregulation of ACTA2 (α‐SMA), a pivotal regulator of immunosuppression and tumor progression [38]. Although ACTA2 is traditionally regarded as a canonical marker of myofibroblasts, emerging evidence indicates that carcinoma cells undergoing TGF‐β‐driven epithelial‐mesenchymal transition can also upregulate ACTA2 [39]. This upregulation enhances contractile activity [40], facilitating mechanical activation of latent TGF‐β1 through integrin‐mediated pathways [41]. The contractile force generated by α‐SMA‐positive cells thus plays a central role in propagating fibrogenic signaling, establishing myofibroblasts as the major activated fibrogenic cell population in both wound repair and pathological stromal remodeling [42]. GSEA analysis further revealed that aCAF‐related genes were enriched in pathways regulating oxidative damage response, cancer‐related signaling, and the p53 pathway, with functional enrichment in chemical carcinogenesis, P450‐linked metabolism, and proinflammatory mediators, collectively highlighting their tumor‐promoting and immunosuppressive effects.
Our findings align with previous reports demonstrating that CAF risk signatures predict poor survival and reduced CD8+ T‐cell infiltration in CRC [3], and that FAP‐positive CAFs suppress CD8+ T‐cell‐mediated immunity, leading to worse clinical outcomes [43]. While most CAFs promote immunosuppression [44], certain subsets may paradoxically enhance immune activation under specific conditions [45]. Our classification of aCAFs into sCAFs and nsCAFs based on SASP expression revealed that sCAFs were linked to a poorer prognosis, challenging the conventional view that senescence exclusively suppresses tumor growth [8, 46]. This observation underscores the complexity of CAF biology and the need for refined classification systems.
Given the functional heterogeneity of CAFs and their diverse clinicopathological implications [47], detailed subclassification is essential for comprehensive understanding of their roles in tumor progression [48]. Our study addresses this need by integrating histological and molecular assessments to define aCAF subpopulations that exhibit molecular characteristics of myCAFs. By demonstrating that machine learning models incorporating aCAF status improve survival prediction, our findings provide a framework for incorporating morphologically defined CAF subtypes into prognostic algorithms and potentially therapeutic stratification in CRC.
This study has several limitations. First, the retrospective design may introduce confounding variables and selection bias, limiting generalizability. While the historical cohort minimized confounding from evolving therapies, this may limit applicability to contemporary treatment settings. Second, while aCAF identification was performed independently by three pathologists with substantial inter‐observer agreement, the assessment was based solely on morphological criteria using H&E‐stained sections without additional immunohistochemical or molecular validation. Third, functional validation of aCAF‐mediated immune suppression through experimental studies was not undertaken, leaving the observed association with reduced CD8^+^ T‐cell infiltration largely correlative. Fourth, the prognostic improvement from incorporating aCAFs into machine learning models was modest, and formal statistical comparison between models was not performed.
In summary, we explored the clinicopathological significance of aCAFs in CRC, focusing on their unique histopathological characteristics among various CAF subtypes previously described in the literature. We analyzed their impact on survival by elucidating various mechanisms through bioinformatics and developing predictive survival models using machine learning approaches. Notably, patients with aCAFs exhibiting SASP characteristics demonstrated significantly poorer survival outcomes compared to those without these features. The identification of aCAFs as a potential prognostic biomarker offers promising implications for personalized therapeutic strategies, including refined approaches to immunotherapy and targeted molecular interventions. Further experimental validation and prospective clinical studies are necessary to translate these findings into meaningful clinical applications.
Author contributions statement
Conception and design: K‐WM, Y‐KN. Data acquisition: O‐ZK, BKS, JKJ, SWL, HSM, HSK, MJK, SHL. Data analysis/interpretation: K‐WM, Y‐KN. Writing – original draft: K‐WM, MS, O‐ZK. Supervision and critical review of the manuscript: K‐WM, Y‐KN. Final approval of submission: all.
Supporting information
Figure S1. Schematic representation of the study design and workflow Table S1. Interobserver assessment of aCAFs presence among three pathologists in our cohort Table S2. Interobserver assessment of aCAFs presence among three pathologists in the TCGA dataset Table S3. Correlation between clinicopathological parameters and activated cancer‐associated fibroblasts in the TCGA dataset Table S4. Disease‐specific survival and overall survival analyses according to activated cancer‐associated fibroblasts in the TCGA dataset
The reference list from the paper itself. Each links out to its DOI / PubMed record.
- 1Zheng H , Liu H , Ge Y , et al. Integrated single‐cell and bulk RNA sequencing analysis identifies a cancer associated fibroblast‐related signature for predicting prognosis and therapeutic responses in colorectal cancer. Cancer Cell Int 2021; 21: 552.34670584 10.1186/s 12935-021-02252-9PMC 8529760 · doi ↗ · pubmed ↗
- 2Fleming M , Ravula S , Tatishchev SF , et al. Colorectal carcinoma: pathologic aspects. J Gastrointest Oncol 2012; 3: 153–173.22943008 10.3978/j.issn.2078-6891.2012.030PMC 3418538 · doi ↗ · pubmed ↗
- 3Lv Y , Hu J , Zheng W , et al. A WGCNA‐based cancer‐associated fibroblast risk signature in colorectal cancer for prognosis and immunotherapy response. Transl Cancer Res 2023; 12: 2256–2275.37859738 10.21037/tcr-23-261PMC 10583018 · doi ↗ · pubmed ↗
- 4Hu S , Qin J , Gao R , et al. Integrated analysis of single cell and bulk RNA sequencing identifies CTHRC 1(+) INHBA(+) CAF as drivers of colorectal cancer progression. Mol Carcinog 2023; 62: 1787–1802.37539967 10.1002/mc.23615 · doi ↗ · pubmed ↗
- 5Kasashima H , Fukui Y , Kitayama K , et al. The role of cancer‐associated fibroblasts in modulating tumor immunity in colorectal cancer. Gan To Kagaku Ryoho 2023; 50: 958–959.37800287 · pubmed ↗
- 6Zhong B , Cheng B , Huang X , et al. Colorectal cancer‐associated fibroblasts promote metastasis by up‐regulating LRG 1 through stromal IL‐6/STAT 3 signaling. Cell Death Dis 2021; 13: 16.34930899 10.1038/s 41419-021-04461-6PMC 8688517 · doi ↗ · pubmed ↗
- 7Cords L , Tietscher S , Anzeneder T , et al. Cancer‐associated fibroblast classification in single‐cell and spatial proteomics data. Nat Commun 2023; 14: 4294.37463917 10.1038/s 41467-023-39762-1PMC 10354071 · doi ↗ · pubmed ↗
- 8Coppe JP , Desprez PY , Krtolica A , et al. The senescence‐associated secretory phenotype: the dark side of tumor suppression. Annu Rev Pathol 2010; 5: 99–118.20078217 10.1146/annurev-pathol-121808-102144 PMC 4166495 · doi ↗ · pubmed ↗