Multilevel associations between prostate cancer testing and socioeconomic position: a population-based register study from Stockholm, Sweden
Balram Rai, Marta Rado, Anna Sara Oberg, Ralf Kuja-Halkola, Mark S Clements

TL;DR
This study shows that prostate cancer testing rates are linked to both personal and area-level income and education, with higher testing in wealthier areas.
Contribution
The study quantifies how socioeconomic factors at multiple levels explain spatial variation in prostate cancer testing.
Findings
Men with higher education had 22% higher odds of PSA testing compared to those with less than 9 years of education.
Income explained 42% of the spatial variation in PSA testing at the area level.
The highest PSA testing rates were observed in men aged 70–79 with the highest income.
Abstract
Prostate cancer testing is associated with both individual and area-level socioeconomic position (SEP), but the multilevel nature of this association is unclear and contribution of SEP to the spatial variation is unknown. This study investigated the association of widespread opportunistic prostate-specific antigen (PSA) testing with SEP measures and quantified the extent to which multilevel measures of SEP contributed to the observed spatial variation in PSA testing. A population-based register study was conducted, encompassing 471 335 men aged 40 years and older without a prior prostate cancer diagnosis residing in the Stockholm region in 2016. We used hierarchical Bayesian logistic regression models with spatial random effects to estimate the associations between PSA testing and SEP measures. Men aged 70–79 in the highest income quartile had the highest proportion (35.2%, 95% CI…
Genes, proteins, chemicals, diseases, species, mutations and cell lines named across the full text — each resolved to its canonical identifier and authoritative record.
Click any figure to enlarge with its caption.
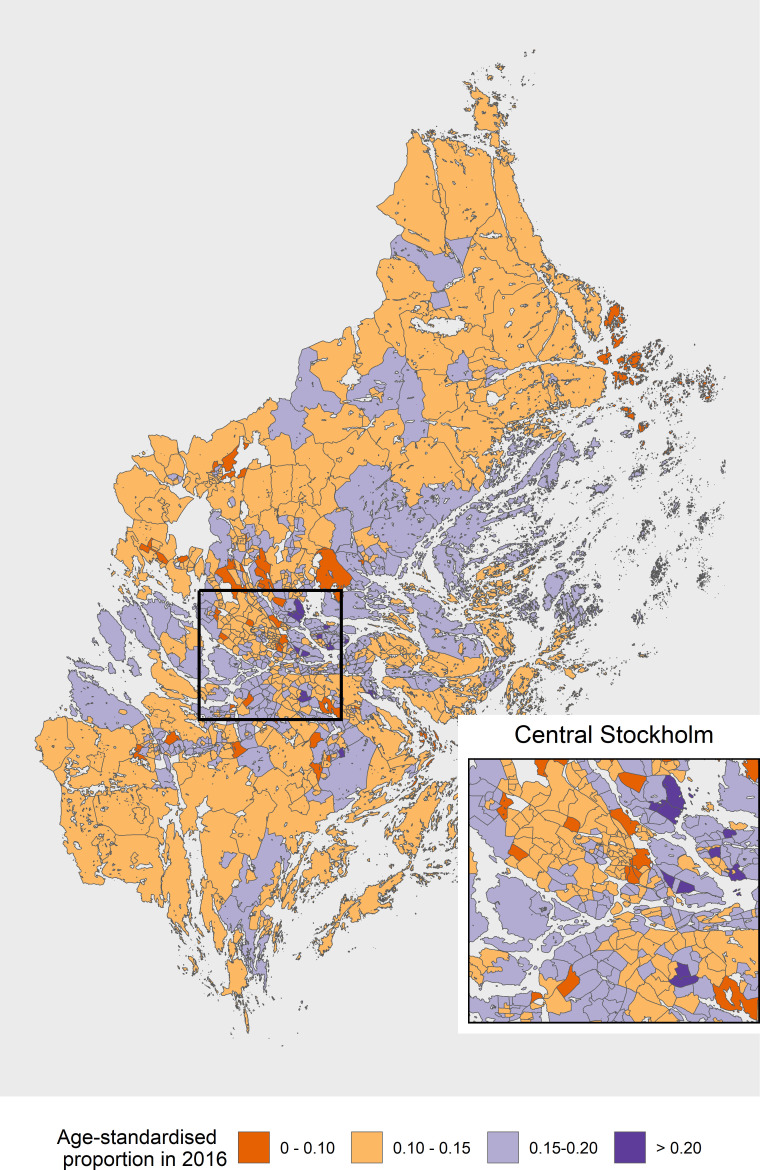 Figure 1
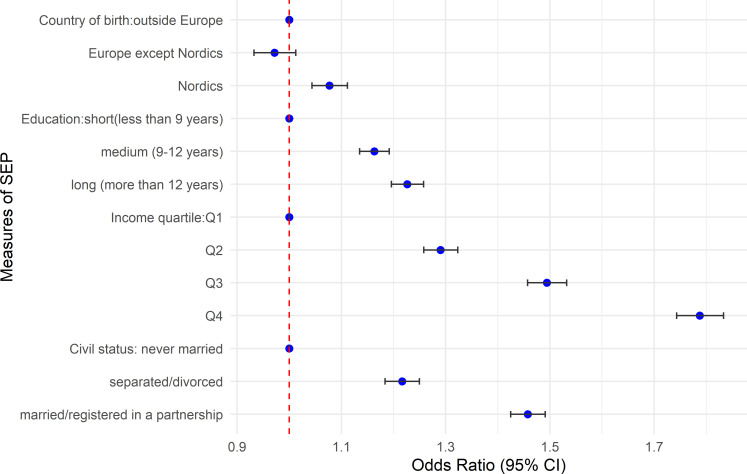 Figure 2
| SEP | 40–49 | 50–59 | 60–69 | 70–79 | 80+ | Total |
|---|---|---|---|---|---|---|
| N (%) | N (%) | N (%) | N (%) | N (%) | N (%) | |
| Country of birth | ||||||
| Outside Europe | 20 733 (4.5) | 17 081 (12.4) | 9579 (19.5) | 2915 (23.4) | 756 (20.9) | 51 064 (11.3) |
| Europe except Nordics | 14 738 (4.2) | 11 154 (11.7) | 7932 (20.6) | 5488 (25.6) | 2190 (21.6) | 41 502 (13.1) |
| Nordics | 115 451 (5.1) | 104 264 (14.4) | 78 730 (22.2) | 56 728 (28.3) | 23 414 (23.2) | 378 586 (15.8) |
| Education | ||||||
| Short (less than 9 years) | 14 894 (4.7) | 18 802 (12.1) | 18 038 (18.2) | 15 089 (23.7) | 7833 (20.3) | 74 655 (15.3) |
| Medium (9–12 years) | 60 460 (5.0) | 56 539 (14.1) | 38 810 (21.0) | 26 625 (27.5) | 10 563 (22.9) | 192 997 (15.0) |
| Long (more than 12 years) | 75 857 (4.9) | 57 273 (14.3) | 39 614 (24.1) | 23 440 (30.9) | 7961 (25.8) | 204 145 (15.1) |
| Income | ||||||
| Q1 (lowest quartile) | 37 368 (3.8) | 33 206 (9.7) | 24 180 (16.1) | 16 287 (21.6) | 6572 (19.4) | 117 614 (11.3) |
| Q2 | 37 510 (4.9) | 32 969 (13.1) | 24 153 (20.2) | 16 294 (25.2) | 6589 (21.9) | 117 516 (14.1) |
| Q3 | 37 740 (5.0) | 33 169 (15.4) | 24 056 (23.3) | 16 289 (29.4) | 6571 (23.1) | 117 825 (16.0) |
| Q4 (highest quartile) | 37 623 (6.1) | 33 080 (17.5) | 24 099 (27.4) | 16 273 (35.2) | 6572 (27.8) | 117 646 (18.9) |
| Civil status | ||||||
| Never married | 54 698 (4.3) | 39 036 (11.2) | 20 175 (16.6) | 7907 (20.5) | 1581 (18.6) | 123 396 (9.7) |
| Separated/divorced | 17 019 (5.2) | 25 217 (13.8) | 22 036 (19.7) | 16 647 (25.2) | 9842 (20.2) | 90 761 (16.4) |
| Married/registered in partnership | 79 302 (5.3) | 68 290 (15.5) | 54 245 (24.5) | 40 543 (30.4) | 14 886 (25.4) | 257 266 (17.2) |
| Measures of SEP | Model specification for SEP at different levels | |||||
|---|---|---|---|---|---|---|
| Individual level | Area level | Individual+area level | ||||
| Proportion | Model fit | Proportion | Model fit | Proportion | Model fit | |
| Income | 32.4 | −183 923 | 42.0 | −184 864 | 41.8 | −183 894 |
| Education | 9.1 | −184 885 | 28.5 | −184 912 | 28.7 | −184 824 |
| Country of birth | 4.0 | −184 983 | 18.4 | −184 945 | 18.3 | −184 942 |
| Civil status | 14.3 | −184 432 | 38.5 | −184 876 | 37.9 | −184 358 |
| All measures | 37.5 | −183 577 | 49.5 | −184 859 | 49.5 | −183 562 |
- —Swedish Prostate Cancer Foundation (Prostatacancerförbundet)
- —http://dx.doi.org/10.13039/501100000780European Commission
- —Swedish eScience Research Centre
- —Swedish Research Council (Vetenskapsrådet)
- —http://dx.doi.org/10.13039/501100002794Cancerfonden
Peer Reviews
No public reviews on file for this paper yet. If you reviewed it on a platform where reviews are public (OpenReview, ICLR, NeurIPS, ICML), you can paste yours below so the community can read it here.
Videos
No videos yet. Explain this paper in a talk, walkthrough, or lecture? Add one.
Taxonomy
TopicsProstate Cancer Diagnosis and Treatment · Global Cancer Incidence and Screening · Data-Driven Disease Surveillance
Introduction
Prostate cancer is the second most common cancer worldwide after lung cancer, and the most common cancer in Europe among men.1 In Sweden, around 10 000 new prostate cancer cases are diagnosed every year, and around 2500 deaths are attributed to prostate cancer.2 In 2022, the 10-year prevalence for prostate cancer in Sweden was 1637 per 100 000 males.3 Screening for cancer is one of the primary methods for early detection in a population. The prostate-specific antigen (PSA) test is the most common test used for early detection and management of prostate cancer. Using the PSA test for screening has both potential harms and benefits.4 5 PSA testing is associated with reduced prostate cancer mortality but with a risk of overdiagnosis.6 7 The PSA test is not highly specific to detect prostate cancer, as the PSA levels could be elevated due to causes other than prostate cancer, such as benign prostatic hyperplasia and subclinical prostatic inflammation.8
In 2018, the Swedish National Board of Health and Welfare recommended against population-based PSA screening for prostate cancer, which aligned with previous recommendations against PSA-based screening including the US Preventive Service Task Force.9 Despite these recommendations and uncertainty around PSA testing, PSA testing has been very common in the Stockholm region.10 The European Council recently recommended that member states consider a stepwise approach for organised prostate cancer testing (OPT).11 In 2022, the Swedish Social Department recommended that health regions investigate possible approaches to OPT. Following this recommendation, most of the regions in Sweden, including the Stockholm region, have introduced OPT pilot studies using PSA in combination with MRI, where men are informed about the potential harms and benefits of testing.12
Men with lower individual-level socioeconomic position (SEP) are at an increased risk of prostate cancer mortality, mostly due to diagnostic delay and poorer prognosis.13 At an area level, international reviews have found substantial geographical variation in prostate cancer outcomes, with lower SEP areas having lower prostate cancer incidence and higher mortality rates.14 15 In Sweden, an association of neighbourhood deprivation with prostate cancer incidence and mortality suggests the possibility of contextual effects on these outcomes.16 17 Socioeconomic disparities in prostate cancer incidence and mortality could be partially attributed to differences in the uptake of PSA testing at both an individual and an area level. Therefore, this highlights the importance of describing and understanding the socioeconomic disparities in testing to reduce the disparities in incidence and mortality.
Individual-level associations of PSA testing with multiple measures of SEP have been explored in previous studies.1820 Studies have also focused on the association of PSA testing using specific individual-level measures of SEP, such as education,21 22 income23 and ethnicity.24 25 A handful of studies have explored associations between PSA testing and area-level SEP.26 27 Studies on health equity account for multilevel measures of SEP preferably using a hierarchical/multilevel model28; however, such evidence is lacking for the associations between prostate cancer testing and SEP. Furthermore, few studies have explored the spatial heterogeneity in prostate cancer testing,29 30 and little is known as to the extent that individual-level or area-level SEP explain the spatial heterogeneity.
The aims of this study were to investigate multilevel associations of SEP with opportunistic prostate cancer testing and to examine the proportion of spatial variance which was explained by SEP. Specifically, we quantified the proportion of spatial variance explained by different measures of SEP; income, education, country of birth and civil status. We hypothesised that (a) there would be moderate associations between opportunistic prostate cancer testing and individual-level SEP even after controlling for area-level SEP and (b) measures of individual and area-level SEP would substantially explain any spatial variation in testing.
Data and methods
Data sources
Data on PSA testing were obtained from the Stockholm PSA and Biopsy Register which collects data from the three laboratories that analyse PSA tests performed in the Stockholm region. The three laboratories are Karolinska University Laboratory (KUL), Aleris and Unilabs, who analyse all PSA tests done in the Stockholm region. KUL analyses around 60% of all PSA tests performed, followed by 20% each by Aleris and Unilabs.
These data were further linked to health and population registers for information on date of birth, area of residence, internal (in/out of Stockholm region within Sweden) and external migration (in/out of Sweden), cancer diagnosis and measures of SEP, using the unique identification number assigned to all residents in Sweden. The population for this study was men aged 40 years and above without a prior prostate cancer diagnosis and living in the Stockholm region in 2016.
Small areas
We used SAMS (Small Area Marketing Statistics) as the small areas, a regional classification system provided by Statistics Sweden which identifies small areas in Sweden. The areas were defined based on digital boundaries by Statistics Sweden, which used a method that was similar to that used for postal codes. There were 9200 SAMS areas in Sweden, including 890 areas in the Stockholm region. These areas had been previously used to analyse the neighbourhood or area-level effects on prostate cancer incidence17 and mortality.16
Socioeconomic position
SEP is a construct to identify the socioeconomic conditions of individuals and areas which affect health outcomes31 including cancer.32 SEP can be measured through different measures at the individual level (compositional) and the area level (contextual).28 The SEP measures used in this study were country of birth, education, income and civil status extracted from the STATIV database, which is a longitudinal database for integration studies from Statistics Sweden. The choice of SEP measures was based on previous empirical evidence on the associations with prostate cancer testing and availability of data.
Country of birth was categorised as Nordic countries (Sweden, Denmark, Finland, Norway and Iceland), Europe except Nordics and outside Europe. We grouped the Nordic countries because we expected their health systems to be similar and hence also their healthcare seeking behaviour. Education was expressed in terms of completed educational length in years, categorised into: short (less than or equal to 9 years); medium (>9 and ≤12 years); and long (>12 years). The categorisation for education was based on Swedish education nomenclature which is called Svensk utbildningsklassifikation. This classification had been aligned with the international classification ISCED 97 (International Standard Classification of Education). Income was represented as the individual annual disposable income (income after tax deduction). Due to a strong association between income and age, we created age-specific income quartiles by 10-year age groups (age groups 40–49, 50–59, 60–69, 70–79, 80+), where Q1 corresponded to lowest income quartile and Q4 to highest income quartile. We included civil status under a broad definition for SEP based on earlier evidence on an association with testing.33 Civil status was categorised as (1) never married or registered in a partnership, (2) separated/divorced and (3) married or registered in a partnership. Area-level SEP was measured as the proportion of men in each category of these measures at the small area level (eg, the proportion of income quartile Q1 in an area, and the proportion of men with lower education in an area).
Statistical analysis
We reported the proportion of men without a prior prostate cancer diagnosis having at least one PSA test in 2016 by all the measures of SEP and by 10-year age-groups (40–49, 50–59, 60–69, 70–79, 80+). Bayesian logistic regression was used to model the proportion of men having a PSA test. The individual-level associations of PSA testing with the measures of SEP were estimated using ORs with 95% CI. For the main findings, the ORs for SEP were conditional on age and marginal for unmodelled covariates. In a sensitivity analysis, the ORs were conditional on age and other SEP measures and were marginal over the unmodelled covariates. We estimated the proportion of spatial variance explained in PSA testing by different measures of SEP. The proportion of spatial variance was calculated in three steps: (a) including SEP at the individual level; (b) including SEP at the small area level and (c) including both individual and area-level SEP simultaneously.
Spatial model
The traditional BYM (Besag, York and Mollie) model used for spatial disease mapping does not allow us to independently interpret the spatially structured component (local or spatially correlated) of variance and the unstructured component (global or independent random) due to confounding and scale dependence. We used a reparameterisation of the BYM model which allowed for an easy and scale-independent interpretation of the hyperparameters.34 Further, we used some penalised complexity priors to avoid overfitting, by penalising the model for deviations from the base model (no spatial structure) until there was enough support for a complex model, especially in small areas with limited data.35 Let represent a binary outcome for a man indexed by within area takes a PSA test following a Bernoulli distribution denoted by where represents the probability for a man in area to have a PSA test in the study population. We then modelled for this probability using a logistic function
where and were the vectors of coefficients for covariates at the individual-level and the area-level, was the spatially structured component of the random effect, and was the unstructured global random effects, which were independent between areas. The random effects were reparametrised as
where was the mixing parameter suggesting the attributable fraction to spatial component of the random effects (for example, = 0 suggests no spatial component), and where represented the total precision (inverse of total variance).
The were modelled using a scaled conditional autoregressive distribution with spatial weight matrix . The spatial weight matrix was constructed using queen’s contiguity, where each area borrows strength from all the other areas with which it shares any boundary.36 Queen contiguity was preferred over other approaches to avoid the restrictive interaction in rook contiguity approach and choosing arbitrary threshold distance for distance-based approach.
The were modelled as independently and identically distributed standard normal distribution. Since both structured and unstructured components of random effects are scaled to variance 1,
The represents the total variance of structured and non-structured random effects.
The covariates included an intercept term, a factor variable adjusting for 10-year age groups (with a reference group of 40–49 years), and various measures of SEP. We interpreted the as ORs with 95% credible interval (CI). The base model (without SEP) included only age groups as covariates and then different measures of SEP were subsequently added to the model (with SEP) and the proportion of variance explained was estimated for each SEP measure.
The proportion of variance explained in PSA testing by a given measure of SEP was estimated using
where was extracted from the model adjusted only for age-groups and was extracted from the model when SEP measure was included in the model. The posterior convergence was checked by inspecting the marginal posterior distributions to ensure the stability of the parameter estimates for fixed effects and random effects parameters. For sensitivity analyses, we plotted marginal posteriors of fixed effects and random effects parameters including structured and unstructured random effects with and without all the measures of SEP at the small area level and municipality level. We also plotted the complete density plots for variances with and without all the measures of SEP at both levels. Finally, we plotted the density plot for variances for (a) individual-level SEP, (b) area-level SEP and (c) combining individual and area-level SEP. We used the R-INLA package37 to fit these models and all the statistical analyses were performed using R software V.4.2.2.
Results
There were 4 71 335 men aged 40 years and over living in Stockholm in 2016, with no prior record of prostate cancer. Of those men, 71 061 (15.1%, 95% CI 15.0% to 15.2%) had at least one PSA test in 2016 (table 1). The proportion of men having a PSA test increased by age through to 70–79 years and then decreased. Men aged 70–79 in the highest income quartile had the highest proportion (35.2%, 95% CI 34.5% to 35.9%) of PSA testing. We found that men who were born in the Nordic countries had the highest level of PSA testing among all age groups. Men with more years of education tended to have higher proportions of PSA testing, as did men with higher incomes. There was a marked spatial variation in men taking a PSA test in the small areas in 2016 (figure 1).
Age-standardised proportion of men having a PSA test by small area in the Stockholm region, 2016. PSA, prostate-specific antigen.
Adjusting for age and accounting for spatial variation, men with 12 or more years of education had 22% higher odds (95% CI 19% to 25%) for having a PSA test compared with men with less than 9 years of education (figure 2). Men in higher income quartiles had greater odds of having a PSA test (Q4: 78% (95% CI 74% to 83%), Q3: 49% (95% CI 45% to 53%), Q2: 29% (95 % CI 25% to 32%)) compared with men in the lowest income quartile. Married men or men registered in a partnership had a 45% (95% CI 42% to 49%) higher odds of having a PSA test compared with those never married. Men born in the Nordic countries had a 7% (95% CI 4% to 11%) higher odds of having a PSA test compared with men born outside Europe. The associations remained significantly positive with a slight reduction in the estimates for income and civil status when adjusted for other measures of SEP. When we included all the SEP measures, country of birth was not significantly associated with PSA testing (online supplemental figure S1).
Age-adjusted ORs for associations of PSA testing with measures of individual-level socioeconomic position (SEP) in the Stockholm region, 2016. PSA, prostate-specific antigen.
Of the different types of SEP measures, income had the highest proportion of spatial variance explained, both when evaluated at the individual (32.3%) and the small area level (42.0%; table 2). After income, civil status had the highest proportion of spatial variance explained at the individual level (14.3%) and area level (38.4%) respectively. Across all types of SEP measures, the area-level explained a higher proportion of spatial variance compared with the individual-level. Combining the different types of SEP measures, approximately half of the spatial variance was explained by area-level measures, whereas individual-level measures explained 37.5% (table 2). There were limited gains in the proportion of spatial variance explained if we included SEP measures at individual and area-level simultaneously compared with area-level alone, which was also checked with the density plots for variances in these models (online supplemental figure S8). However, the models including both individual and area-level SEP had better model fits compared with individual or area-level SEP alone. The results for fixed effects from these models are presented in online supplemental table S1.
We found that our models converged and estimates from the models were stable (online supplemental figure S2). The marginal posteriors for structured random effects were narrower compared with unstructured effects at the small area level (online supplemental figures S3 and S4) and municipality level (online supplemental figures S5 and S6). There was a significant difference between the variances for models with and without SEP measures at small area level (online supplemental figure S7), whereas the difference was not significant at municipality level (online supplemental figure S8). There was a significant difference between the variances for models with and without SEP and including SEP at individual and area level (online supplemental figure S9). Comparing the summary measures for random effects at small area and municipality level, the uncertainty in the summary estimates was much higher at municipality level (online supplemental table S3) compared with small area level (online supplemental table S2). The computation time was around 1–2 min for a single model for a sample size of around 500 000 individuals and 890 small areas for random effects. For more details about the sensitivity analyses, please refer to the online supplemental information.
Discussion
In summary, we found moderate associations between opportunistic prostate cancer testing and SEP at the individual level and area level. The different measures of SEP partially explained the spatial variation in opportunistic prostate cancer testing at the small area level. Income had the strongest association with testing among all the measures of SEP, including individual-level association and in terms of proportion of variance explained. All other measures of SEP, including education, civil status and country of birth, were also associated with prostate cancer testing at both the individual level and area level. Our findings for the associations of PSA testing with SEP are consistent with previous literature at the individual level18 19 33 38 and area level.26 30 To the best of our knowledge, this study is the first to examine both the cross-level associations between SEP and prostate cancer testing and to describe the extent to which SEP accounts for the spatial variation in PSA testing.
There has been some debate on how to model for compositional and contextual effects on a health outcome. Jen et al argued that area-level analyses could be affected by the ecological fallacy and they emphasised the role of compositional variables in accounting for spatial variation.39 We assessed the contribution of individual-level and area-level SEP measures towards the explained spatial variance, including the combination of both, and found that area-level SEP measures explained much of the broader contextual effects. The individual-level SEP measures improved the model fit in terms of marginal log likelihoods but did not add to the explained spatial variance when already accounting for area-level SEP measures. There could still be some unmeasured contextual factors that could contribute to the unexplained heterogeneity after SEP such as access to general practitioner services,40 41 lack of awareness or public health campaigning.42 43
The association of SEP with prostate cancer testing is multifaceted, with potential for negative consequences at both ends of the distribution of SEP. First, higher levels of opportunistic testing in the higher SEP groups have been found associated with an increased incidence of low-grade or insignificant cancers,44 leading to overdiagnosis and overtreatment. Second, lower participation in prostate cancer testing among lower SEP groups has been linked with delayed diagnosis13 and a higher likelihood of metastatic diagnosis,45 both of which lead to poorer prognosis. The frequent testing among the older age groups (70+) is also concerning as it may increase the risk of overdiagnosis and overtreatment46 given the lower chances of aggressive prostate cancer or prostate cancer-specific death for those with low PSA values.47 There has not been sufficient evidence from screening trials to understand potential harms and benefits of PSA testing for older age groups.
As a strength of this study, the analysis was based on a population-based individual linkage of PSA tests with cancer registration and men spatially encoded for small homogeneous areas. The granularity in the spatial data allowed us to capture more variation in SEP which would be masked at higher geographical levels such as municipality. We used an individual-level model with spatial random effects to adjust for individual-level and area-level SEP measures simultaneously rather than an ecological approach which accounts only for area-level SEP.
As a limitation, we did not have access to more recent small area data to evaluate the association of SEP with organised testing due to institutional restrictions. We also lacked access to primary care data which could be used to explore other area-level factors including the geographical distribution of clinics offering PSA tests which could contribute to unexplained spatial heterogeneity in prostate cancer testing. As a further limitation, we lacked some measures of wealth, including other sources of income (eg, stocks and home-ownership), which could further contribute to unexplained spatial heterogeneity. We did not handle multiple testing among men to avoid the overdispersion and chose any testing as an indicator, but the average number of tests among men was 1.35 (SD=0.82) and median being 1 (IQR: (1,1)). In this study, we have focused on SEP for a given time period instead of a temporal component. A spatio-temporal analysis of SEP is certainly interesting but would be methodologically complicated.
For future research, it would be useful to reproduce these findings in other populations. While the level of testing may vary between populations, we hypothesise that the cross-level associations and the proportion of variance explained will be similar in other European populations. There has been a growing literature on geo-spatial approaches for cancer prevention, and to understand the geography of inequalities in cancer outcomes.48 Further research is needed to explore the other factors that could better explain the spatial heterogeneity in prostate cancer testing. Based on preliminary evidence from a pilot OPT programme in Sweden, the socioeconomic gradients of participation were worsened in the OPT setting compared with an unorganised setting.33 Since the OPT pilot studies are in an implementation phase, they highlight the policy challenges to address the socioeconomic disparities and the spatial variation for the structured testing in all the groups. There have been substantial recent changes in prostate cancer management, including the introduction of MRI, the use of other reflex diagnostic tests such as STHLM3, initiating pilot studies to investigate the feasibility of OPT and the introduction of new treatments which could affect prostate cancer survival. A key policy question is to assess whether these changes will lead to reduced socioeconomic disparities in prostate cancer testing and outcomes. A future evaluation of an OPT programme will require data on prostate cancer outcomes by SEP at both the small area level and at the individual level to monitor whether the inequalities are exacerbated.
Supplementary material
10.1136/bmjph-2025-003493online supplemental file 1
The reference list from the paper itself. Each links out to its DOI / PubMed record.
- 1WHO International agency for research on cancer 2024 Availablehttps://www.iarc.who.int/
- 2Welfare STN Bo Ha Statistics on cancer incidence 2022 Availablehttps://www.socialstyrelsen.se/globalassets/sharepoint-dokument/artikelkatalog/statistik/2022-12-8309.pdf
- 3NORDCAN 2025 Availablehttps://nordcan.iarc.fr/en
- 4Ilic D Djulbegovic M Jung JH et al Prostate cancer screening with prostate-specific antigen (PSA) test: a systematic review and meta-analysis BMJ 2018362 k 351910.1136/bmj.k 351930185521 PMC 6283370 · doi ↗ · pubmed ↗
- 5Hayes JH Barry MJ Screening for prostate cancer with the prostate-specific antigen test: a review of current evidence JAMA 20143111143910.1001/jama.2014.208524643604 · doi ↗ · pubmed ↗
- 6Schröder FH Hugosson J Roobol MJ et al Screening and prostate-cancer mortality in a randomized European study N Engl J Med 20093601320810.1056/NEJ Moa 081008419297566 · doi ↗ · pubmed ↗
- 7Schröder FH Hugosson J Roobol MJ et al Prostate-cancer mortality at 11 years of follow-up N Engl J Med 20123669819010.1056/NEJ Moa 111313522417251 PMC 6027585 · doi ↗ · pubmed ↗
- 8Nadler RB Humphrey PA Smith DS et al Effect of inflammation and benign prostatic hyperplasia on elevated serum prostate specific antigen levels J Urol 19951544071310.1097/00005392-199508000-000237541857 · doi ↗ · pubmed ↗