Predictors of high- and low-risk drinking after group treatment for alcohol use disorder – CORRIGENDUM
Kristoffer Høiland, Espen Kristian Ajo Arnevik, Lien My Diep, Tove Mathisen, Anette Søgaard Nielsen, Jens Egeland

Abstract
Genes, proteins, chemicals, diseases, species, mutations and cell lines named across the full text — each resolved to its canonical identifier and authoritative record.
Click any figure to enlarge with its caption.
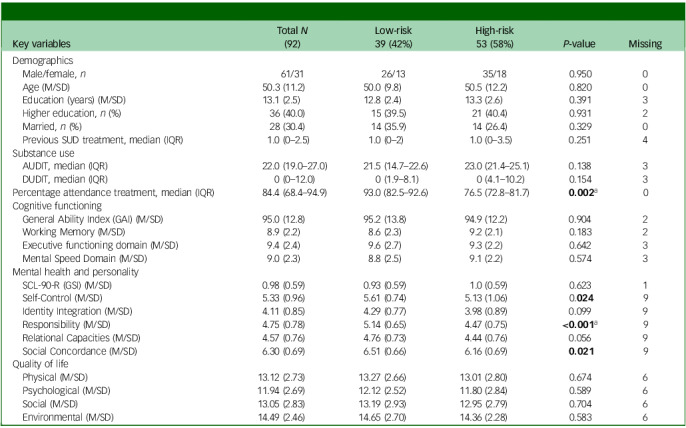 Figure 1
Peer Reviews
No public reviews on file for this paper yet. If you reviewed it on a platform where reviews are public (OpenReview, ICLR, NeurIPS, ICML), you can paste yours below so the community can read it here.
Videos
No videos yet. Explain this paper in a talk, walkthrough, or lecture? Add one.
Taxonomy
TopicsSubstance Abuse Treatment and Outcomes · Alcohol Consumption and Health Effects · Gambling Behavior and Treatments
Since this article’s original publication, the authors have noticed that table 2 is mislabelled. This applies only to the variables, and the actual values in the table are correct.
The corrected table is below.
Table 2. Associations between key variables pretreatment and outcome at treatment end (low- versus high-risk drinking)Key variablesTotal N (92)Low-risk39 (42%)High-risk53 (58%) P-valueMissingDemographics Male/female, n 61/3126/1335/180.9500 Age (M/SD)50.3 (11.2)50.0 (9.8)50.5 (12.2)0.8200 Education (years) (M/SD)13.1 (2.5)12.8 (2.4)13.3 (2.6)0.3913 Higher education, n (%)36 (40.0)15 (39.5)21 (40.4)0.9312 Married, n (%)28 (30.4)14 (35.9)14 (26.4)0.3290 Previous SUD treatment, median (IQR)1.0 (0–2.5)1.0 (0–2)1.0 (0–3.5)0.2514Substance use AUDIT, median (IQR)22.0 (19.0–27.0)21.5 (14.7–22.6)23.0 (21.4–25.1)0.1383 DUDIT, median (IQR)0 (0–12.0)0 (1.9–8.1)0 (4.1–10.2)0.1543Percentage attendance treatment, median (IQR)84.4 (68.4–94.9)93.0 (82.5–92.6)76.5 (72.8–81.7) 0.002 ^ a ^ 0Cognitive functioning General Ability Index (GAI) (M/SD)95.0 (12.8)95.2 (13.8)94.9 (12.2)0.9042 Working Memory (M/SD)8.9 (2.2)8.6 (2.3)9.2 (2.1)0.1832 Executive functioning domain (M/SD)9.4 (2.4)9.6 (2.7)9.3 (2.2)0.6423 Mental Speed Domain (M/SD)9.0 (2.3)8.8 (2.5)9.1 (2.2)0.5743Mental health and personality SCL-90-R (GSI) (M/SD)0.98 (0.59)0.93 (0.59)1.0 (0.59)0.6231 Self-Control (M/SD)5.33 (0.96)5.61 (0.74)5.13 (1.06)0.024 9 Identity Integration (M/SD)4.11 (0.85)4.29 (0.77)3.98 (0.89)0.0999 Responsibility (M/SD)4.75 (0.78)5.14 (0.65)4.47 (0.75) <0.001 ^ a ^ 9 Relational Capacities (M/SD)4.57 (0.76)4.76 (0.73)4.44 (0.76)0.0569 Social Concordance (M/SD)6.30 (0.69)6.51 (0.66)6.16 (0.69) 0.021 9Quality of life Physical (M/SD)13.12 (2.73)13.27 (2.66)13.01 (2.80)0.6746 Psychological (M/SD)11.94 (2.69)12.12 (2.52)11.80 (2.84)0.5896 Social (M/SD)13.05 (2.83)13.19 (2.93)12.95 (2.79)0.7046 Environmental (M/SD)14.49 (2.46)14.65 (2.70)14.36 (2.28)0.5836All predictor variables were examined at baseline, except for the percentage of treatment attendance. Group differences are described based on two-tailed t-tests, means and standard deviations, or based on Mann–Whitney U-tests, medians and IQR for non-normal variables and chi-square tests for categorical variables.Mental health: GSI from SCL90-R: personality domain scores from Severity Indices of Personality Functioning; quality of life: domain scores from World Health Organization Quality of Life Scale.SUD, substance use disorder; IQR, interquartile range; AUDIT, Alcohol Use Disorders Identification Test; DUDIT, Drug Use Disorders Identification Test; SCL-90-R (GSI), Symptom Checklist 90 (General Symptom Index).a.Significant following Bonferroni correction. P-values <0.05 are indicated in bold.
The reference list from the paper itself. Each links out to its DOI / PubMed record.