Neutrophil-to-lymphocyte ratio, platelet-to-lymphocyte ratio, and monocyte-to-lymphocyte ratio as prognostic indicators in Pneumocystis jirovecii pneumonia
Fei Yu, Yousheng Ye, Min Shao

TL;DR
This study shows that a continuously decreasing neutrophil-to-lymphocyte ratio (NLR) is linked to worse survival in patients with Pneumocystis jirovecii pneumonia.
Contribution
The study introduces the dynamic trajectory of log-transformed NLR as a novel independent prognostic indicator for PJP outcomes.
Findings
Three NLR trajectories were identified: continuously decreasing, stable, and continuously increasing.
Patients with a continuously decreasing NLR had significantly lower 28-day survival.
LogNLR trajectory was an independent prognostic factor, while logMLR and logPLR were not.
Abstract
Pneumocystis jirovecii pneumonia (PJP) remains a life-threatening opportunistic infection with high mortality, particularly among non-HIV immunocompromised patients. Identifying accessible and reliable prognostic biomarkers is of major clinical importance. To investigate the prognostic value of dynamic changes in the neutrophil-to-lymphocyte ratio (NLR), monocyte-to-lymphocyte ratio (MLR), and platelet-to-lymphocyte ratio (PLR) among patients with PJP. A retrospective study of 165 PJP patients was conducted at two tertiary hospitals. Post-diagnostic trajectories of NLR, MLR, and PLR were analyzed using group-based trajectory modeling (GBTM). Associations between these trajectories and 28-day survival were assessed by Cox proportional hazards regression and Kaplan–Meier survival analysis. Three distinct NLR trajectories were identified: continuously decreasing (15%), stable (68%), and…
Genes, proteins, chemicals, diseases, species, mutations and cell lines named across the full text — each resolved to its canonical identifier and authoritative record.
Click any figure to enlarge with its caption.
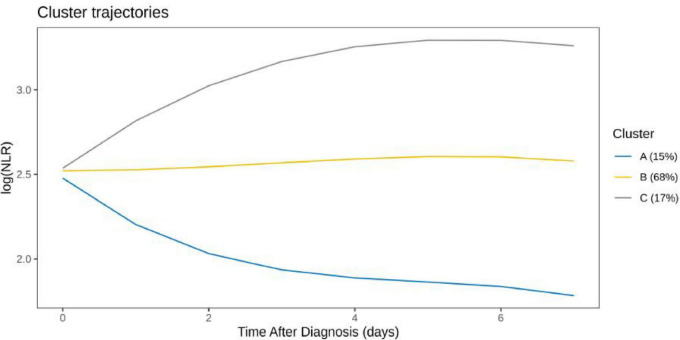 FIGURE 1
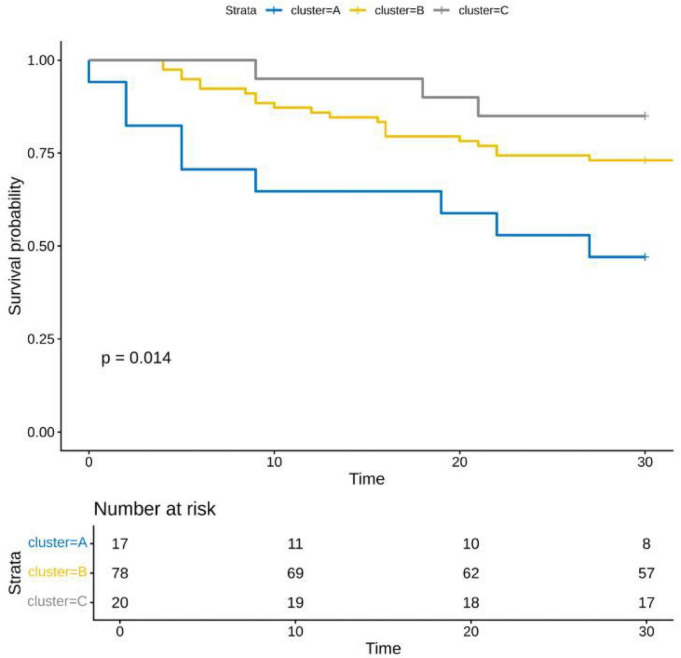 FIGURE 2
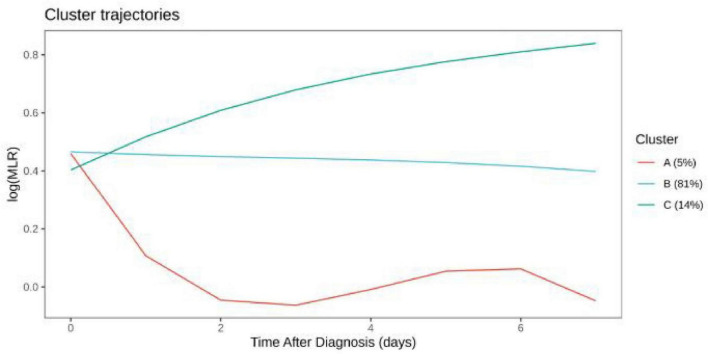 FIGURE 3
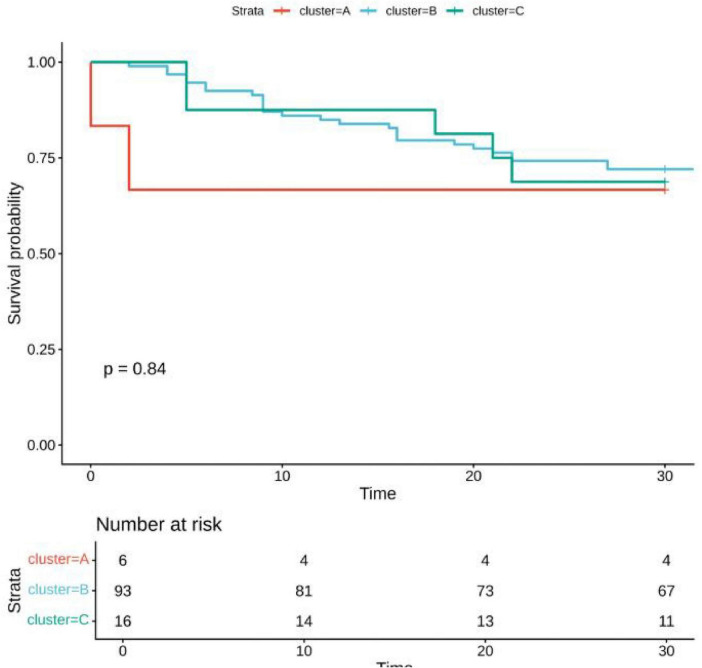 FIGURE 4
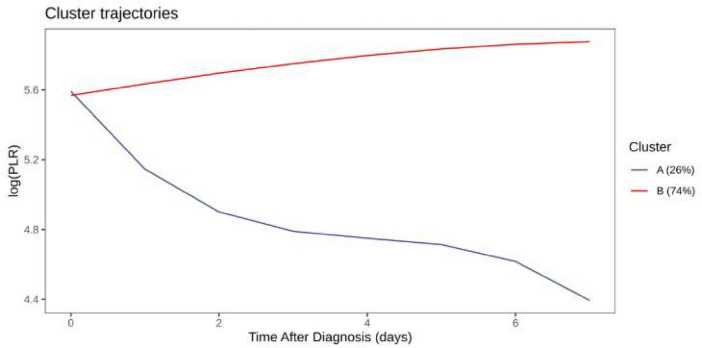 FIGURE 5
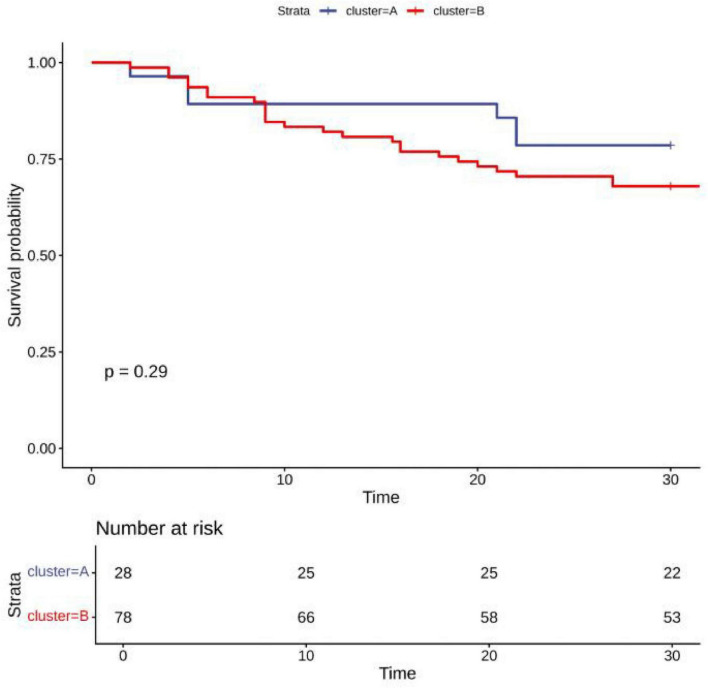 FIGURE 6
| Characteristics | Category | Group D | Group L |
|
|---|---|---|---|---|
|
| – | 37 | 128 | – |
| Male (%) | M | 17 (45.9) | 84 (65.6) | 0.049 |
| W | 20 (54.1) | 44 (34.4) | – | |
| Age (median [IQR]) | – | 67.00 [54.00, 73.00] | 61.00 [53.00, 72.00] | 0.297 |
| LOS1 (median [IQR]) | – | 12.00 [8.00, 16.00] | 12.77 [8.00, 24.00] | 0.177 |
| LOS2 (median [IQR]) | – | 6.00 [2.00, 10.00] | 0.00 [0.00, 10.88] | 0.013 |
| Health (%) | 0 | 5 (13.5) | 30 (23.4) | 0.541 |
| 1 | 3 (8.1) | 15 (11.7) | – | |
| 2 | 9 (24.3) | 21 (16.4) | – | |
| 3 | 3 (8.1) | 5 (3.9) | – | |
| 4 | 4 (10.8) | 16 (12.5) | – | |
| 5 | 10 (27.0) | 25 (19.5) | – | |
| 6 | 3 (8.1) | 16 (12.5) | – | |
| APACHE II (median [IQR]) | – | 20.00 [15.00, 24.00] | 8.00 [6.00, 17.00] | <0.001 |
| SOFA (median [IQR]) | – | 4.00 [3.00, 6.00] | 2.00 [0.00, 4.00] | <0.001 |
| CT (%) | 0 | 0 (0.0) | 1 (0.8) | 1 |
| 1 | 37 (100.0) | 127 (99.2) | – | |
| Therapy1 (%) | 0 | 16 (43.2) | 71 (55.5) | 0.261 |
| 1 | 21 (56.8) | 57 (44.5) | – | |
| Therapy3 (%) | 0 | 14 (37.8) | 60 (46.9) | 0.432 |
| 1 | 23 (62.2) | 68 (53.1) | – | |
| Therapy4 (%) | 0 | 14 (37.8) | 86 (67.2) | 0.002 |
| 1 | 23 (62.2) | 42 (32.8) | – | |
| Therapy5 (%) | 0 | 4 (10.8) | 48 (37.5) | 0.004 |
| 1 | 33 (89.2) | 80 (62.5) | – | |
| Therapy6 (median [IQR]) | – | 6.00 [4.00, 10.00] | 4.00 [0.00, 10.25] | 0.105 |
| Therapy7 (%) | 0 | 5 (13.5) | 71 (55.5) | <0.001 |
| 1 | 32 (86.5) | 57 (44.5) | – | |
| Therapy8 (median [IQR]) | – | 0.00 [0.00, 14.00] | 0.00 [0.00, 0.00] | 0.002 |
| Therapy9 (median [IQR]) | – | 93.00 [21.00, 193.00] | 0.00 [0.00, 0.00] | <0.001 |
| Therapy10 (%) | 0 | 30 (81.1) | 114 (89.1) | 0.316 |
| 1 | 7 (18.9) | 14 (10.9) | – | |
| Therapy11 (%) | 0 | 33 (89.2) | 122 (95.3) | 0.325 |
| 1 | 4 (10.8) | 6 (4.7) | – | |
| Therapy12 (%) | 0 | 34 (91.9) | 118 (92.2) | 1 |
| 1 | 3 (8.1) | 10 (7.8) | – | |
| Therapy13 (%) | 0 | 32 (86.5) | 101 (78.9) | 0.549 |
| 1 | 5 (13.5) | 27 (21.1) | – | |
| APTT (median [IQR]) | – | 28.35 [26.37, 38.83] | 29.35 [26.64, 34.92] | 0.911 |
| FIB (median [IQR]) | – | 4.80 [3.47, 5.44] | 4.36 [3.41, 5.62] | 0.872 |
| PT (median [IQR]) | – | 13.60 [11.95, 15.20] | 12.70 [11.74, 13.50] | 0.033 |
| PCT (median [IQR]) | – | 0.89 [0.15, 1.78] | 0.13 [0.05, 0.30] | 0.002 |
| LYMPH (median [IQR]) | – | 0.45 [0.31, 0.60] | 0.74 [0.40, 1.25] | 0.011 |
| MONO (median [IQR]) | – | 0.23 [0.11, 0.33] | 0.41 [0.22, 0.60] | 0.001 |
| NEUT (median [IQR]) | – | 6.82 [5.53, 9.93] | 6.11 [3.99, 8.66] | 0.161 |
| WBC (median [IQR]) | – | 7.78 [6.32, 10.55] | 7.22 [5.95, 10.20] | 0.566 |
| LAC (median [IQR]) | – | 2.00 [1.33, 3.32] | 1.45 [1.12, 1.80] | 0.084 |
| PO2 (median [IQR]) | – | 64.55 [48.50, 89.95] | 81.00 [70.00, 95.20] | 0.124 |
| FIO2 (median [IQR]) | – | 0.50 [0.50, 0.50] | 0.21 [0.21, 0.23] | 0.050 |
| PO2/FIO2 (median [IQR]) | – | 153.60 [153.60, 153.60] | 359.52 [284.66, 407.14] | 0.181 |
| ALB (median [IQR]) | – | 29.70 [25.57, 33.25] | 32.80 [28.65, 36.00] | 0.015 |
| ALT (median [IQR]) | – | 21.00 [16.08, 30.25] | 22.00 [14.00, 38.00] | 0.742 |
| DD (median [IQR]) | – | 4.40 [1.54, 9.81] | 1.15 [0.50, 2.74] | 0.001 |
| TBIL (median [IQR]) | – | 12.25 [9.38, 17.11] | 9.15 [6.60, 12.60] | 0.05 |
| CRP (median [IQR]) | – | 91.16 [79.23, 151.04] | 29.26 [13.28, 61.19] | <0.001 |
| LDH (median [IQR]) | – | 625.55 [497.75, 1092.88] | 400.00 [221.50, 548.49] | <0.001 |
| BUN/CREA (median [IQR]) | – | 32.07 [22.74, 56.85] | 21.47 [15.45, 29.78] | 0.003 |
| CREA (median [IQR]) | – | 67.00 [47.35, 118.00] | 68.00 [50.08, 101.30] | 0.817 |
| PLT (median [IQR]) | – | 146.00 [78.75, 206.50] | 207.00 [141.00, 279.75] | 0.013 |
| ESR (median [IQR]) | – | 33.00 [26.00, 52.00] | 46.00 [22.50, 67.50] | 0.368 |
| HCO3– (median [IQR]) | – | 19.30 [17.05, 21.45] | 25.32 [22.64, 27.66] | 0.066 |
| NLR (median [IQR]) | – | 13.29 [9.26, 23.77] | 8.20 [3.38, 18.76] | 0.012 |
| MLR (median [IQR]) | – | 0.47 [0.27, 0.64] | 0.51 [0.30, 0.83] | 0.239 |
| PLR (median [IQR]) | – | 294.01 [167.62, 437.08] | 262.00 [168.60, 467.53] | 0.966 |
| Characteristics | Category | Group A | Group B | Group C |
|
|---|---|---|---|---|---|
|
| – | 18 | 79 | 20 | – |
| Male (%) | M | 10 (55.6) | 54 (68.4) | 9 (45.0) | 0.127 |
| W | 8 (44.4) | 25 (31.6) | 11 (55.0) | ||
| Age (median [IQR]) | – | 55.50 [36.00, 67.00] | 64.00 [53.50, 72.50] | 59.00 [52.75, 68.25] | 0.064 |
| LOS1 (median [IQR]) | – | 18.00 [12.00, 37.25] | 14.00 [9.00, 22.50] | 12.77 [10.12, 20.75] | 0.294 |
| LOS2 (median [IQR]) | – | 4.82 [0.23, 17.70] | 3.00 [0.00, 12.00] | 6.50 [0.00, 12.16] | 0.57 |
| Health (%) | 0 | 4 (22.2) | 16 (20.3) | 3 (15.0) | 0.63 |
| 1 | 4 (22.2) | 8 (10.1) | 1 (5.0) | – | |
| 2 | 1 (5.6) | 15 (19.0) | 3 (15.0) | – | |
| 3 | 2 (11.1) | 2 (2.5) | 2 (10.0) | – | |
| 4 | 3 (16.7) | 9 (11.4) | 2 (10.0) | – | |
| 5 | 3 (16.7) | 19 (24.1) | 6 (30.0) | – | |
| 6 | 1 (5.6) | 10 (12.7) | 3 (15.0) | – | |
| APACHE II (median [IQR]) | – | 16.00 [13.50, 23.00] | 10.00 [6.00, 20.50] | 15.50 [10.75, 21.00] | 0.11 |
| SOFA (median [IQR]) | – | 6.00 [4.00, 8.75] | 2.00 [0.00, 5.00] | 2.50 [1.50, 6.00] | 0.002 |
| CT (median [IQR]) | – | 1.00 [1.00, 1.00] | 1.00 [1.00, 1.00] | 1.00 [1.00, 1.00] | 0.786 |
| Therapy1 (%) | 0 | 9 (50.0) | 44 (55.7) | 10 (50.0) | 0.846 |
| 1 | 9 (50.0) | 35 (44.3) | 10 (50.0) | – | |
| Therapy3 (%) | 0 | 4 (22.2) | 33 (41.8) | 6 (30.0) | 0.237 |
| 1 | 14 (77.8) | 46 (58.2) | 14 (70.0) | – | |
| Therapy4 (%) | 0 | 8 (44.4) | 49 (62.0) | 8 (40.0) | 0.123 |
| 1 | 10 (55.6) | 30 (38.0) | 12 (60.0) | – | |
| Therapy5 (%) | 0 | 3 (16.7) | 26 (32.9) | 1 (5.0) | 0.024 |
| 1 | 15 (83.3) | 53 (67.1) | 19 (95.0) | – | |
| Therapy6 (median [IQR]) | – | 11.00 [4.50, 17.00] | 6.00 [0.00, 12.00] | 7.50 [3.75, 10.25] | 0.189 |
| Therapy7 (%) | 0 | 4 (22.2) | 33 (41.8) | 7 (35.0) | 0.293 |
| 1 | 14 (77.8) | 46 (58.2) | 13 (65.0) | – | |
| Therapy8 (median [IQR]) | – | 0.00 [0.00, 0.00] | 0.00 [0.00, 2.50] | 0.00 [0.00, 0.00] | 0.177 |
| Therapy9 (median [IQR]) | – | 89.50 [0.00, 245.25] | 0.00 [0.00, 88.00] | 0.00 [0.00, 99.00] | 0.141 |
| Therapy10 (%) | 0 | 13 (72.2) | 68 (86.1) | 17 (85.0) | 0.351 |
| 1 | 5 (27.8) | 11 (13.9) | 3 (15.0) | – | |
| Therapy11 (%) | 0 | 16 (88.9) | 71 (89.9) | 20 (100.0) | 0.321 |
| 1 | 2 (11.1) | 8 (10.1) | 0 (0.0) | – | |
| Therapy12 (%) | 0 | 16 (88.9) | 73 (92.4) | 20 (100.0) | 0.358 |
| 1 | 2 (11.1) | 6 (7.6) | 0 (0.0) | – | |
| Therapy13 (%) | 0 | 14 (77.8) | 63 (79.7) | 19 (95.0) | 0.233 |
| 1 | 4 (22.2) | 16 (20.3) | 1 (5.0) | – | |
| APTT (median [IQR]) | – | 33.90 [28.80, 38.70] | 30.20 [26.28, 35.65] | 27.15 [26.40, 28.30] | 0.172 |
| FIB (median [IQR]) | – | 4.28 [3.39, 5.48] | 4.44 [3.47, 5.65] | 5.02 [3.41, 5.56] | 0.935 |
| PT (median [IQR]) | – | 13.40 [12.20, 15.50] | 12.85 [11.74, 13.83] | 12.45 [12.00, 13.30] | 0.226 |
| PCT (median [IQR]) | – | 0.32 [0.12, 1.04] | 0.18 [0.07, 1.02] | 0.13 [0.10, 0.30] | 0.681 |
| LYMPH (median [IQR]) | – | 0.44 [0.19, 0.78] | 0.60 [0.36, 1.11] | 0.49 [0.29, 0.67] | 0.217 |
| MONO (median [IQR]) | – | 0.17 [0.12, 0.46] | 0.34 [0.14, 0.68] | 0.28 [0.16, 0.36] | 0.29 |
| NEUT (median [IQR]) | – | 7.27 [5.81, 9.35] | 6.68 [4.39, 9.66] | 6.97 [4.73, 8.18] | 0.62 |
| WBC (median [IQR]) | – | 7.81 [6.33, 10.57] | 7.65 [6.23, 10.66] | 7.83 [5.29, 9.35] | 0.538 |
| LAC (median [IQR]) | – | 1.52 [1.23, 2.07] | 1.50 [1.35, 2.64] | 1.80 [1.80, 2.20] | 0.653 |
| PO2 (median [IQR]) | – | 84.65 [71.05, 112.25] | 73.83 [49.08, 90.70] | 78.70 [63.98, 82.32] | 0.501 |
| ALB (median [IQR]) | – | 29.15 [24.60, 33.81] | 32.35 [27.91, 34.88] | 28.50 [24.22, 32.76] | 0.157 |
| ALT (median [IQR]) | – | 16.50 [11.03, 30.50] | 22.90 [16.95, 30.55] | 20.50 [15.00, 30.50] | 0.525 |
| DD (median [IQR]) | – | 3.38 [1.64, 9.45] | 1.60 [0.68, 4.40] | 1.38 [0.65, 3.41] | 0.324 |
| TBIL (median [IQR]) | – | 10.45 [5.99, 15.86] | 10.20 [7.48, 13.50] | 6.80 [6.20, 11.00] | 0.201 |
| CRP (median [IQR]) | – | 88.18 [60.84, 127.95] | 45.80 [17.75, 95.72] | 80.77 [30.53, 111.48] | 0.252 |
| LDH (median [IQR]) | – | 537.00 [402.50, 625.55] | 464.25 [282.58, 773.55] | 593.50 [457.30, 1092.75] | 0.171 |
| BUN/CREA (median [IQR]) | – | 21.95 [12.87, 44.31] | 28.97 [20.66, 36.43] | 24.44 [14.38, 42.74] | 0.519 |
| CREA (median [IQR]) | – | 68.50 [43.10, 144.25] | 69.00 [51.45, 110.00] | 55.00 [40.00, 109.58] | 0.566 |
| HCO3– (median [IQR]) | – | 22.75 [20.31, 23.45] | 24.90 [20.52, 28.82] | 22.25 [19.90, 25.95] | 0.569 |
| PLT (median [IQR]) | – | 148.00 [50.25, 233.75] | 204.00 [110.25, 280.00] | 178.50 [138.75, 209.25] | 0.229 |
| ESR (median [IQR]) | – | 26.00 [18.00, 28.50] | 42.50 [22.25, 67.75] | 52.00 [46.00, 59.00] | 0.066 |
| FIO2 (median [IQR]) | – | 0.21 [0.21, 0.21] | 0.21 [0.21, 0.29] | 0.45 [0.45, 0.45] | 0.285 |
Peer Reviews
No public reviews on file for this paper yet. If you reviewed it on a platform where reviews are public (OpenReview, ICLR, NeurIPS, ICML), you can paste yours below so the community can read it here.
Videos
No videos yet. Explain this paper in a talk, walkthrough, or lecture? Add one.
Taxonomy
TopicsPneumocystis jirovecii pneumonia detection and treatment · Pneumonia and Respiratory Infections · Respiratory viral infections research
Introduction
Pneumocystis jirovecii pneumonia (PJP) is a major opportunistic and life-threatening infection that primarily affects immunocompromised individuals or those undergoing long-term immunosuppressive or corticosteroid therapy (1–3). Although prophylactic treatment has reduced AIDS-related PJP, the incidence among non-HIV immunocompromised hosts continues to rise, accompanied by high mortality rates (4–6).
Inflammatory responses and immune function play crucial roles in PJP pathogenesis (7, 8). However, no specific biomarkers have been consistently associated with prognosis. Simple hematological ratios—such as neutrophil-to-lymphocyte ratio (NLR), monocyte-to-lymphocyte ratio (MLR), and platelet-to-lymphocyte ratio (PLR)—offer easily accessible, cost-effective, and repeatable markers reflecting the balance between innate and adaptive immunity. Nevertheless, few studies have examined their temporal evolution in PJP (9, 10).
To address this gap, we applied group-based trajectory modeling (GBTM) to analyze longitudinal logNLR, logMLR, and logPLR data from PJP patients, identifying trajectory groups and their association with 28-day survival (11, 12).
Materials and methods
Study design and population
A retrospective cohort of 165 patients diagnosed with Pneumocystis jirovecii pneumonia (PJP) between October 2020 and August 2025 was included. Diagnostic criteria: clinical symptoms (fever, cough, dyspnea), radiologic findings of pulmonary infiltrates, and positive P. jirovecii detection in bronchoalveolar lavage fluid via metagenomic next-generation sequencing (mNGS) (13). Exclusion: patients <18 years, HIV-positive status, and pregnancy or lactation.
Ethical approval was granted by both hospital committees. Written informed consent was obtained from all participants.
Data collection
Clinical variables included demographics, comorbidities, hospital and ICU stays, cute physiology and chronic health evaluation II (APACHE II) scores and sequential Organ Failure Assessment (SOFA) scores, treatments, and laboratory indices (WBC, NEUT, LYM, MONO, PLT, CRP, PT, FIB, LDH, etc.). Dynamic values of neutrophil-to-lymphocyte ratio (NLR), monocyte-to-lymphocyte ratio (MLR), and platelet-to-lymphocyte ratio (PLR) were recorded up to 28 days post-diagnosis.
Outcome measures
The primary endpoint was 28-day survival after PJP diagnosis.
Statistical analysis
Continuous variables were assessed for normality using the Shapiro–Wilk test. Between-group comparisons used t-test or Mann–Whitney U-test. Categorical variables were compared by chi-square or Fisher’s exact test.
Group-based trajectory modeling was used to model trajectories for logNLR, logMLR, and logPLR in R (v4.3.2). The best-fitting model was selected based on AIC/BIC. Associations with mortality were analyzed via Cox regression and Kaplan–Meier analysis. Statistical significance was defined as two-sided P < 0.05.
Results
Baseline characteristics
Among 165 Pneumocystis jirovecii pneumonia (PJP) patients (101 male, 64 female), 128 survived and 37 died within 28 days. Non-survivors had longer Intensive Care Unit (ICU) stays, higher cute physiology and chronic health evaluation II (APACHE II) scores and sequential Organ Failure Assessment (SOFA) scores, and were more likely to receive vasoactive therapy. Laboratory markers including PT, D-dimer, CRP, LDH, and PCT were elevated in non-survivors, whereas lymphocyte and monocyte counts were lower (Table 1).
LogNLR trajectories
Three logNLR trajectories were identified: continuously decreasing (15%), stable (68%), and increasing (17%). Kaplan–Meier survival analysis revealed significantly lower survival in the decreasing group (P = 0.014) (Figures 1, 2).
LogNLR trajectory comparison among clusters.
Kaplan–Meier survival curves by logNLR trajectory.
LogMLR and logPLR trajectories
Distinct logMLR and logPLR patterns were observed but showed no significant association with survival (logMLR P = 0.84; logPLR P = 0.29) (Figures 3–6).
LogMLR trajectory comparison among clusters.
Survival analysis by logMLR trajectories.
LogPLR trajectory comparison among clusters.
Survival analysis by logPLR trajectories.
Clinical correlates
Patients in the decreasing logNLR group had higher SOFA scores and different corticosteroid usage patterns (P < 0.05) (Table 2).
Discussion
Pneumocystis jirovecii pneumonia (PJP) remains a potentially fatal opportunistic infection, particularly among patients with non-acquired immunodeficiency syndrome (NADIS) (14–16). Compared with AIDS-related PJP, NADIS-associated PJP is characterized by a more acute onset, rapid clinical deterioration, and substantially higher mortality rates, which are often attributed to delayed diagnosis and insufficient targeted antimicrobial therapy (6, 17–19). Previous studies have demonstrated that PJP in non-HIV populations is frequently accompanied by excessive inflammatory responses within the alveolar microenvironment, leading to impaired gas exchange and subsequent multi-organ dysfunction (20–23). In this context, identifying reliable and easily accessible biomarkers for dynamic assessment of inflammatory and immune status is of critical importance. Although molecular diagnostic technologies have significantly improved the detection of P. jirovecii (24, 25), robust indicators for treatment monitoring and prognostic stratification are still lacking (19, 26–28).
Recently, complete blood count (CBC)-derived inflammatory indices, including neutrophil-to-lymphocyte ratio (NLR), monocyte-to-lymphocyte ratio (MLR), and platelet-to-lymphocyte ratio (PLR), have attracted increasing attention due to their cost-effectiveness and clinical feasibility (29–34). These indices reflect the balance between innate and adaptive immunity and have shown prognostic value in various inflammatory and infectious diseases. However, their role in PJP, especially from a longitudinal perspective, remains insufficiently explored (35).
Our study demonstrated that baseline NLR was significantly higher in non-survivors than in survivors, indicating that an excessive inflammatory burden at admission is associated with poor short-term outcomes. More importantly, through group-based trajectory modeling (GBTM) of log-transformed NLR values, we identified three distinct dynamic patterns: sustained decline, stable trajectory, and sustained increase. Unexpectedly, patients in the sustained decline trajectory group exhibited the worst survival outcomes, whereas those with sustained increase trajectories showed the most favorable prognosis. This paradoxical phenomenon highlights that not only the absolute value of NLR, but also its temporal evolution, is crucial for outcome prediction.
The biological explanation for this finding may be multifactorial. Neutrophils play a central role in the early innate immune response against pathogens, while lymphocytes, particularly CD4^+^ T cells, are indispensable for effective clearance of P. jirovecii. An elevated NLR at disease onset likely reflects a hyperinflammatory state combined with impaired adaptive immunity (36, 37). However, a rapid decline in NLR during disease progression may represent immune exhaustion, bone marrow suppression, extensive lymphocyte apoptosis, or immune reconstitution inflammatory syndrome (IRIS) (28). These processes may result in functional immune collapse, impaired pathogen clearance, and an increased risk of fatal outcomes.
In addition, patients in the sustained decline group exhibited significantly higher sequential Organ Failure Assessment (SOFA) scores, suggesting more severe organ dysfunction and systemic involvement. Differences in glucocorticoid use among trajectory groups further reflect the complex immunomodulatory effects of corticosteroids in PJP, which may exert both beneficial and detrimental effects on immune homeostasis, depending on timing, dose, and patient-specific immune status.
Of note, MLR and PLR, either at baseline or during dynamic follow-up, were not significantly associated with 28-day mortality in our cohort. This finding suggests that NLR, integrating signals from both neutrophils and lymphocytes, may serve as a more sensitive and disease-specific marker for immunoinflammatory imbalance in PJP.
To the best of our knowledge, this is the first study to systematically evaluate the prognostic value of dynamic NLR trajectories in patients with PJP. Our findings provide a novel framework for early risk stratification and individualized clinical management. Dynamic monitoring of NLR trajectories may help clinicians to identify high-risk patients at an earlier stage, optimize immunomodulatory strategies, and allocate critical care resources more precisely.
Several limitations should be acknowledged. First, this was a retrospective with a relatively limited sample size, which may introduce selection bias. Second, follow-up was restricted to 28 days, and long-term outcomes were not assessed. Third, laboratory testing intervals were not completely standardized, although this limitation was partially mitigated by trajectory modeling techniques. Finally, external validation in large-scale, prospective, multicenter cohorts is required before these findings can be translated into routine clinical practice.
Conclusion
In patients with Pneumocystis jirovecii pneumonia, the dynamic trajectory of logNLR is strongly associated with short-term survival. A persistently decreasing logNLR indicates poor prognosis and warrants closer clinical monitoring and supportive interventions.
The reference list from the paper itself. Each links out to its DOI / PubMed record.
- 1Rhoads S Maloney J Mantha A Van Hook R Henao-Martínez AF. Pneumocystis jirovecii pneumonia in HIV-negative, non-transplant patients: epidemiology, clinical manifestations, diagnosis, treatment, and prevention. Curr Fungal Infect Rep. (2024). 18:125–35. 10.1007/s 12281-024-00482-8 38948111 PMC 11213562 · doi ↗ · pubmed ↗
- 2Xue T Kong X Ma L. Trends in the epidemiology of pneumocystis pneumonia in immunocompromised patients without HIV infection. J Fungi (Basel). (2023) 9:812. 10.3390/jof 9080812 37623583 PMC 10455156 · doi ↗ · pubmed ↗
- 3Vargas Barahona L Molina KC Pedraza-Arévalo LC Sillau S Tagawa A Scherger S Previous corticosteroid exposure associates with an increased Pneumocystis jirovecii pneumonia mortality among HIV-negative patients: a global research network with a follow-up multicenter case-control study. Ther Adv Infect Dis. (2023) 10:20499361231159481. 10.1177/20499361231159481 36938147 PMC 10017958 · doi ↗ · pubmed ↗
- 4Ibrahim A Chattaraj A Iqbal Q Anjum A Ur Rehman ME Aijaz Z Pneumocystis jiroveci pneumonia: a review of management in human immunodeficiency virus (HIV) and non-HIV immunocompromised patients. Avicenna J Med. (2023) 13:23–34. 10.1055/s-0043-1764375 36969352 PMC 10038753 · doi ↗ · pubmed ↗
- 5Taniguchi J Aso S Jo T Matsui H Fushimi K Yasunaga H. Prognostic factors of in-hospital mortality in patients without human immunodeficiency virus infection with pneumocystis pneumonia: a retrospective cohort study. Intern Med. (2025) 64:651–7. 10.2169/internalmedicine.4090-24 39085068 PMC 11949669 · doi ↗ · pubmed ↗
- 6Lee J Eom JS Shi HJ Hong SH Park Y. Comparison of clinical characteristics of pneumocystis pneumonia with or without human immunodeficiency virus: a prognosis contrary to initial clinical features. Yonsei Med J. (2025) 66:722–30. 10.3349/ymj.2025.0058 41145307 PMC 12568441 · doi ↗ · pubmed ↗
- 7Peng Y Wu Q Zhou Q Yang Z Yin F Wang L Identification of immune-related genes concurrently involved in critical illnesses across different etiologies: a data-driven analysis. Front Immunol (2022) 13:858864. 10.3389/fimmu.2022.858864 35615364 PMC 9124755 · doi ↗ · pubmed ↗
- 8YeşildağM Özkan Bakdık B Balasar B Eroğlu E. Evaluation of the relationship between biomarkers and disease severity in patients with community-acquired pneumonia. Eur J Therap. (2024) 30:354–61. 10.58600/eurjther 1976 · doi ↗