Facial emotion recognition deficits in bipolar disorder: A systematic review and meta-analysis
Michele De Prisco, Vincenzo Oliva, Chiara Possidente, Giovanna Fico, Laura Montejo, Lydia Fortea, Hanne Lie Kjærstad, Kamilla Woznica Miskowiak, Gerard Anmella, Diego Hidalgo-Mazzei, Alessandro Miola, Michele Fornaro, Andrea Murru, Eduard Vieta, Joaquim Radua

TL;DR
People with bipolar disorder have trouble recognizing facial emotions, which affects their social life and could be a key part of the condition.
Contribution
This study provides the first comprehensive meta-analysis comparing facial emotion recognition in bipolar disorder patients, relatives, and healthy controls.
Findings
Bipolar disorder patients show significantly lower accuracy and slower reaction times in facial emotion identification tasks compared to healthy controls.
Facial emotion discrimination accuracy is also reduced in bipolar disorder patients, but reaction times remain similar to controls.
No significant differences in facial emotion recognition were found between bipolar disorder patients and their unaffected relatives.
Abstract
Bipolar disorder (BD) is associated with impairments in facial emotion recognition (FER), affecting social functioning and quality of life. Understanding FER deficits in BD is crucial for tailoring interventions and improving treatment outcomes. This systematic review and meta-analysis aims to evaluate FER differences among individuals with BD, unaffected first-degree relatives (FDRs), and healthy controls (HCs), exploring predictors related to patient and study characteristics. We systematically searched PubMed/MEDLINE, Scopus, EMBASE, and PsycINFO databases from inception to March 28, 2024. Random-effects meta-analyses were conducted to explore differences in accuracy and reaction time during FER identification and discrimination tasks. A total of 100 studies were included, comprising 4920 individuals with BD (females = 56%, mean age = 34.1 ± 9.1), 676 FDRs (females = 55%, mean age…
Genes, proteins, chemicals, diseases, species, mutations and cell lines named across the full text — each resolved to its canonical identifier and authoritative record.
Click any figure to enlarge with its caption.
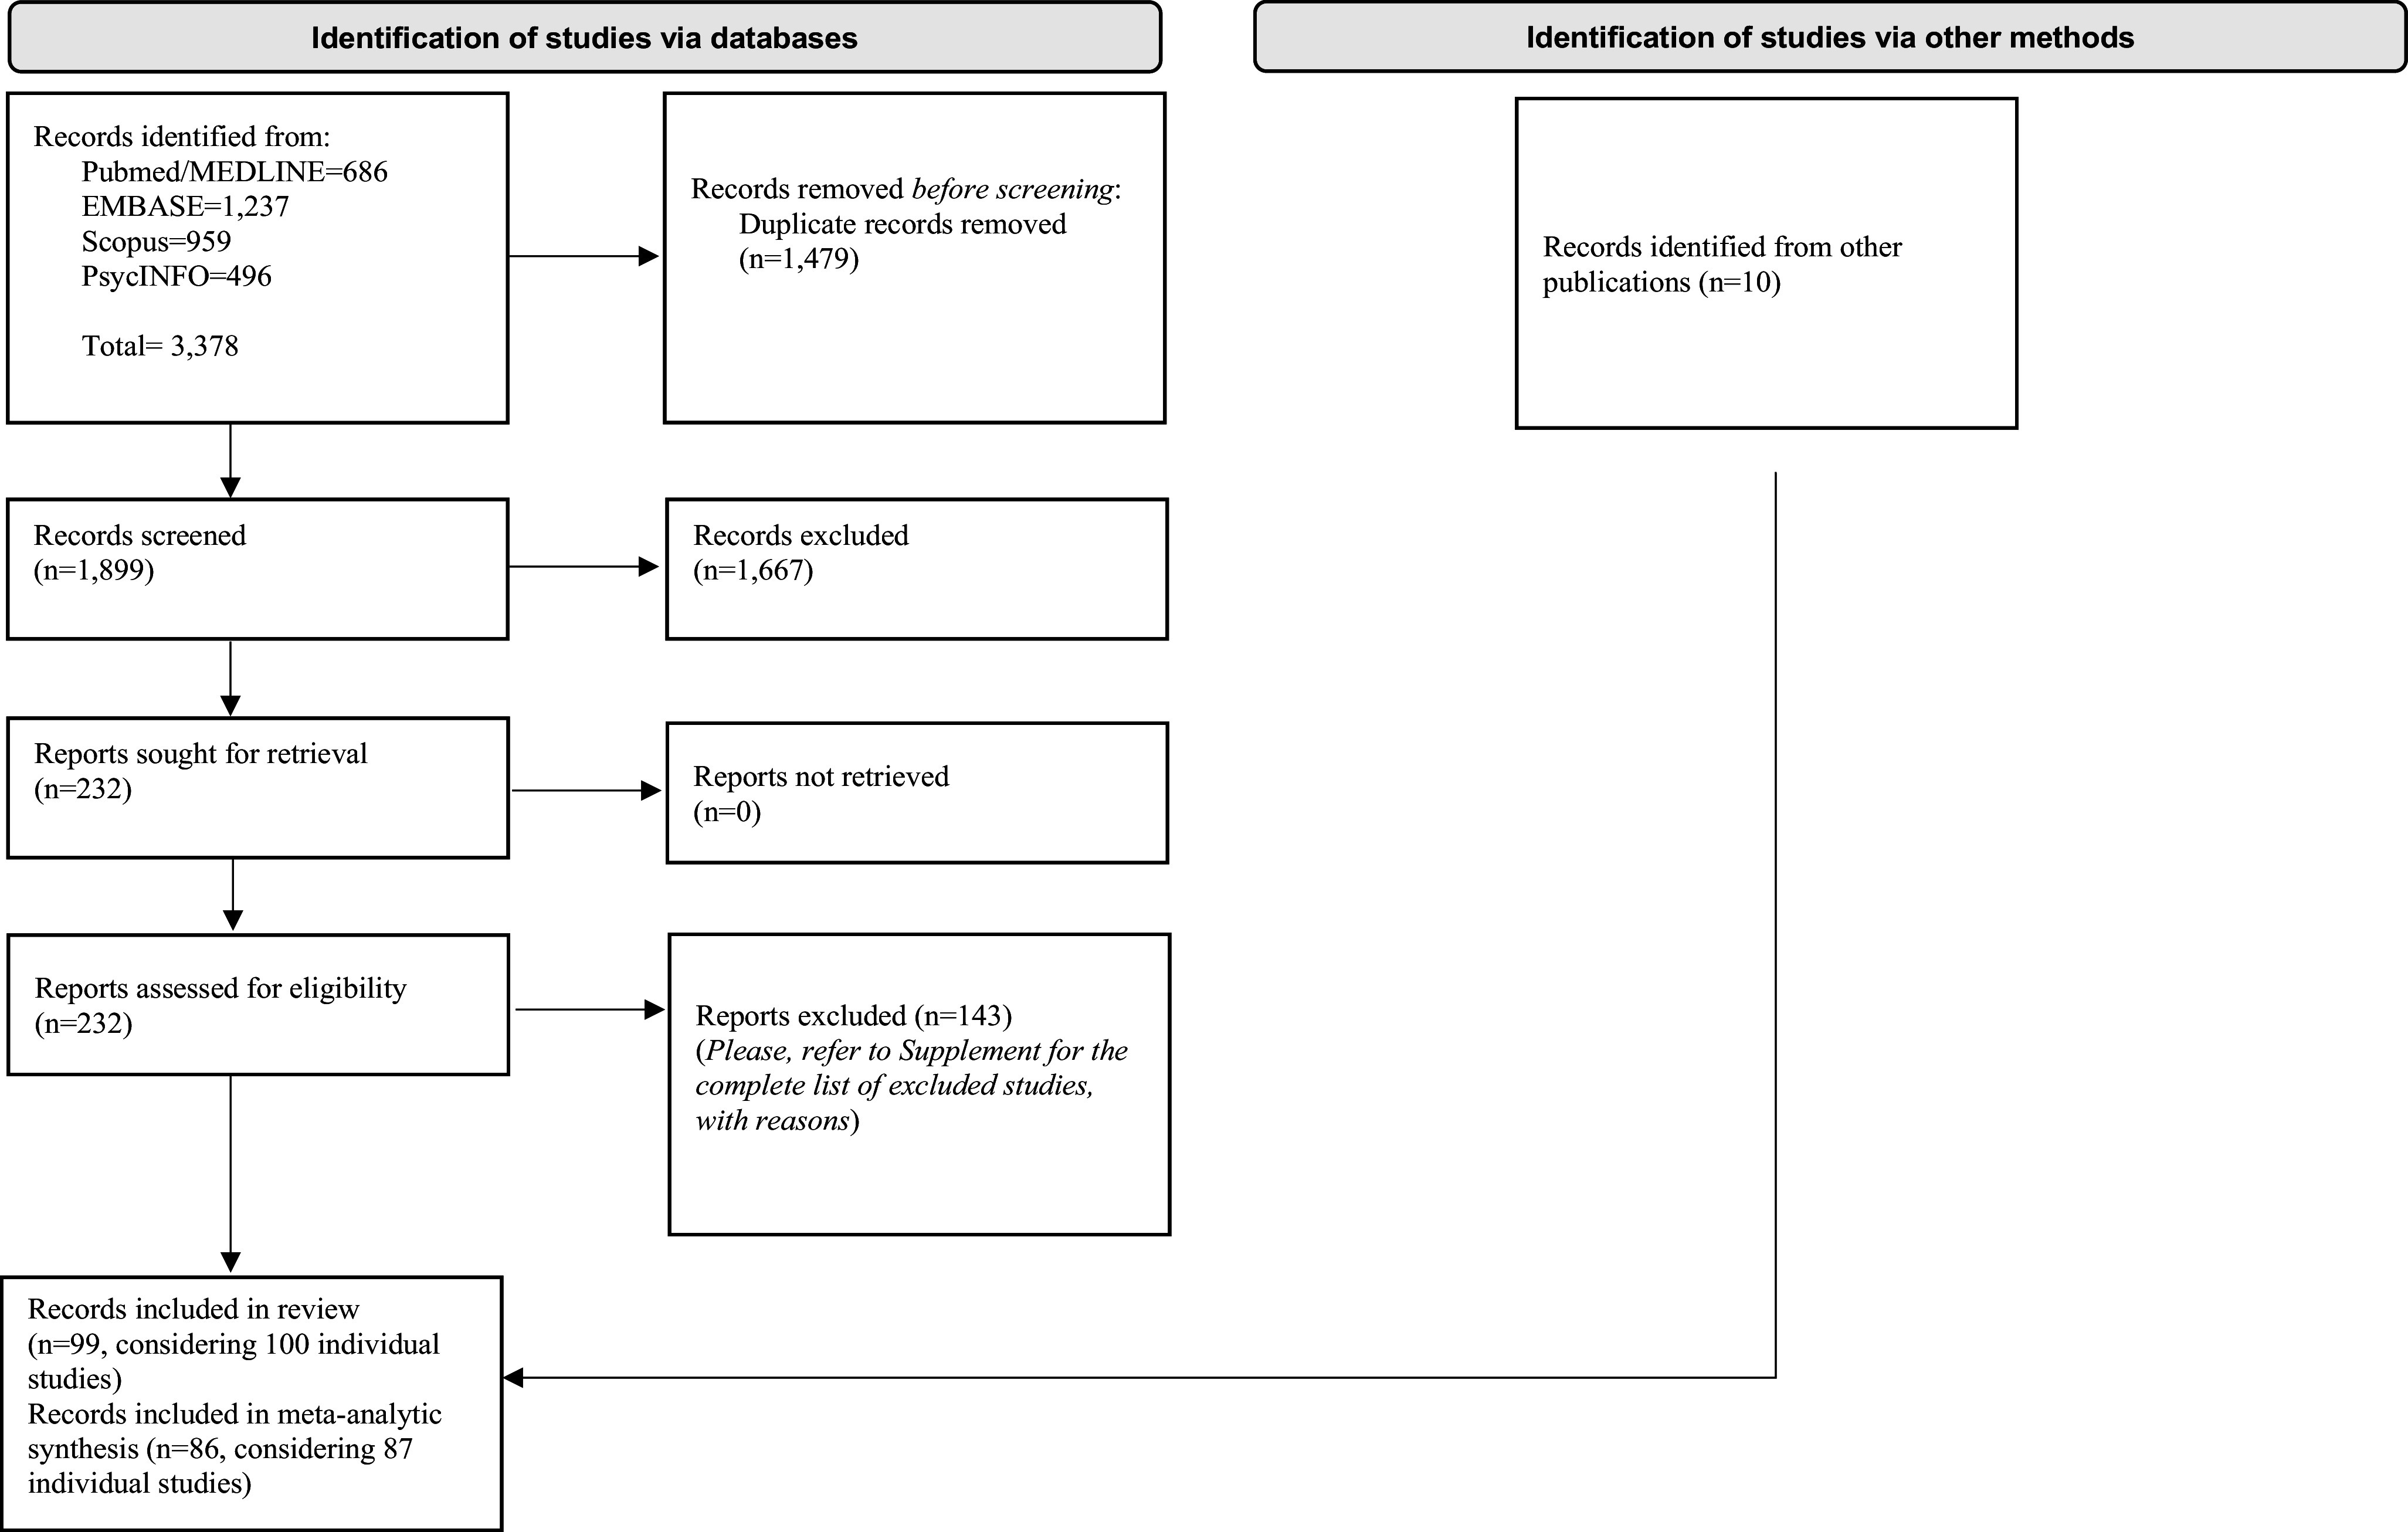 Figure 1
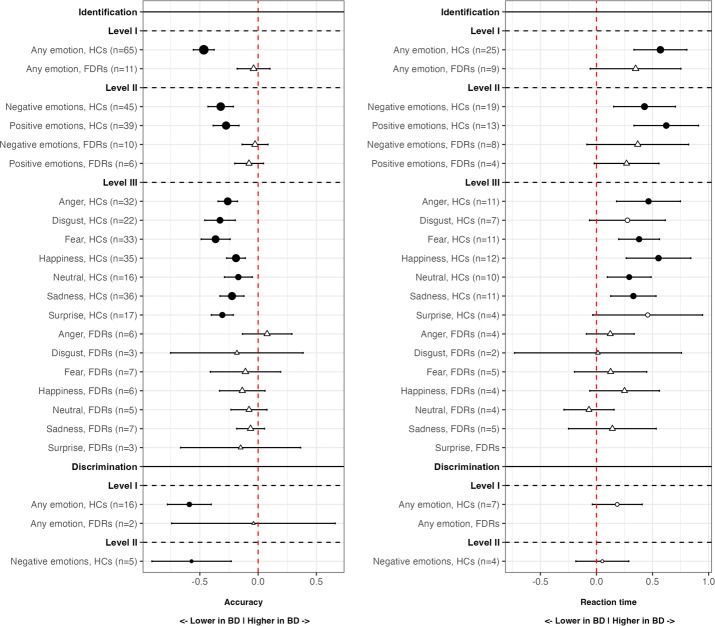 Figure 2
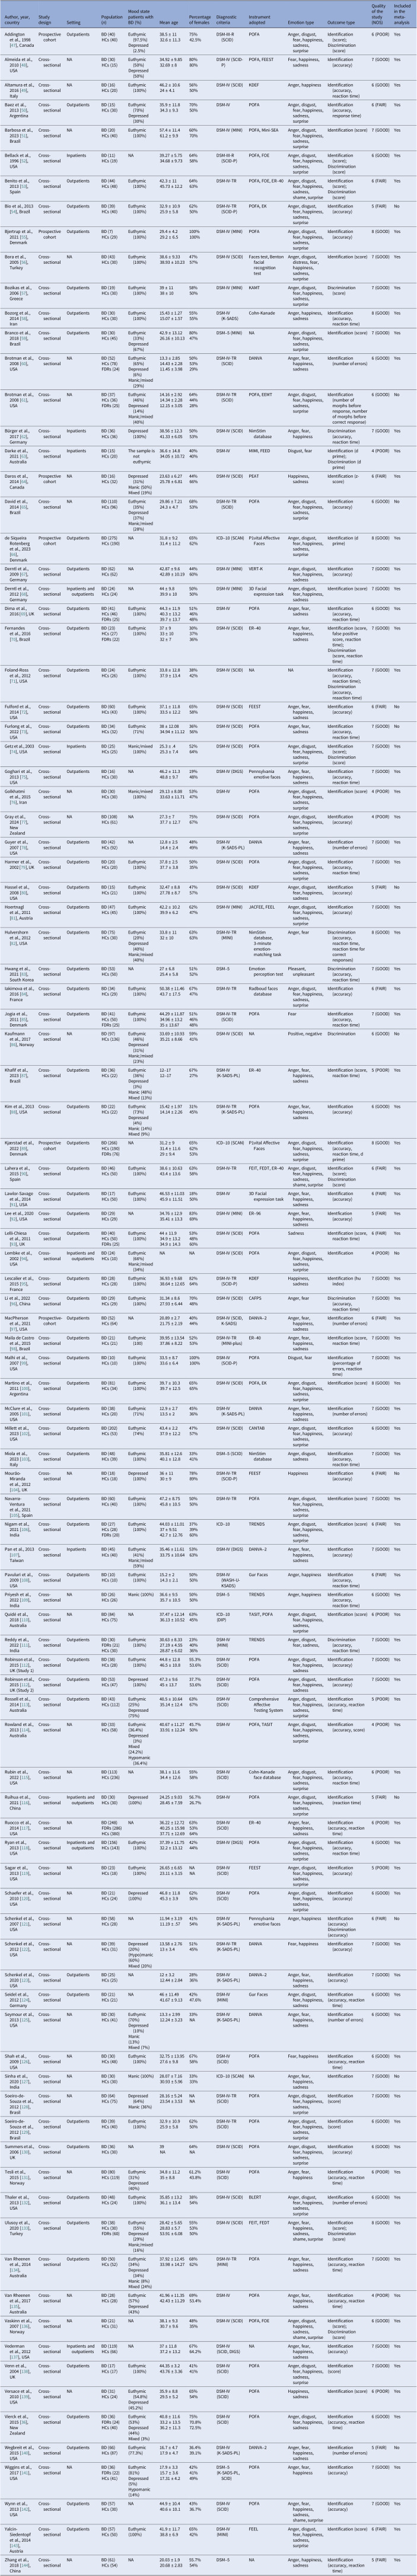 Figure 3
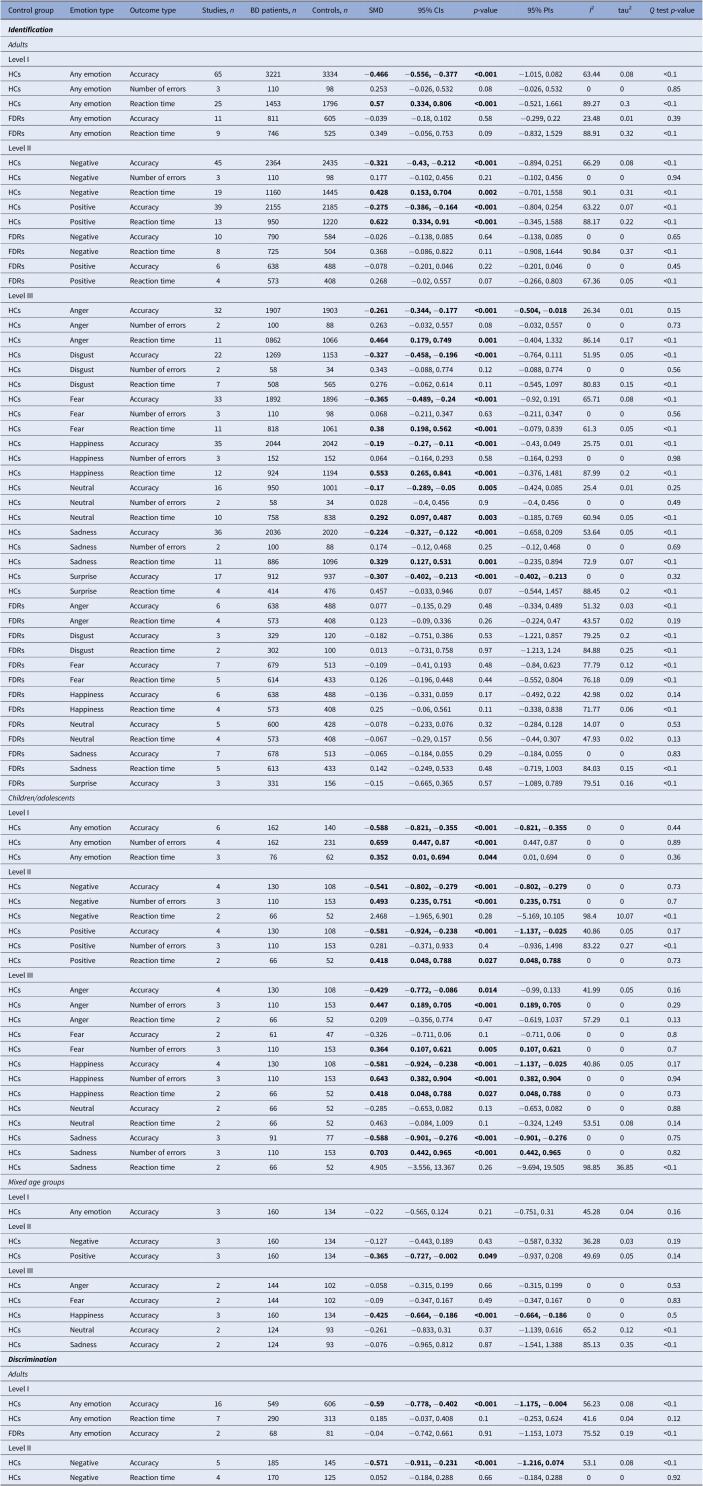 Figure 4
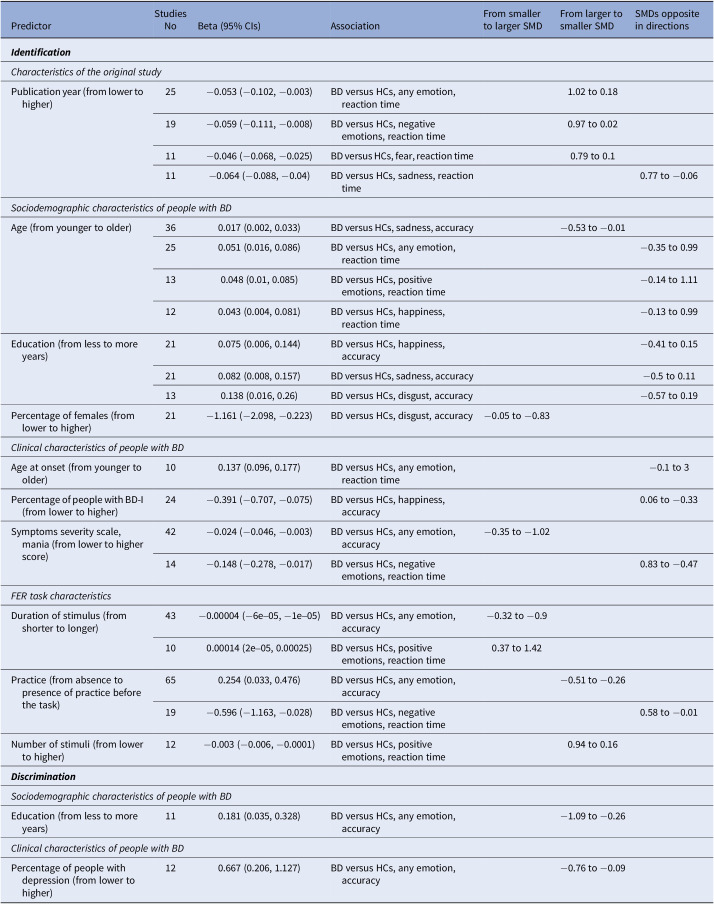 Figure 5
Peer Reviews
No public reviews on file for this paper yet. If you reviewed it on a platform where reviews are public (OpenReview, ICLR, NeurIPS, ICML), you can paste yours below so the community can read it here.
Videos
No videos yet. Explain this paper in a talk, walkthrough, or lecture? Add one.
Taxonomy
TopicsBipolar Disorder and Treatment · Schizophrenia research and treatment · Electroconvulsive Therapy Studies
Introduction
Bipolar disorder (BD) is a severe mental illness characterized by significant fluctuations in emotions, energy levels, and thoughts, affecting up to 1.1% of the world’s population [1]. In addition to mood symptoms, individuals with BD often experience cognitive impairments. Cognition broadly includes both neurocognition, which incorporates core mental processes such as memory, attention, and executive functions, and affective cognition (AC), which involves functions related to perceiving, interpreting, and responding to emotional stimuli, representing an integration of emotional and neurocognitive processes [2]. These domains collectively shape how individuals perceive, process, and respond to the world around them. Understanding these aspects is particularly important in conditions like BD, since impairments in these domains can profoundly impact daily functioning, interpersonal relationships, and overall quality of life [3]. While neurocognitive impairments have been extensively studied and recognized in BD [4], there has been a growing interest in AC as a key area of investigation, due to its crucial role in everyday interactions, contributing to social adaptation and integration [5]. AC incorporates various interconnected domains, including emotional intelligence, emotional decision-making, reward and punishment processing, emotion regulation, and facial emotion recognition (FER) [6]. Individuals with BD exhibit several alterations across these domains, including impaired emotional intelligence [7], disrupted decision making [8], and difficulties in emotion regulation [9]. Among these components of AC, FER is the ability to identify and discriminate the emotional meaning of specific facial expressions displayed by other people, typically categorized into six basic and discrete emotions (i.e., anger, disgust, fear, happiness, sadness, and surprise) [10]. FER serves as a bridge between cognitive and emotional processes, and it is critical for interacting and communicating with others, allowing individuals to make appropriate cognitive and behavioral adaptations during interpersonal exchanges [5]. Deficits in FER can have a critical impact on people’s ability to function in daily life, including in work and in social settings [11]. The International Society of Bipolar Disorder Targeting Cognition Task Force [6] emphasized the significance of understanding deficits in AC, including FER, in individuals with BD. This understanding is essential for uncovering the neurobiological basis of these impairments and for developing targeted treatments that go beyond symptom control, to improve patient-centered outcomes, including functioning, well-being, and overall quality of life. To quantify the magnitude of FER impairments in BD, we previously conducted a systematic review and meta-analysis [12] comparing patients with BD with individuals with other psychiatric disorders. Our findings revealed that individuals with BD showed a better FER performance compared to those with schizophrenia, but performed worse than individuals with major depressive disorder.
Currently, there is a lack of meta-analytic evidence to quantify whether and how FER differs between BD patients, unaffected first-degree relatives (FDRs), and healthy controls (HCs), relevant for guiding future research and clinical practice. Therefore, this systematic review and meta-analysis aims to (a) investigate FER performance in BD compared with FDRs and HCs, and (b) identify potential predictors that might influence FER performance.
Methods
This systematic review and meta-analysis were conducted according to the Meta-analysis Of Observational Studies in Epidemiology (MOOSE) guidelines [13]. The protocol was registered on PROSPERO (CRD42023422035). The MOOSE checklist and deviations from the protocol are reported in Supplementary Appendix I.
Identification and selection of studies
The PubMed/MEDLINE, Scopus, EMBASE, and PsycINFO databases were searched from inception to March 28, 2024. Search strategies are provided in Supplementary Appendix II. Reference lists of each included study, textbooks, and other materials were searched to identify additional studies. Inclusion criteria required original studies (a) to provide quantitative data on FER, (b) in people diagnosed with BD (c) according to the Diagnostic and Statistical Manual for Mental Disorders or the International Classification of Diseases diagnostic criteria, (d) and compared with unaffected FDRs (i.e., without BD) or HCs. Both observational and interventional studies were considered, but only baseline data were collected. No age, sample size, or language restrictions were applied. Where populations overlapped across multiple studies, the largest study with the most representative data, or the most recent, was preferred. Exclusion criteria included (a) reviews, (b) case reports, (c) case series, (d) studies not peer-reviewed, (e) studies that were retracted after publication, and (f) animal studies. Three authors (MDP, VO, CP) independently examined studies of potential interest at both title and abstract and full-text screening, and in case of disagreement, another author (JR) was consulted. The same three authors independently extracted relevant data regarding outcome measures and study characteristics. In cases of insufficient data, corresponding authors were contacted twice.
Risk of bias
Three authors (MDP, VO, CP) independently evaluated the risk of bias of included studies using the Newcastle-Ottawa Scale (NOS) [14], and another author (JR) resolved disagreements. The NOS scores were converted to Agency for Healthcare Research and Quality (AHRQ) standards, as done elsewhere [12].
Outcomes
FER tasks focusing on emotion identification (i.e., the ability to match an emotional stimulus with its corresponding emotion) or discrimination (i.e., the ability to discriminate whether two presented faces show the same emotion or not) were studied. Any outcome aimed at exploring the differences in FER was considered eligible for inclusion. “Accuracy” was defined as any measure assessing the overall correct recognition of emotions (e.g., percentage of correct recognition, scores from specific scales evaluating the number of emotions correctly identified, and author-defined accuracy). “Reaction time” was defined as the time elapsed before responding, and “number of errors” referred to the count of errors made by individuals during a FER task.
Statistical analysis
Random-effect meta-analyses (restricted maximum-likelihood estimator) [15] were conducted through the R-package “metafor” [16], using R, version 4.3.1 [17]. The results were presented for each outcome according to a three-level scheme, as done in our previous studies [12, 18]. Level one represents a global measure of FER, referring to the overall ability to recognize any emotion. Level two is a measure of FER based on emotion valence, distinguishing between negative (i.e., anger, disgust, fear, or sadness), or positive (i.e., happiness or surprise) emotions. Level three is a measure of FER based on specific emotions analyzed separately (i.e., anger, disgust, fear, happiness, sadness, or surprise). A graphical representation of this three-level scheme is presented in Supplementary Appendix II. When studies did not provide information at all levels, we hierarchically derived missing levels to maximize data inclusion, where possible. Specifically: (a) when studies provided only level-three data (i.e., relative to specific emotions), we computed mean values for emotions belonging to the same valence (i.e., negative or positive) to obtain level-two information; (b) when studies reported level-three data without an overall measure of FER, we computed mean values across all available individual emotions to obtain level-one information; (c) when studies reported only level-two data (i.e., positive or negative emotion scores), we computed mean values across them to derive level-one information. Standardized mean differences (SMD) with their confidence intervals (CIs) were used as effect sizes and represented by Hedge’s g. These values can be interpreted as indicating small (SMD = 0.2), moderate (SMD = 0.5), or large (SMD = 0.8) effects, based on their magnitude [19]. Heterogeneity was assessed by using Cochran’s Q test [20], τ ^2^ and I ^2^ statistics [21]. Prediction intervals were calculated. For the associations analyzed at level one, meta-regression analyses were conducted according to the following predictors considering original study characteristics (i.e., primary or secondary outcome, and publication year), sociodemographic (i.e., % of females, mean age, and years of education), clinical characteristics of people with BD (i.e., % of people in (hypomania), % of people in depression, % of people in euthymia, % of BD-I, age at onset, duration of illness, depression symptoms severity, and manic symptoms severity), and FER task characteristics (i.e., duration of the stimulus, duration of the inter-stimulus interval, maximum emotion intensity, minimum emotion intensity, presence of morphing, number of emotions considered in the whole task, number of stimuli, presence of practice, and presence of neutral faces), when at least 10 studies providing this data were available. For the associations analyzed at the levels two and three, the same meta-regression analyses were conducted when the Cochran’s Q test presented a p < 0.10 or the I ^2^ statistic showed a value >50%, and when at least 10 studies providing this data were available. Sensitivity analyses were conducted to explore the robustness of the results: (a) excluding one study at a time from the main analysis (i.e., leave-one-out); (b) by including only good-quality studies according to AHRQ standards; (c) by removing those studies whose lower-level data were calculated from higher-level information (only for levels one and two). Publication bias was explored by visual inspection of funnel plots and using the Egger’s test [22] when at least 10 studies were available.
Results
Overall, 3388 records were identified. After duplicate removal, 1667 were excluded at the title/abstract level and 143 after the full-text evaluation. Finally, 99 papers (considering 100 individual studies) were included, and 86 of them (considering 87 individual studies) provided enough data to perform a meta-analysis comparing people with BD to FDRs or HCs. The flow diagram is reported in Figure 1. Details on included studies are displayed in Table 1. Excluded studies, as well as additional information about the studies included only in the systematic review, are presented in Supplementary Appendices III-IV.Figure 1.Flow diagram of study selection. Table 1.Characteristics of the studies included in the systematic review and meta-analysisAuthor, year, countryStudy designSettingPopulation (n)Mood state patients with BD (%)Mean agePercentage of femalesDiagnostic criteriaInstrument adoptedEmotion typeOutcome typeQuality of the study (NOS)Included in the meta-analysisAddington et al., 1998 [47], CanadaProspective cohortOutpatientsBD (40)HCs (40)Euthymic (97.5%)Depressed (2.5%)38.5 ± 1132.6 ± 11.375%42.5%DSM-III-R (SCID)POFAAnger, disgust, fear, happiness, sadness, surpriseIdentification (score);Discrimination (score)6 (POOR)YesAlmeida et al., 2010 [48], USACross-sectionalNABD (30)HCs (15)Euthymic (50%)Depressed (50%)34.92 ± 9.8532.69 ± 880%80%DSM-IV (SCID-P)POFA, FEESTFear, happiness, sadnessIdentification (accuracy)7 (GOOD)YesAltamura et al., 2016 [49], ItalyCross-sectionalNABD (16)HCs (20)Euthymic (100%)46.2 ± 10.624 ± 4.156%50%DSM-IV (SCID)KDEFAnger, happinessIdentification (accuracy, reaction time)6 (GOOD)YesBaez et al., 2013 [50], ArgentinaCross-sectionalOutpatientsBD (15)HCs (30)Euthymic (70%)Depressed (30%)35.9 ± 11.834.3 ± 9.370%50%DSM-IVPOFAAnger, disgust, fear, happiness, sadness, surpriseIdentification (accuracy, response time)6 (FAIR)YesBarbosa et al., 2023 [51], BrazilCross-sectionalNABD (20)HCs (40)Euthymic (100%)57.4 ± 11.461.2 ± 9.960%70%DSM-IV (MINI)POFA, Mini-SEAAnger, disgust, fear, happiness, sadness, surpriseIdentification (score)7 (GOOD)YesBellack et al., 1996 [52], USACross-sectionalInpatientsBD (11)HCs (19)NA39.27 ± 5.7534.68 ± 9.7364%58%DSM-III-R (SCID-P)POFA, FOEAnger, disgust, fear, happiness, sadness, surpriseIdentification (score);Discrimination (score)6 (GOOD)YesBenito et al., 2013 [53], SpainCross-sectionalOutpatientsBD (44)HCs (48)Euthymic (100%)42.3 ± 1145.73 ± 12.264%63%DSM-IV-TRPOFA, FOE, ER–40Anger, disgust, fear, happiness, sadness, shame, surpriseIdentification (score);Discrimination (score)6 (FAIR)YesBio et al., 2013 [54], BrazilCross-sectionalOutpatientsBD (39)HCs (40)Euthymic (100%)32.9 ± 10.925.9 ± 5.862%50%DSM-IV-TR (SCID-P)POFA, EKAnger, disgust, fear, happiness, sadness, surpriseIdentification (accuracy)5 (FAIR)NoBjertrup et al., 2021 [55], DenmarkProspective cohortOutpatientsBD (7)HCs (29)Euthymic (100%)29.4 ± 4.229.2 ± 6.5100%100%DSM-IV (MINI)POFAAnger, disgust, fear, happiness, sadness, surpriseIdentification (accuracy)8 (GOOD)YesBora et al., 2005 [56], TurkeyCross-sectionalNABD (43)HCs (30)Euthymic (100%)38.6 ± 9.3338.93 ± 10.2347%57%DSM-IV (SCID)Faces test, Benton facial recognition testAnger, disgust, distress, fear, happiness, sadness, surpriseIdentification (score)7 (GOOD)YesBozikas et al., 2006 [57], GreeceCross-sectionalOutpatientsBD (19)HCs (30)Euthymic (100%)39 ± 1138 ± 1058%50%DSM-IV (MINI)KAMTAnger, disgust, fear, happiness, sadness, surpriseDiscrimination (score)7 (GOOD)YesBozorg et al., 2014 [58], IranCross-sectionalOutpatientsBD (30)HCs (30)Euthymic (100%)15.43 ± 1.2715.07 ± 1.5755%55%DSM-IV (K-SADS)Cohn-KanadeAnger, happiness, sadnessIdentification (accuracy, reaction time)8 (GOOD)YesBranco et al., 2018 [59], BrazilCross-sectionalOutpatientsBD (30)HCs (45)Euthymic (33%)Depressed (67%)42.9 ± 13.1226.16 ± 10.1380%47%DSM–5 (MINI)NAAnger, disgust, fear, happiness, sadness, surpriseIdentification (score)7 (GOOD)YesBrotman et al., 2008 [60], USACross-sectionalNABD (52)HCs (78)FDRs (24)Euthymic (65%)Depressed (6%)Manic/mixed (29%)13.3 ± 2.8514.43 ± 2.2811.45 ± 3.9850%53%29%DSM-IV-TR (SCID)DANVAAnger, fear, happiness, sadnessIdentification (number of errors)6 (GOOD)YesBrotman et al., 2008 [61], USACross-sectionalNABD (37)HCs (36)FDRs (25)Euthymic (46%)Depressed (14%)Manic/mixed (40%)14.16 ± 2.9214.34 ± 2.2812.15 ± 3.0564%44%28%DSM-IV-TR (SCID)POFA, EEMTAnger, disgust, fear, happiness, sadness, surpriseIdentification (number of morphs before response, number of morphs before correct response)6 (GOOD)NoBürger et al., 2017 [62], GermanyCross-sectionalInpatientsBD (36)HCs (36)Depressed (100%)38.56 ± 12.341.33 ± 6.0550%53%DSM-IV (SCID)NimStim databaseAnger, fear, happinessDiscrimination (accuracy, reaction time)7 (GOOD)YesDarke et al., 2021 [63], AustraliaCross-sectionalInpatientsBD (15)HCs (20)The sample is not euthymic36.6 ± 14.834.05 ± 10.7240%40%DSM-IVMIMI, FEEDDisgust, fearIdentification (d prime);Discrimination (d prime)4 (POOR)YesDaros et al., 2014 [64], CanadaProspective cohortNABD (16)HCs (32)Depressed (31%)Manic (50%)Mixed (19%)23.63 ± 6.2725.78 ± 6.8144%66%DSM-IV (SCID)PEATHappiness, sadnessIdentification (z-score)6 (FAIR)YesDavid et al., 2014 [65], BrazilCross-sectionalNABD (110)HCs (96)Euthymic (35%)Depressed (37%)Manic/mixed (28%)29.86 ± 7.2124.3 ± 4.768%53%DSM-IV-TR (SCID)POFAAnger, disgust, fear, happiness, sadness, surpriseIdentification (accuracy)6 (GOOD)Node Siqueira Rotenberg et al., 2023 [66], DenmarkProspective cohortOutpatientsBD (275)HCs (190)NA31.8 ± 9.231.4 ± 11.265%62%ICD–10 (SCAN)P1vital Affective FacesAnger, disgust, fear, happiness, sadness, surpriseIdentification (d prime)8 (GOOD)YesDerntl et al., 2009 [67], GermanyCross-sectionalOutpatientsBD (62)HCs (62)NA42.87 ± 9.642.89 ± 10.1944%60%DSM-IV (MINI)VERT-KAnger, disgust, fear, happiness, sadnessIdentification (accuracy)7 (GOOD)YesDerntl et al., 2012 [68], GermanyCross-sectionalInpatients and outpatientsBD (24)HCs (24)NA44 ± 9.839.9 ± 1050%50%DSM-IV (MINI)3D Facial expression taskAnger, disgust, fear, happiness, sadnessIdentification (score)7 (GOOD)YesDima et al., 2016 [69], UKCross-sectionalOutpatientsBD (41)HCs (46)FDRs (25)Euthymic (100%)44.3 ± 11.940.3 ± 13.239.7 ± 13.751%46%48%DSM-IVPOFAAnger, fear, sadnessIdentification (accuracy, reaction time)6 (GOOD)YesFernandes et al., 2016 [70], BrazilCross-sectionalOutpatientsBD (23)HCs (27)FDRs (22)Euthymic (100%)37 ± 933 ± 1032 ± 730%37%36%DSM-IV (SCID)ER–40Anger, fear, happiness, sadnessIdentification (score, false positive score, reaction time);Discrimination (score, reaction time)7 (GOOD)YesFoland-Ross et al., 2012 [71], USACross-sectionalOutpatientsBD (24)HCs (26)Euthymic (100%)33.8 ± 12.837.9 ± 13.438%42%DSM-IV (SCID)NANAIdentification (accuracy, reaction time);Discrimination (accuracy, reaaction time)7 (GOOD)YesFulford et al., 2014 [72], USACross-sectionalOutpatientsBD (60)HCs (43)Euthymic (100%)37.1 ± 11.833.5 ± 12.265%58%DSM-IV (SCID)FEESTAnger, fear, happiness, sadnessIdentification (accuracy)6 (FAIR)NoFurlong et al., 2022 [73], USACross-sectionalOutpatientsBD (34)HCs (32)Euthymic (71%)38 ± 12.0834.94 ± 11.1236%56%DSM-IV (SCID)POFAAnger, fear, sadnessIdentification (accuracy, reaction time)7 (GOOD)NoGetz et al., 2003 [74], USACross-sectionalInpatientsBD (25)HCs (25)Manic/mixed (100%)25.3 ± .425.3 ± 7.452%64%DSM-IV (SCID)POFAAnger, disgust, fear, happiness, sadness, surpriseIdentification (score);Discrimination (score)7 (GOOD)YesGoghari et al., 2013 [75], USACross-sectionalOutpatientsBD (16)HCs (30)NA46.2 ± 11.348.8 ± 9.719%48%DSM-IV (DIGS)Pennsylvania emotive facesAnger, fear, happiness, sadnessIdentification (accuracy, reaction time)7 (GOOD)YesGolkhatmi et al., 2015 [76], IranCross-sectionalNABD (30)HCs (30)Manic/mixed (100%)29.13 ± 8.0833.63 ± 11.7153%47%DSM-IVPOFAAnger, disgust, fear, happiness, sadness, surpriseIdentification (score)4 (POOR)YesGray et al., 2024 [77], New ZealandCross-sectionalNABD (108)HCs (61)NA27.3 ± 737.7 ± 12.775%67%DSM-IV (SCID)POFAAnger, disgust, fear, happiness, sadness, surpriseIdentification (accuracy)4 (POOR)YesGuyer et al., 2007 [78], USACross-sectionalOutpatientsBD (42)HCs (92)NA12.8 ± 2.514.4 ± 2.448%49%DSM-IV (K-SADS-PL)DANVAAnger, fear, happiness, sadnessIdentification (number of errors)7 (GOOD)YesHarmer et al., 2002 [79], UKCross-sectionalOutpatientsBD (20)HCs (20)Euthymic (100%)37.8 ± 2.537.7 ± 3.850%35%DSM-IV (SCID)POFAAnger, disgust, fear, happiness, sadness, surpriseIdentification (accuracy, reaction time)7 (GOOD)YesHassel et al., 2008 [80], USACross-sectionalOutpatientsBD (15)HCs (21)Euthymic (100%)32.47 ± 8.827.78 ± 8.747%57%DSM-IV (SCID)KDEFAnger, disgust, fear, happiness, sadnessIdentification (accuracy)5 (FAIR)NoHoertnagl et al., 2011 [81], AustriaCross-sectionalOutpatientsBD (47)HCs (45)Euthymic (100%)42.2 ± 10.239.9 ± 6.262%47%DSM-IV (MINI)JACFEE, FEELAnger, disgust, fear, happiness, sadness, surpriseIdentification (accuracy)7 (GOOD)YesHulvershorn et al., 2012 [82], USACross-sectionalOutpatientsBD (75)HCs (30)Euthymic (20%)Depressed (40%)Manic/mixed (40%)33.8 ± 1132 ± 1063%63%DSM-IV-TR (MINI)NimStim database, 3-minute emotion-matching taskAnger, fearDiscrimination (accuracy, reaction time, reaction time for correct responses)8 (GOOD)YesHwang et al., 2021 [83], South KoreaCross-sectionalOutpatientsBD (53)HCs (50)NA27 ± 6.825.4 ± 5.851%52%DSM–5Emotion perception testPleasant, unpleasantDiscrimination (accuracy, reaction time)7 (GOOD)YesIakimova et al., 2016 [84], FranceCross-sectionalOutpatientsBD (34)HCs (29)Euthymic (100%)50.38 ± 11.4643.7 ± 17.567%47%DSM-IV-TRRadboud faces databaseAnger, disgust, fear, happiness, sadness, surpriseIdentification (accuracy)6 (FAIR)YesJogia et al., 2011 [85], DenmarkCross-sectionalOutpatientsBD (41)HCs (50)FDRs (25)Euthymic (100%)44.29 ± 11.8734.96 ± 13.235 ± 13.6751%46%48%DSM-IV-TR (SCID)POFAFearIdentification (accuracy, reaction time)7 (GOOD)YesKaufmann et al., 2017 [86], NorwayCross-sectionalNABD (97)HCs (136)Euthymic (46%)Depressed (31%)Manic/mixed (23%)33.69 ± 10.9335.21 ± 8.6659%41%DSM-IV (SCID)NAPositive, negativeDiscrimination6 (GOOD)NoKhafif et al., 2023 [87], BrazilCross-sectionalOutpatientsBD (36)HCs (22)Euthymic (36%)Depressed (3%)Manic (48%)Mixed (13%)12–1712–1767%27%DSM-IV(K-SADS-PL)ER–40Anger, fear, happiness, sadnessIdentification (score, reaction time)5 (POOR)YesKim et al., 2013 [88], USACross-sectionalOutpatientsBD (22)HCs (22)Euthymic (73%)Depressed (4%)Manic (14%)Mixed (9%)15.42 ± 1.9714.14 ± 2.2631%45%DSM-IV-TR (K-SADS-PL)POFAAnger, fear, happiness, sadnessIdentification (accuracy)6 (GOOD)YesKjærstad et al., 2022 [89], DenmarkProspective cohortOutpatientsBD (266)HCs (190)FDRs (76)NA31.2 ± 931.4 ± 11.629 ± 9.465%62%53%ICD–10 (SCAN)P1vital Affective FacesAnger, disgust, fear, happiness, sadness, surpriseIdentification (accuracy, reaction time, d prime)8 (GOOD)YesLahera et al., 2015 [90], SpainCross-sectionalOutpatientsBD (46)HCs (50)Euthymic (100%)38.6 ± 10.6343.4 ± 13.663%58%DSM-IV-TRFEIT, FEDT, ER–40Anger, disgust, fear, happiness, sadness, shame, surpriseIdentification (score);Discrimination (score)6 (FAIR)YesLawlor-Savage et al., 2014 [91], USACross-sectionalOutpatientsBD (17)HCs (50)Euthymic (100%)46.53 ± 11.0345.9 ± 11.5118%50%DSM-IV3D Facial expression taskAnger, fear, happiness, sadnessIdentification (accuracy)6 (FAIR)YesLee et al., 2020 [92], USACross-sectionalOutpatientsBD (29)HCs (29)NA34.76 ± 12.935.41 ± 13.383%69%DSM-IV (MINI)ER–96Anger, fear, happiness, sadnessIdentfication (accuracy)5 (FAIR)YesLelli-Chiesa et al., 2011 [93], UKCross-sectionalOutpatientsBD (40)HCs (50)FDRs (25)Euthymic (100%)44 ± 11.934.9 ± 13.234.9 ± 14.353%48%60%DSM-IV (SCID)POFASadnessIdentification (score, reaction time)6 (FAIR)YesLembke et al., 2002 [94], USACross-sectionalInpatients and outpatientsBD (24)HCs (10)Euthymic (66%)Manic/mixed (34%)NANADSM-IV (SCID)POFAAnger, disgust, fear, happiness, sadness, surpriseIdentification4 (POOR)NoLescalier et al., 2015 [95], FranceCross-sectionalOutpatientsBD (28)HCs (28)Euthymic (100%)36.93 ± 9.6838.64 ± 12.6582%64%DSM-IV-TR (SCID-P)KDEFHappiness, sadnessIdentification (hu index)7 (GOOD)YesLi et al., 2022 [96], ChinaCross-sectionalOutpatientsBD (29)HCs (29)Euthymic (100%)31.34 ± 8.627.93 ± 6.4470%48%DSM-IV (SCID)CAFPSAnger, fearDiscrimination (accuracy, reaction time)7 (GOOD)YesMacPherson et al., 2021 [97], USAProspective-cohortOutpatientsBD (52)HCs (64)NA20.89 ± 2.721.75 ± 2.1940%44%DSM-IV (SCID, K-SADS)DANVA–2Anger, fear, happiness, sadnessIdentification (number of errors)6 (FAIR)YesMaila de Castro et al., 2015 [98], BrazilCross-sectionalOutpatientsBD (21)HCs (21)Euthymic (100)39.95 ± 13.5437.86 ± 8.2252%53%DSM-IV-TR (MINI-plus)ER–40Anger, fear, happiness, sadnessIdentification (score, reaction time)7 (GOOD)YesMalhi et al., 2007 [99], USACross-sectionalOutpatientsBD (10)HCs (10)Euthymic (100%)33.5 ± 8.733.6 ± 6.4100%100%DSM-IV (SCID-P)POFADisgust, fearIdentification (percentage of errors, reaction time)7 (GOOD)YesMartino et al., 2011 [100], ArgentinaCross-sectionalOutpatientsBD (81)HCs (34)Euthymic (100%)39.7 ± 10.339.7 ± 12.565%65%DSM-IV (SCID)POFA, EKAnger, disgust, fear, happiness, sadness, surpriseIdentification (score)8 (GOOD)YesMcClure et al., 2005 [101], USACross-sectionalOutpatientsBD (38)HCs (20)Euthymic (71%)12.9 ± 2.713.5 ± 245%36%DSM-IV (K-SADS-PL)DANVAAnger, fear, happiness, sadnessIdentification (number of errors)7 (GOOD)YesMillett et al., 2023 [102], USACross-sectionalOutpatientsBD (202)HCs (53)Euthymic (74%)43.4 ± 2.237.9 ± 12.247%57%DSM-IV (SCID)CANTABAnger, disgust, fear, happiness, sadness, surpriseIdentification (accuracy)6 (GOOD)YesMiola et al., 2023 [103], ItalyCross-sectionalOutpatientsBD (48)HCs (39)Euthymic (100%)35.81 ± 12.640.1 ± 12.833%41%DSM–5 (SCID)NimStim databaseAnger, disgust, sadnessIdentification (accuracy, reaction time)7 (GOOD)YesMourão-Miranda et al., 2012 [104], UKCross-sectionalNABD (18)HCs (18)Depressed (100%)36 ± 1130 ± 978%89%DSM-IV-TR (SCID-P)FEESTHappinessIdentification (accuracy)6 (FAIR)NoNavarra-Ventura et al., 2021 [105], SpainCross-sectionalOutpatientsBD (60)HCs (40)Euthymic (100%)47.2 ± 8.7545.8 ± 10.550%50%DSM-IV-TRPOFAAnger, disgust, fear, happiness, sadness, surpriseIdentification (score)7 (GOOD)YesNigam et al., 2021 [106], IndiaCross-sectionalOutpatientsBD (27)HCs (28)FDRs (20)Euthymic (100%)44.03 ± 11.0137 ± 9.5142.7 ± 12.7637%39%60%ICD–10TRENDSAnger, disgust, fear, happiness, sadness, surpriseIdentification (score)6 (FAIR)YesPan et al., 2013 [107], TaiwanCross-sectionalInpatientsBD (45)HCs (40)Euthymic (41%)Manic/mixed (59%)35.46 ± 11.6133.75 ± 10.6453%63%DSM-IV (DIGS)DANVA–2Anger, fear, happiness, sadnessIdentification (accuracy)7 (GOOD)YesPavuluri et al., 2009 [108], USACross-sectionalOutpatientsBD (10)HCs (10)Euthymic (100%)15.2 ± 214.3 ± 2.150%50%DSM-IV (WASH-U-KSADS)Gur FacesAnger, happinessIdentification (accuracy, reaction time)6 (FAIR)YesPriyesh et al., 2022 [109], IndiaCross-sectionalNABD (26)HCs (26)Manic (100%)36.6 ± 9.535.7 ± 10.550%50%DSM–5TRENDSAnger, happinessIdentification (accuracy, reaction time)6 (GOOD)YesQuidé et al., 2018 [110], AustraliaCross-sectionalNABD (84)HCs (75)NA37.47 ± 12.1436.13 ± 10.5263%45%ICD–10(DIP)TASIT, POFAAnger, disgust, fear, happiness, sadness, surpriseIdentification (score)6 (POOR)YesReddy et al., 2022 [111], IndiaCross-sectionalOutpatientsBD (30)FDRs (21)HCs (30)Euthymic (100%)30.63 ± 8.3327.19 ± 4.5528.87 ± 6.0223%40%36%DSM-IV(MINI)TRENDSAnger, disgust, fear, sadness,Discrimination (accuracy, reaction time)7 (GOOD)YesRobinson et al., 2015 [112], UK (Study 1)Cross-sectionalOutpatientsBD (38)HCs (28)Euthymic (100%)44.8 ± 12.846.5 ± 10.855.3%53.6%DSM-IV(SCID)POFAAnger, disgust, fear, happiness, sadnessIdentification (accuracy)7 (GOOD)YesRobinson et al., 2015 [112], UK (Study 2)Cross-sectionalOutpatientsBD (53)HCs (47)Depressed (100%)47.3 ± 9.645 ± 13.737.7%53.6%DSM-IV(SCID)POFAAnger, disgust, fear, happiness, sadnessIdentification (accuracy)7 (GOOD)YesRossell et al., 2014 [113], AustraliaCross-sectionalOutpatientsBD (43)HCs (112)Euthymic(25%)Depressed(75%)40.5 ± 10.6435.14 ± 12.463%67%DSM-IV(SCID)Comprehensive Affective Testing SystemAnger, disgust, fear, happiness, sadness, surpriseIdentification(accuracy, reaction time)5 (POOR)YesRowland et al., 2013 [114], AustraliaCross-sectionalNABD (33)HCs (58)Euthymic(36.4%)Depressed (3%)Mixed(24.2%)Hypomanic (36.4%)40.67 ± 11.2733.91 ± 12.2445.7%50%DSM-IVPOFA, TASITAnger, disgust, fear, happiness, sadness, surpriseIdentification (accuracy, score)4 (POOR)YesRubin et al., 2022 [115], USACross-sectionalNABD (113)HCs (236)NA38.1 ± 11.634.4 ± 12.655%58%DSM-IV(SCID)Cohn-Kanade face databaseAnger, disgust, fear, happiness, sadness, surpriseIdentification (accuracy, reaction time)6 (POOR)YesRuihua et al., 2021 [116], ChinaCross-sectionalInpatients and outpatientsBD (30)HCs (30)Depressed(100%)24.25 ± 9.0328.45 ± 7.5956.7%26.7%DSM-IVPOFAAnger, disgust, fear, happiness, sadness, surpriseIdentification (reaction time)5 (FAIR)NoRuocco et al., 2014 [117], USACross-sectionalNABD (248)FDRs (286)HCs (380)NA36.22 ± 12.7240.25 ± 15.9837.71 ± 12.6963%53%64%DSM-IV(SCID)ER–40Anger, fear, happiness, sadnessIdentification(accuracy, reaction time)6 (POOR)YesRyan et al., 2013 [118], USACross-sectionalInpatients and outpatientsBD (156)HCs (143)Euthymic (100%)37.39 ± 11.7532.2 ± 13.1242%44%DSM-IV (DIGS)POFAAnger, disgust, fear, happiness, sadness, surpriseIdentification (accuracy, reaction time)6 (GOOD)YesSagar et al., 2013 [119], USACross-sectionalNABD (23)HCs (18)Euthymic (100%)26.65 ± 6.6523.11 ± 3.15NANADSM-IV(SCID)FEESTAnger, disgust, fear, happiness, sadness, surpriseIdentification (accuracy)5 (POOR)YesSchaefer et al., 2010 [120], USACross-sectionalNABD (21)HCs (24)Depressed(100%)46.8 ± 11.845.3 ± 3.962%50%DSM-IV(SCID)POFAAnger, disgust, fear, happiness, sadness, surpriseIdentification (accuracy)6 (GOOD)YesSchenkel et al., 2007 [121], USACross-sectionalNABD (58)HCs (28)NA11.94 ± 3.1911.19 ± .5741%54%DSM-IV(K-SADS-PL)Pennsylvania emotive facesAnger, happinessIdentification(accuracy)Discrimination(accuracy)6 (FAIR)NoSchenkel et al., 2012 [122], USACross-sectionalNABD (39)HCs (31)Depressed(20%)(Hypo)manic(60%)Mixed (20%)13.58 ± 2.7613 ± 3.451%45%DSM-IV-TR(K-SADS-PL)DANVAFear, happinessIdentification (accuracy)7 (GOOD)YesSchenkel et al., 2020 [123], USACross-sectionalOutpatientsBD (25)HCs (25)NA12 ± 3.212.44 ± 2.8428%36%DSM-IV(K-SADS-PL)DANVA–2Anger, fear, happiness, sadnessIdentification(accuracy)7 (GOOD)YesSeidel et al., 2012 [124], GermanyCross-sectionalOutpatientsBD (21)HCs (21)NA46 ± 11.4941.67 ± 9.1342%47.6%DSM-IV(MINI)Gur FacesAnger, disgust, fear, happiness, sadnessIdentification(accuracy, reaction time)6 (GOOD)YesSeymour et al., 2013 [125], USACross-sectionalNABD (30)HCs (41)Euthymic(70%)Depressed (10%)Manic(13%)Mixed (7%)13.3 ± 2.9912.24 ± 3.2333%NADSM-IV(K-SADS-PL)DANVAAnger, fear, happiness, sadnessIdentification(number of errors)6 (GOOD)YesShah et al., 2009 [126], USACross-sectionalNABD (30)HCs (48)Euthymic (100%)32.75 ± 13.9527.6 ± 9.867%58%DSM-IV(SCID)POFAFear, happinessIdentification(accuracy, reaction time)6 (GOOD)YesSinha et al., 2020 [127], IndiaCross-sectionalNABD (30)HCs (30)Manic (100%)28.07 ± 7.1630.93 ± 5.9633%33%ICD–10 (SCAN)NAAnger, fear, happiness, sadnessIdentification7 (GOOD)NoSoeiro-de-Souza et al., 2012 [128], BrasilCross-sectionalNABD (64)HCs (75)Depressed (64%)Manic (36%)28.16 ± 5.2423.54 ± 3.53NANADSM-IV-TR(SCID)POFAAnger, disgust, fear, happiness, sadness, surpriseIdentification(score)7 (GOOD)YesSoeiro-de-Souza et al., 2012 [129], BrasilCross-sectionalOutpatientsBD (39)HCs (40)Euthymic (100%)32.9 ± 10.925.9 ± 5.862%50%DSM-IV-TR(SCID)POFAAnger, disgust, fear, happiness, sadness, surpriseIdentification(score)6 (GOOD)YesSummers et al., 2006 [130], UKCross-sectionalOutpatientsBD (36)HCs (30)NA39NA64%NADSM-IV (SCID)POFAAnger, disgust, fear, happiness, sadness, surpriseIdentification (accuracy)6 (GOOD)YesTesli et al., 2015 [131], NorwayCross-sectionalNABD (80)HCs (119)Euthymic(31%)Depressed(40%)34.8 ± 11.235 ± 8.861.2%43.8%DSM-IV(SCID)POFAAnger, fear, happinessIdentification(accuracy, reaction time)6 (POOR)YesThaler et al., 2013 [132], USACross-sectionalOutpatientsBD (48)HCs (24)Euthymic (100%)35.85 ± 13.236.1 ± 13.438%54%DSM-IV (SCID)BLERTAnger, disgust, fear, happiness, sadness, surpriseIdentification (number of errors)6 (GOOD)YesUlusoy et al., 2020 [133], TurkeyCross-sectionalOutpatientsBD (38)HCs (30)FDRs (60)Euthymic (55%)Depressed (29%)Manic/mixed (16%)28.42 ± 5.6528.83 ± 5.753.91 ± 6.0855%53%50%DSM-IV (SCID)FEIT, FEDTAnger, fear, happiness, sadness, shame, surpriseIdentification (score);Discrimination (score)8 (GOOD)YesVan Rheenen et al., 2014 [134], AustraliaCross-sectionalOutpatientsBD (50)HCs (52)Euthymic(34%)Depressed (34%)Manic (8%)Mixed (24%)37.92 ± 12.4533.98 ± 14.2768%62%DSM-IV-TR(MINI)POFAAnger, fear, happiness, sadnessIdentification(accuracy, reaction time)7 (GOOD)YesVan Rheenen et al., 2017 [135], AustraliaCross-sectionalNABD (28)HCs (28)Euthymic(57%)Depressed(43%)41.96 ± 11.3542.43 ± 11.2969%53.4%DSM-IVPOFAAnger, fear, happiness, sadnessIdentification(accuracy, reaction time)4 (POOR)YesVaskinn et al., 2007 [136], NorwayCross-sectionalNABD (21)HCs (31)NA38.1 ± 9.330.7 ± 9.648%35%DSM-IV (SCID)POFA, FOEAnger, disgust, happiness, sadness, shame, surpriseIdentification (score);Discrimination (score)6 (GOOD)YesVederman et al., 2012 [137], USACross-sectionalInpatients and outpatientsBD (119)HCs (66)NA37 ± 11.837.2 ± 13.267%64.2%DSM-IV(SCID, DIGS)NAAnger, fear, happiness, sadnessIdentification(accuracy)7 (GOOD)YesVenn et al., 2004 [138], UKCross-sectionalOutpatientsBD (17)HCs (17)Euthymic (100%)44.35 ± 3.243.76 ± 3.3641%41%DSM-IV(SCID)POFAAnger, disgust, fear, happiness, sadness, surpriseIdentification(score)7 (GOOD)YesVersace et al., 2010 [139], USACross-sectionalNABD (31)HCs (24)Euthymic (54.8%)Depressed(45.2%)35.9 ± 8.829.5 ± 5.265%54%DSM-IV(SCID)POFAHappiness, sadnessIdentification (score)6 (POOR)YesVierck et al., 2015 [36], New ZealandCross-sectionalOutpatientsBD (36)FDRs (24)HCs (40)Euthymic(53%)Depressed(44%)Mixed (3%)40.8 ± 11.633.2 ± 13.536.2 ± 11.375%70.8%72.5%DSM-IV(SCID)POFAAnger, disgust, fear, happiness, sadnessIdentification(accuracy, reaction time)6 (GOOD)YesWegbreit et al., 2015 [140], USACross-sectionalOutpatientsBD (66)HCs (87)Euthymic(77.3%)16.7 ± 4.717.9 ± 4.736.4%39.1%DSM-IV(K-SADS-PL)DANVA–2Anger, fear, happiness, sadnessIdentification (number of errors)5 (FAIR)NoWiggins et al., 2017 [141], USACross-sectionalNABD (36)FDRs (22)HCs (41)Euthymic(81%)Depressed(5%)Hypomanic(14%)17.9 ± 3.315.7 ± 3.617.31 ± 4.242%41%49%DSM–5(K-SADS-PL, SCID)POFAAnger, fear, happinessIdentification(accuracy)7 (GOOD)YesWynn et al., 2013 [142], USACross-sectionalOutpatientsBD (57)HCs (30)NA44.9 ± 10.440.6 ± 10.143%36.7%DSM-IV(SCID)POFAAnger, fear, happiness, sadness, shame, surpriseIdentification(accuracy)7 (GOOD)YesYalcin-Siedentopf et al., 2014 [143], AustriaCross-sectionalOutpatientsBD (57)HCs (50)Euthymic(100%)41.9 ± 11.738.8 ± 6.965%42%DSM-IV(MINI)FEELAnger, disgust, fear, happiness, sadness, surpriseIdentification (score)6 (FAIR)YesZhang et al., 2018 [144], ChinaCross-sectionalNABD (61)HCs (54)NA20.03 ± 1.920.68 ± 2.8355.7%54%DSM–5NAAnger, happiness, sadnessIdentification(accuracy, reaction time)5 (FAIR)Yes Abbreviations: BD, bipolar disorder; BLERT, Bell-Lysaker emotion recognition test; CAFPS, Chinese affective facial picture system; CANTAB, Cambridge Neuropsychological Test Automated Battery; Cohn-Kanade, Cohn-Kanade action unit-coded facial expression database; DANVA, diagnostic analysis of non-verbal accuracy; DIGS, Diagnostic Interview for Genetic Studies; DIP, The Diagnostic Interview for Psychoses; DSM-III-R, Diagnostic and Statistical Manual of Mental Disorders – third ed. Revised; DSM-IV, Diagnostic and Statistical Manual of Mental Disorders – fourth ed.; DSM-IV-TR, Diagnostic and Statistical Manual of Mental Disorders – fourth ed. – Text Revision; DSM-5, Diagnostic and Statistical Manual of Mental Disorders – fifth ed.; EEMT, Emotional Expression Multimorph Task; ER-40, Penn Emotion Recognition-40; ER-96, Penn Emotion Recognition-96; EK, Ekman 60 Faces Test; FDRs, First-Degree Relatives; FEDT, Facial Emotion Discrimination Test; FEIT, Facial Emotion Identification Test; FEED, Facial Expression and Emotions Database; FEEL, Facially Expressed Emotion Labeling; FEEST, Facial Expressions of Emotion: Stimuli and Tests; FOE, The Face of Emotions; HCs, healthy controls; ICD-10, International Classification of Diseases; JACFEE, Japanese and Caucasian Facial Expressions of Emotion; KAMT, Kinney’s Affect Matching Test; KDEF, Karolinska Directed Emotional Faces; K-SADS-PL, Kiddie Schedule for Affective Disorders and Schizophrenia, present and lifetime version; MIMI, MIMI Facial Expression Database; MINI, The Mini-International Neuropsychiatric Interview; Mini-SEA, mini-Social Cognition and Emotional Assessment; NA, not available; NOS, Newcastle-Ottawa Scale; PEAT, Penn Emotion Acuity Test; POFA, Pictures of Facial Affect; SCAN, Schedules for Clinical Assessment in Neuropsychiatry; SCID, Structured Clinical Interview for DSM Disorders; SCID-P, Structured Clinical Interview for DSM Disorders-Patient version; TRENDS, Tool for Recognition of Emotions in Neuropsychiatric Disorders; VERT-K, Vienna Emotion Recognition Tasks; WASH-U-KSADS, Washington University Schedule for Affective Disorders and Schizophrenia.
Characteristics of included studies
The 100 studies included were published between 1996 and 2024 in 21 countries worldwide. Ninety-four studies (94%) were cross-sectional, and six (6%) were longitudinal. Regarding the age group, 84 (84%) were conducted in adults, 12 (12%) in children/adolescents, and four (4%) in mixed age groups.
Individuals with BD (n = 4920, range = 7–275; females = 56%, mean age = 34.1 ± 9.1) had an age at onset of 21.2 ± 7.6 years and a duration of illness of 13.6 ± 8.7 years. 74.5% were diagnosed with BD-I. Regarding their mood state, 62.9% were euthymic, 18.1% depressed, and 12.5% (hypo)manic. In 21 studies (21%), the information regarding the mood state was unclear. Control groups included both FDRs (n = 676, range = 20–286, females = 55%, mean age = 36.1 ± 12), and HCs (n = 4909, range = 10–380, females = 53.2%, mean age = 32.5 ± 9.5).
Ninety-four studies (94%) used a FER identification task, and 19 studies (19%) used a FER discrimination task (Supplementary Appendix IV).
Risk of bias evaluation
Sixty-five studies (65%) were considered “good quality” according to the AHRQ standards, 20 studies (20%) were considered “fair quality,” and 15 studies (15%) were considered “poor quality.” Additional details are available in Table 1 and in Supplementary Appendix V.
Main analyses
Table 2 displays the main results of all the meta-analyses conducted. Figure 2 is the jungle plot [23] for the differences in FER accuracy and reaction time among adult populations.Table 2.Results of the meta-analyses in detailControl groupEmotion typeOutcome typeStudies, n BD patients, n Controls, n SMD95% CIs p-value95% PIs I ^2^tau^2^ Q test p-value** Identification ** Adults Level IHCsAny emotionAccuracy6532213334**−0.466** −0.556, −0.377 <0.001 −1.015, 0.08263.440.08<0.1HCsAny emotionNumber of errors3110980.253−0.026, 0.5320.08−0.026, 0.532000.85HCsAny emotionReaction time25145317960.57 0.334, 0.806 <0.001 −0.521, 1.66189.270.3<0.1FDRsAny emotionAccuracy11811605−0.039−0.18, 0.1020.58−0.299, 0.2223.480.010.39FDRsAny emotionReaction time97465250.349−0.056, 0.7530.09−0.832, 1.52988.910.32<0.1Level IIHCsNegativeAccuracy4523642435**−0.321** −0.43, −0.212 <0.001 −0.894, 0.25166.290.08<0.1HCsNegativeNumber of errors3110980.177−0.102, 0.4560.21−0.102, 0.456000.94HCsNegativeReaction time19116014450.428 0.153, 0.704 0.002 −0.701, 1.55890.10.31<0.1HCsPositiveAccuracy3921552185**−0.275** −0.386, −0.164 <0.001 −0.804, 0.25463.220.07<0.1HCsPositiveReaction time1395012200.622 0.334, 0.91 <0.001 −0.345, 1.58888.170.22<0.1FDRsNegativeAccuracy10790584−0.026−0.138, 0.0850.64−0.138, 0.085000.65FDRsNegativeReaction time87255040.368−0.086, 0.8220.11−0.908, 1.64490.840.37<0.1FDRsPositiveAccuracy6638488−0.078−0.201, 0.0460.22−0.201, 0.046000.45FDRsPositiveReaction time45734080.268−0.02, 0.5570.07−0.266, 0.80367.360.05<0.1Level IIIHCsAngerAccuracy3219071903**−0.261** −0.344, −0.177 <0.001 −0.504, −0.018 26.340.010.15HCsAngerNumber of errors2100880.263−0.032, 0.5570.08−0.032, 0.557000.73HCsAngerReaction time11086210660.464 0.179, 0.749 0.001 −0.404, 1.33286.140.17<0.1HCsDisgustAccuracy2212691153**−0.327** −0.458, −0.196 <0.001 −0.764, 0.11151.950.05<0.1HCsDisgustNumber of errors258340.343−0.088, 0.7740.12−0.088, 0.774000.56HCsDisgustReaction time75085650.276−0.062, 0.6140.11−0.545, 1.09780.830.15<0.1HCsFearAccuracy3318921896**−0.365** −0.489, −0.24 <0.001 −0.92, 0.19165.710.08<0.1HCsFearNumber of errors3110980.068−0.211, 0.3470.63−0.211, 0.347000.56HCsFearReaction time1181810610.38 0.198, 0.562 <0.001 −0.079, 0.83961.30.05<0.1HCsHappinessAccuracy3520442042**−0.19** −0.27, −0.11 <0.001 −0.43, 0.04925.750.01<0.1HCsHappinessNumber of errors31521520.064−0.164, 0.2930.58−0.164, 0.293000.98HCsHappinessReaction time1292411940.553 0.265, 0.841 <0.001 −0.376, 1.48187.990.2<0.1HCsNeutralAccuracy169501001**−0.17** −0.289, −0.05 0.005 −0.424, 0.08525.40.010.25HCsNeutralNumber of errors258340.028−0.4, 0.4560.9−0.4, 0.456000.49HCsNeutralReaction time107588380.292 0.097, 0.487 0.003 −0.185, 0.76960.940.05<0.1HCsSadnessAccuracy3620362020**−0.224** −0.327, −0.122 <0.001 −0.658, 0.20953.640.05<0.1HCsSadnessNumber of errors2100880.174−0.12, 0.4680.25−0.12, 0.468000.69HCsSadnessReaction time1188610960.329 0.127, 0.531 0.001 −0.235, 0.89472.90.07<0.1HCsSurpriseAccuracy17912937**−0.307** −0.402, −0.213 <0.001 −0.402, −0.213 000.32HCsSurpriseReaction time44144760.457−0.033, 0.9460.07−0.544, 1.45788.450.2<0.1FDRsAngerAccuracy66384880.077−0.135, 0.290.48−0.334, 0.48951.320.03<0.1FDRsAngerReaction time45734080.123−0.09, 0.3360.26−0.224, 0.4743.570.020.19FDRsDisgustAccuracy3329120−0.182−0.751, 0.3860.53−1.221, 0.85779.250.2<0.1FDRsDisgustReaction time23021000.013−0.731, 0.7580.97−1.213, 1.2484.880.25<0.1FDRsFearAccuracy7679513−0.109−0.41, 0.1930.48−0.84, 0.62377.790.12<0.1FDRsFearReaction time56144330.126−0.196, 0.4480.44−0.552, 0.80476.180.09<0.1FDRsHappinessAccuracy6638488−0.136−0.331, 0.0590.17−0.492, 0.2242.980.020.14FDRsHappinessReaction time45734080.25−0.06, 0.5610.11−0.338, 0.83871.770.06<0.1FDRsNeutralAccuracy5600428−0.078−0.233, 0.0760.32−0.284, 0.12814.0700.53FDRsNeutralReaction time4573408−0.067−0.29, 0.1570.56−0.44, 0.30747.930.020.13FDRsSadnessAccuracy7678513−0.065−0.184, 0.0550.29−0.184, 0.055000.83FDRsSadnessReaction time56134330.142−0.249, 0.5330.48−0.719, 1.00384.030.15<0.1FDRsSurpriseAccuracy3331156−0.15−0.665, 0.3650.57−1.089, 0.78979.510.16<0.1Children/adolescents Level IHCsAny emotionAccuracy6162140**−0.588** −0.821, −0.355 <0.001 −0.821, −0.355 000.44HCsAny emotionNumber of errors41622310.659 0.447, 0.87 <0.001 0.447, 0.87000.89HCsAny emotionReaction time376620.352 0.01, 0.694 0.044 0.01, 0.694000.36Level IIHCsNegativeAccuracy4130108**−0.541** −0.802, −0.279 <0.001 −0.802, −0.279 000.73HCsNegativeNumber of errors31101530.493 0.235, 0.751 <0.001 0.235, 0.751 000.7HCsNegativeReaction time266522.468−1.965, 6.9010.28−5.169, 10.10598.410.07<0.1HCsPositiveAccuracy4130108**−0.581** −0.924, −0.238 <0.001 −1.137, −0.025 40.860.050.17HCsPositiveNumber of errors31101530.281−0.371, 0.9330.4−0.936, 1.49883.220.27<0.1HCsPositiveReaction time266520.418 0.048, 0.788 0.027 0.048, 0.788 000.73Level IIIHCsAngerAccuracy4130108**−0.429** −0.772, −0.086 0.014 −0.99, 0.13341.990.050.16HCsAngerNumber of errors31101530.447 0.189, 0.705 <0.001 0.189, 0.705 000.29HCsAngerReaction time266520.209−0.356, 0.7740.47−0.619, 1.03757.290.10.13HCsFearAccuracy26147−0.326−0.711, 0.060.1−0.711, 0.06000.8HCsFearNumber of errors31101530.364 0.107, 0.621 0.005 0.107, 0.621 000.7HCsHappinessAccuracy4130108**−0.581** −0.924, −0.238 <0.001 −1.137, −0.025 40.860.050.17HCsHappinessNumber of errors31101530.643 0.382, 0.904 <0.001 0.382, 0.904 000.94HCsHappinessReaction time266520.418 0.048, 0.788 0.027 0.048, 0.788 000.73HCsNeutralAccuracy26652−0.285−0.653, 0.0820.13−0.653, 0.082000.88HCsNeutralReaction time266520.463−0.084, 1.0090.1−0.324, 1.24953.510.080.14HCsSadnessAccuracy39177**−0.588** −0.901, −0.276 <0.001 −0.901, −0.276 000.75HCsSadnessNumber of errors31101530.703 0.442, 0.965 <0.001 0.442, 0.965 000.82HCsSadnessReaction time266524.905−3.556, 13.3670.26−9.694, 19.50598.8536.85<0.1Mixed age groups Level IHCsAny emotionAccuracy3160134−0.22−0.565, 0.1240.21−0.751, 0.3145.280.040.16Level IIHCsNegativeAccuracy3160134−0.127−0.443, 0.1890.43−0.587, 0.33236.280.030.19HCsPositiveAccuracy3160134**−0.365** −0.727, −0.002 0.049 −0.937, 0.20849.690.050.14Level IIIHCsAngerAccuracy2144102−0.058−0.315, 0.1990.66−0.315, 0.199000.53HCsFearAccuracy2144102−0.09−0.347, 0.1670.49−0.347, 0.167000.83HCsHappinessAccuracy3160134**−0.425** −0.664, −0.186 <0.001 −0.664, −0.186 000.5HCsNeutralAccuracy212493−0.261−0.833, 0.310.37−1.139, 0.61665.20.12<0.1HCsSadnessAccuracy212493−0.076−0.965, 0.8120.87−1.541, 1.38885.130.35<0.1** Discrimination ** Adults Level IHCsAny emotionAccuracy16549606**−0.59** −0.778, −0.402 <0.001 −1.175, −0.004 56.230.08<0.1HCsAny emotionReaction time72903130.185−0.037, 0.4080.1−0.253, 0.62441.60.040.12FDRsAny emotionAccuracy26881−0.04−0.742, 0.6610.91−1.153, 1.07375.520.19<0.1Level IIHCsNegativeAccuracy5185145**−0.571** −0.911, −0.231 <0.001 −1.216, 0.074 53.10.08<0.1HCsNegativeReaction time41701250.052−0.184, 0.2880.66−0.184, 0.288000.92Abbreviations: BD, bipolar disorder; CIs, confidence intervals; FDRs, first-degree relatives; HCs, healthy controls; PIs, prediction intervals; SMD, standardized mean difference. Statistically significant results (p < 0.05) are highlighted in bold.Figure 2.Jungle plot for differences in facial emotion recognition accuracy (left) and reaction time (right), adults only. BD, bipolar disorder; FDRs, first-degree relatives; HCs, healthy controls. Circles represent HCs, while triangles represent FDRs. Black-filled circles or triangles indicate statistically significant comparisons, while white-filled ones indicate non-significant comparisons. Point size is proportional to the number of patients included in that specific comparison.
Regarding the identification of any emotion, adults with BD were less accurate (k = 65; SMD = −0.47; 95% CIs = −0.56, −0.38; p-value <0.001; I ^2^= 63.4%) and showed higher reaction time (k = 25; SMD = 0.57; 95%CIs = 0.33, 0.81; p-value <0.001; I ^2^ = 89.3%) compared to HCs.
Regarding the identification of negative and positive emotions, adults with BD were less accurate (k = 45; SMD = −0.32; 95%CIs = −0.43, −0.21; p-value <0.001; I ^2^ = 66.3%), and showed higher reaction time (k = 19; SMD = 0.43; 95%CIs = 0.15, 0.7; p-value = 0.002; I ^2^ = 90.1%) compared to HCs, during the recognition of negative emotions. Similarly, they were less accurate (k = 39; SMD = −0.28; 95%CIs = −0.39, −0.16; p-value <0.001; I ^2^ = 63.2%), and showed higher reaction time (k = 13; SMD = 0.62; 95%CIs = 0.33, 0.91; p-value <0.001; I ^2^ = 88.2%), during the recognition of positive emotions too.
Regarding the identification of specific types of emotions, adults with BD were less accurate than HCs in recognizing anger (k = 32; SMD = −0.26; 95%CIs = −0.34, −0.18; p-value <0.001; I ^2^ = 26.3%), disgust (k = 22; SMD = −0.33; 95%CIs = −0.46, −0.20; p-value <0.001; I ^2^ = 52%), fear (k = 33; SMD = −0.37; 95%CIs = −0.49, −0.24; p-value <0.001; I ^2^ = 65.7%), happiness (k = 35; SMD = −0.19; 95%CIs = −0.27, −0.11; p-value <0.001; I ^2^ = 25.8%), neutral (k = 16; SMD = −0.17; 95%CIs = −0.29, −0.05; p-value = 0.005; I ^2^ = 25.4%), sadness (k = 36; SMD = −0.22; 95%CIs = −0.33, −0.12; p-value <0.001; I ^2^ = 53.6%), and surprise (k = 17; SMD = −0.31; 95%CIs = −0.4, −0.21; p-value <0.001; I ^2^ = 0%), and showed higher reaction time during the recognition of anger (k = 11; SMD = 0.46; 95%CIs = 0.18, 0.75; p-value = 0.001; I ^2^ = 86.1%), fear (k = 11; SMD = 0.38; 95%CIs = 0.2, 0.56; p-value <0.001; I ^2^ = 61.3%), happiness (k = 12; SMD = 0.55; 95%CIs = 0.27, 0.84; p-value <0.001; I ^2^ = 88%), neutral (k = 10; SMD = 0.29; 95%CIs = 0.1, 0.49; p-value = 0.03; I ^2^ = 61%), and sadness (k = 11; SMD = 0.33; 95%CIs = 0.13, 0.53; p-value = 0.001; I ^2^ = 72.9%).
Additional details are presented in Supplementary Appendix VI.
Meta-regression analyses
Characteristics of the original study, sociodemographic and clinical characteristics of people with BD, and FER task characteristics were chosen as predictors in the meta-regression analyses. Table 3 displays the significant predictors among all the meta-regressions conducted.Table 3.Results of the meta-regression analyses, only significant predictors reportedPredictorStudies NoBeta (95% CIs)AssociationFrom smaller to larger SMDFrom larger to smaller SMDSMDs opposite in directions** Identification ** Characteristics of the original study Publication year (from lower to higher)25−0.053 (−0.102, −0.003)BD versus HCs, any emotion, reaction time1.02 to 0.1819−0.059 (−0.111, −0.008)BD versus HCs, negative emotions, reaction time0.97 to 0.0211−0.046 (−0.068, −0.025)BD versus HCs, fear, reaction time0.79 to 0.111−0.064 (−0.088, −0.04)BD versus HCs, sadness, reaction time0.77 to −0.06Sociodemographic characteristics of people with BD Age (from younger to older)360.017 (0.002, 0.033)BD versus HCs, sadness, accuracy−0.53 to −0.01250.051 (0.016, 0.086)BD versus HCs, any emotion, reaction time−0.35 to 0.99130.048 (0.01, 0.085)BD versus HCs, positive emotions, reaction time−0.14 to 1.11120.043 (0.004, 0.081)BD versus HCs, happiness, reaction time−0.13 to 0.99Education (from less to more years)210.075 (0.006, 0.144)BD versus HCs, happiness, accuracy−0.41 to 0.15210.082 (0.008, 0.157)BD versus HCs, sadness, accuracy−0.5 to 0.11130.138 (0.016, 0.26)BD versus HCs, disgust, accuracy−0.57 to 0.19Percentage of females (from lower to higher)21−1.161 (−2.098, −0.223)BD versus HCs, disgust, accuracy−0.05 to −0.83Clinical characteristics of people with BD Age at onset (from younger to older)100.137 (0.096, 0.177)BD versus HCs, any emotion, reaction time−0.1 to 3Percentage of people with BD-I (from lower to higher)24−0.391 (−0.707, −0.075)BD versus HCs, happiness, accuracy0.06 to −0.33Symptoms severity scale, mania (from lower to higher score)42−0.024 (−0.046, −0.003)BD versus HCs, any emotion, accuracy−0.35 to −1.0214−0.148 (−0.278, −0.017)BD versus HCs, negative emotions, reaction time0.83 to −0.47FER task characteristics Duration of stimulus (from shorter to longer)43−0.00004 (−6e–05, −1e–05)BD versus HCs, any emotion, accuracy−0.32 to −0.9100.00014 (2e–05, 0.00025)BD versus HCs, positive emotions, reaction time0.37 to 1.42Practice (from absence to presence of practice before the task)650.254 (0.033, 0.476)BD versus HCs, any emotion, accuracy−0.51 to −0.2619−0.596 (−1.163, −0.028)BD versus HCs, negative emotions, reaction time0.58 to −0.01Number of stimuli (from lower to higher)12−0.003 (−0.006, −0.0001)BD versus HCs, positive emotions, reaction time0.94 to 0.16** Discrimination ** Sociodemographic characteristics of people with BD Education (from less to more years)110.181 (0.035, 0.328)BD versus HCs, any emotion, accuracy−1.09 to −0.26Clinical characteristics of people with BD Percentage of people with depression (from lower to higher)120.667 (0.206, 1.127)BD versus HCs, any emotion, accuracy−0.76 to −0.09Abbreviations: BD, bipolar disorder; CIs, confidence intervals; HCs, healthy controls; SMD, standardized mean difference.
Among the characteristics of the original study, higher publication years were associated to smaller differences between adults with BD and HCs regarding the reaction time during the identification of any emotion (k = 25; beta = −0.05; 95%CIs = −0.1, −0.003), the reaction time during the identification of negative emotions (k = 19; beta = −0.06; 95%CIs = −0.11, −0.01), and the reaction time during the identification of fear (k = 11; beta = −0.05; 95%CIs = −0.07, −0.03).
Among the sociodemographic characteristics of people with BD, older age was associated to smaller differences between adults with BD and HCs regarding the accurate identification of sadness (k = 36; beta = 0.02; 95%CIs = 0.002, 0.03), and higher percentage of females was associated to bigger differences between adults with BD and HCs regarding the accurate identification of disgust (k = 21; beta = −1.16; 95%CIs = −2.1, −0.22). More years of education were associated to smaller differences between adults with BD and HCs regarding the accurate discrimination of any emotion (k = 11; beta = 0.18; 95%CIs = 0.04, 0.33).
Among the clinical characteristics of people with BD, more severe manic symptoms were associated to bigger differences between adults with BD and HCs regarding the accurate identification of any emotion (k = 42; beta = −0.02; 95%CIs = −0.05, −0.003). Higher percentage of people experiencing a depressive episode were associated to smaller differences between adults with BD and HCs regarding the accurate discrimination of any emotion (k = 12; beta = 0.67; 95%CIs = 0.21, 1.13).
Among the FER task characteristics, longer duration of stimuli was associated to bigger differences between adults with BD and HCs regarding the accurate identification of any emotion (k = 43; beta = −4e−05; 95%CIs = −6e−05, −1e−05), and the reaction time during the identification of positive emotions (k = 10; beta = 1.4e−04; 95%CIs = 2e−05, 2.5e−04). On the other hand, presence of practice was associated to smaller differences between adults with BD and HCs regarding the accurate identification of any emotion (k = 65; beta = 0.25; 95%CIs = 0.03, 0.48), and the higher number of stimuli was associated to smaller differences between adults with BD and HCs regarding the reaction time during the identification of positive emotions (k = 12; beta = −0.003; 95%CIs = −0.006, −1e04).
Additional details are presented in Supplementary Appendix VI.
Sensitivity analyses
Sensitivity analyses were conducted: (a) by excluding one study at a time from the main analysis; (b) by including only good-quality studies according to AHRQ standards; (c) by removing those studies whose lower-level data were calculated from higher-level information.
Additional details are presented in Supplementary Appendix VI.
Publication bias
Publication bias was examined in 21 comparisons with at least 10 available studies. Among these comparisons, publication bias was identified in 10 of them.
Additional details are presented in Supplementary Appendix VI.
Discussion
This systematic review and meta-analysis aimed to investigate the differences in FER among BD, FDRs, and HCs. Overall, adults with BD were less accurate than HCs on all FER identification and discrimination tasks, and they required more time to respond on all FER identification tasks, except those related to disgust and surprise. Differences were more pronounced with greater stimulus durations and manic symptoms severity, and less pronounced when participants had practice before the task. These deficits seem to manifest early in life, as even children/adolescents presented reduced accuracy and increased reaction times compared to HCs. No significant differences were found comparing BD and FDRs.
Regarding comparisons with HCs, our results are consistent with findings observed in other domains of AC, such as emotion regulation [9], and affective decision-making and reward processing [8]. The observed deficits in FER may be explained by several reasons. From a brain functioning perspective, patients with BD undergoing emotion processing tasks like FER appear to exhibit consistent hyperactivation in amygdala activity compared to HCs [24]. The amygdala is a hub for different networks involved in core affect representation, playing a significant role in emotional stimulus generation and perception [25]. Its hyperactivation may indicate heightened sensitivity to emotional stimuli, potentially contributing to worsened mood symptoms or the genesis of mood episodes [24]. Consistently, alterations in other dimensions of AC associated with changes in amygdala activity, such as emotion dysregulation, were also found to be associated with more severe mood symptoms [26], with dimensions more strongly influenced by amygdala hyperactivity showing a stronger correlation to symptoms [27]. Extended neurocognitive impairments observed in BD may also contribute to difficulties in FER. As AC involves the integration of emotions and neurocognitive processes, challenges in FER may depend on the integrity of neurocognitive performance. A post-hoc analysis [28] showed that BD patients with a cognitive performance similar to HCs had also similar FER skills, while impaired neurocognitive functions were associated to deficits in FER. This observation was confirmed by another study [29] and maintained when the problem was analyzed the other way around. Indeed, emotionally preserved BD patients generally exhibited better cognitive abilities, especially in attention, psychomotor speed, working memory, and executive functions [30].
For many years, cognitive symptoms in BD have been overshadowed by an almost exclusive focus on depressive and manic symptomatology, leaving them underappreciated despite their significant impact on patients’ lives. Nowadays, cognitive impairments are increasingly recognized as a core feature of BD, persisting throughout the illness, even in the absence of acute mood episodes [31]. This growing awareness has led to the development of interventions targeting cognitive functions, yet most treatments focus on neurocognitive domains without specifically addressing AC [32–35]. Indeed, evidence on interventions aimed at improving FER in BD remains limited. While selective serotonin reuptake inhibitors have shown efficacy in enhancing FER in some individuals [36], results are inconsistent [37]. Similarly, antipsychotics, which are effective in reducing manic symptoms, may indirectly affect FER by impairing eye-gaze movements [38], which complicate task performance. Our findings, confirming FER impairments in BD, underscore the importance of future research focused on developing treatments specifically targeting domains of AC.
We observed high heterogeneity in nearly half of our results, which can be partly attributed to the neurocognitive variability inherent to BD, as described above. In addition, FER was not uniformly assessed across each study. Different paradigms were used, including the use of facial expressions from multiple atlases, consideration of a varying range of emotions or stimulus durations, or allowing for a trial before task execution. Only 20% of the included studies used facial expressions morphed from neutral or mild intensity to full intensity expressions. This is critical because the International Society of Bipolar Disorder Targeting Cognition Task Force has recommended the use of FER tasks using morphed faces as the gold standard for studying this domain in BD [6]. While we believe that such aspects should be controlled upstream, encouraging future studies to use standardized tasks aligned with existing guidelines, we attempted to control this heterogeneity with numerous meta-regressions to identify some important variables in predicting our outcomes.
Among FER task characteristics, we observed that an increased stimulus duration was associated with an increase in the magnitude of differences in correctly identifying facial expressions (SMD from −0.32 to −0.9) or in the speed with which participants provided a response in identifying positive emotions (SMD from 0.37 to 1.42). A brief stimulus duration could pose challenges for both BD patients and HCs in correctly performing a FER task. However, the difficulties experienced by BD patients may be more evident with longer stimulus durations, where issues related to attention or information integration become more apparent. Conversely, studies that did not include a trial before the actual task showed greater differences in identifying facial expressions compared to those that allowed for a preliminary practice (SMD from −0.51 to −0.26). This suggests that the difficulties experienced by BD patients may be partially alleviated through training. Regarding the clinical characteristics of individuals with BD, the severity of manic symptoms was associated with greater difficulty in identifying facial expressions (SMD from −0.35 to −1.02). Patients with more severe manic symptoms exhibit greater distractibility and impulsivity [39], which may explain this finding.
Considering comparisons with FDRs, we did not find significant differences. Although not manifesting the pathology, FDRs share genetic heritage with their family members and thus genetic risk factors. Therefore, our results support the hypothesis that difficulties in AC may constitute an endophenotype of BD [6], as observed in previous reports about AC domains such as emotion regulation [9]. However, studies comparing these two populations are very scarce. Additionally, FDRs of individuals diagnosed with other psychiatric conditions, such as schizophrenia, have also shown FER deficits when compared to HCs [40], raising the question of whether these deficits could be transdiagnostic endophenotypes rather than illness-specific ones [41]. Hence, further research is necessary to draw more robust conclusions.
To the best of our knowledge, this is the first and most comprehensive systematic review and meta-analysis focusing on FER in individuals diagnosed with BD compared to FDRs and HCs. By synthesizing data from numerous studies conducted across different countries and age groups while controlling for several predictors, our analysis provides comprehensive insights into the challenges faced by individuals with BD in perceiving and interpreting facial expressions. From a clinical standpoint, these findings support a shift toward personalized, multidomain treatment strategies in BD. FER performance should be systematically assessed as part of comprehensive cognitive profiling at baseline and follow-up to identify individuals who may benefit from integrated interventions. The presence of FER deficits in both patients and unaffected FDRs suggests they may represent a cognitive endophenotype of BD, offering a potential biomarker for early identification and risk stratification in clinical settings. The observed association between manic symptom severity and FER impairments further suggests that difficulties in emotion recognition intensify during periods of mood instability, underscoring the importance of monitoring social cognitive functioning when designing individualized treatment plans. By integrating FER assessment into routine cognitive profiling, clinicians can implement more precise treatment sequencing, where mood stabilization serves also as a foundation for subsequent cognitive interventions aimed at improving interpersonal functioning and quality of life. Similarly, our findings offer valuable directions for future research, suggesting specific areas requiring exploration in individual studies. For example, our observation of practice’s positive impact supports the development of targeted interventions aimed at improving cognitive functions. This highlights the potential for tailored interventions considering also the specific deficits identified in our meta-analysis. While various interventions targeting specific domains of AC have been proposed in different populations [42–44], we believe in a therapeutic approach aimed at enhancing AC as a cohesive whole rather than focusing solely on discrete aspects such as emotion regulation, impulsivity, or reward processing. Additionally, given that these aspects are common even in young people and individuals at risk, we believe that AC should also be integrated into early intervention programs to address vital aspects necessary for individuals’ growth within their social environment.
The present work has some limitations. First, affective state of participants with BD was not always reported, limiting our speculation on the role of affective symptomatology in FER. However, we addressed this aspect through meta-regressions related to both the severity of affective symptomatology and the percentage of individuals in a specific mood state, finding a relationship between the severity of manic symptomatology and the accurate identification of facial emotions. Second, we could not control for the type of pharmacological therapy taken due to the heterogeneity of treatments and the limited availability of information. Medication could serve as an important confounder that limits the generalizability of our results [45], although the majority of our sample was euthymic and likely on stable therapy. Third, individuals with BD often have comorbidities with other psychiatric disorders [46], which may influence differences in FER. However, most studies employed (semi)structured diagnostic interviews, enhancing the reliability of reported information. Fourth, although we did not find significant differences between individuals with BD and FDRs, it would be important to compare FDRs with HCs to further test the endophenotype hypothesis. While this comparison was not among the objectives of our study, future research should consider it to provide a better understanding. Fifth, we observed publication bias in some comparisons. Nonetheless, this review searched four databases and used a search strategy without time, language, or age restrictions, maximizing the likelihood of capturing all relevant published studies.
Our analysis provide evidence that people with BD exhibit extensive impairments in FER when compared to HCs, across all emotional categories. These differences are not observed when comparing individuals with BD to their FDRs, suggesting that FER impairments could be considered as an endophenotype of BD. Our findings can guide the development of new treatments for individuals with BD that target AC to enhance cognitive functions, promote social functioning, and improve the overall quality of life.
Supporting information
10.1192/j.eurpsy.2025.10147.sm001De Prisco et al. supplementary materialDe Prisco et al. supplementary material
The reference list from the paper itself. Each links out to its DOI / PubMed record.
- 1Oliva V, Fico G, De Prisco M, Gonda X, Rosa AR, Vieta E. Bipolar disorders: An update on critical aspects. Lancet Reg Health Eur. 2024;48:101135.39811787 10.1016/j.lanepe.2024.101135 PMC 11732062 · doi ↗ · pubmed ↗
- 2Elliott R, Zahn R, Deakin J, Anderson IM. Affective cognition and its disruption in mood disorders. Neuropsychopharmacology. 2011;36(1):153–82.20571485 10.1038/npp.2010.77PMC 3055516 · doi ↗ · pubmed ↗
- 3Jensen JH, Knorr U, Vinberg M, Kessing LV, Miskowiak KW. Discrete neurocognitive subgroups in fully or partially remitted bipolar disorder: associations with functional abilities. J Affect Disord. 2016;205:378–86.27573491 10.1016/j.jad.2016.08.018 · doi ↗ · pubmed ↗
- 4Keramatian K, Torres IJ, Yatham LN. Neurocognitive functioning in bipolar disorder: what we know and what we don’t. Dialogues Clin Neurosci. 2021;23(1):29–38.35860174 10.1080/19585969.2022.2042164 PMC 9286730 · doi ↗ · pubmed ↗
- 5Sagliano L, Ponari M, Conson M, Trojano L. The interpersonal effects of emotions: the influence of facial expressions on social interactions. Front Psychol. 2022;13.10.3389/fpsyg.2022.1074216 PMC 968084436425824 · doi ↗ · pubmed ↗
- 6Miskowiak KW, Seeberg I, Kjaerstad HL, Burdick KE, Martinez-Aran A, del Mar Bonnin C, et al. Affective cognition in bipolar disorder: a systematic review by the ISBD targeting cognition task force. Bipolar Disord. 2019;21(8):686–719.31491048 10.1111/bdi.12834 · doi ↗ · pubmed ↗
- 7Varo C, Jiménez E, Solé B, Bonnín C, Torrent C, Lahera G, et al. Social cognition in bipolar disorder: the role of sociodemographic, clinical, and neurocognitive variables in emotional intelligence. Acta Psychiatr Scand. 2019;139(4):369–80.30786002 10.1111/acps.13014 · doi ↗ · pubmed ↗
- 8Ramírez-Martín A, Ramos-Martín J, Mayoral-Cleries F, Moreno-Küstner B, Guzman-Parra J. Impulsivity, decision-making and risk-taking behaviour in bipolar disorder: a systematic review and meta-analysis. Psychol Med. 2020;50(13):2141–53.32878660 10.1017/S 0033291720003086 · doi ↗ · pubmed ↗