Adjusted effect size, area under the curve, and c-statistic for evaluating the association between uric acid and mortality in US adults using unweighted and survey-weighted regression, propensity, and prognostic score
Shakeel Ahmed, Alok Kumar Dwivedi

TL;DR
This study shows that higher uric acid levels are linked to increased mortality risk in US adults, emphasizing the need for proper statistical weighting in complex survey data.
Contribution
The study introduces and compares survey-weighted and unweighted methods for analyzing the association between uric acid and mortality in complex survey data.
Findings
Uric acid levels are consistently associated with increased mortality risk across various weighted and unweighted analyses.
Survey-weighted analyses showed improved predictive performance in specific prevalence and exposure conditions.
Higher uric acid levels are strongly linked to all-cause mortality, especially in individuals over 60 years old.
Abstract
Population-based surveys and databases are useful sources for developing prognostic and diagnostic models requiring receiver operating characteristic (ROC) or precision-recall curve (PRC) analyses. The performance of the models is typically summarized with the area under the ROC (rAUC) or PR curves (pAUC) or c-statistic, depending on the study design and analysis. However, these surveys and databases sometimes involve sampling weights due to complex sampling designs. The sampling weights need to be included in the analysis to produce accurate estimates of effect size as well as performance measures. Different types of adjusted analyses, including survey-weighted adjusted analysis, propensity score weight-adjusted (PropSWA), and prognostic score weight-adjusted (ProgSWA) analyses, are typically performed using logistic or Cox regressions as per the study objectives and outcome. We…
Genes, proteins, chemicals, diseases, species, mutations and cell lines named across the full text — each resolved to its canonical identifier and authoritative record.
Click any figure to enlarge with its caption.
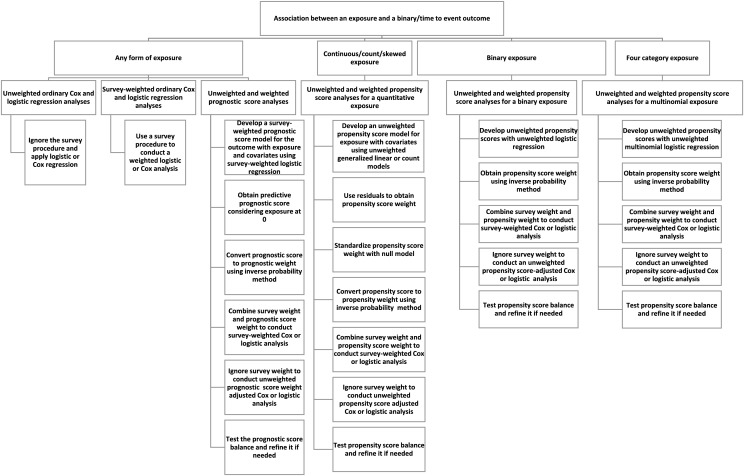 Figure 1
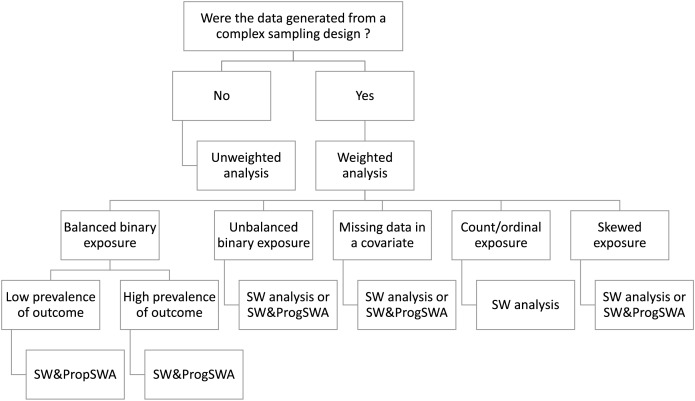 Figure 2
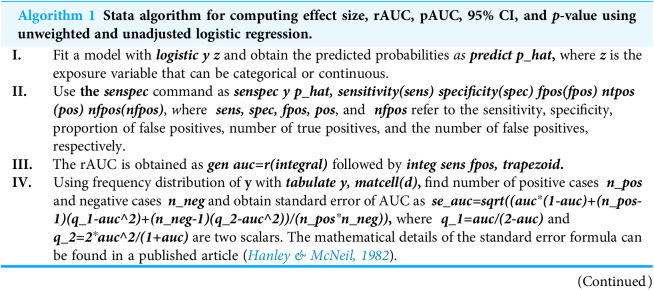 Figure 3
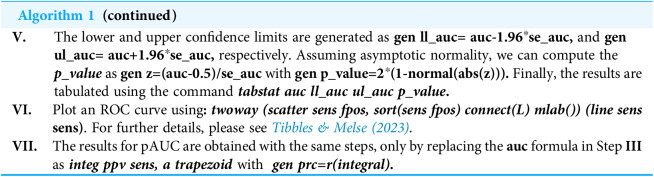 Figure 4
 Figure 5
 Figure 6
 Figure 7
 Figure 8
 Figure 9
 Figure 10
 Figure 11
 Figure 12
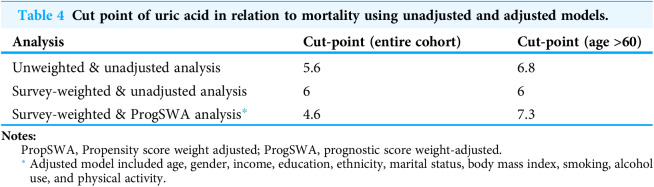 Figure 13
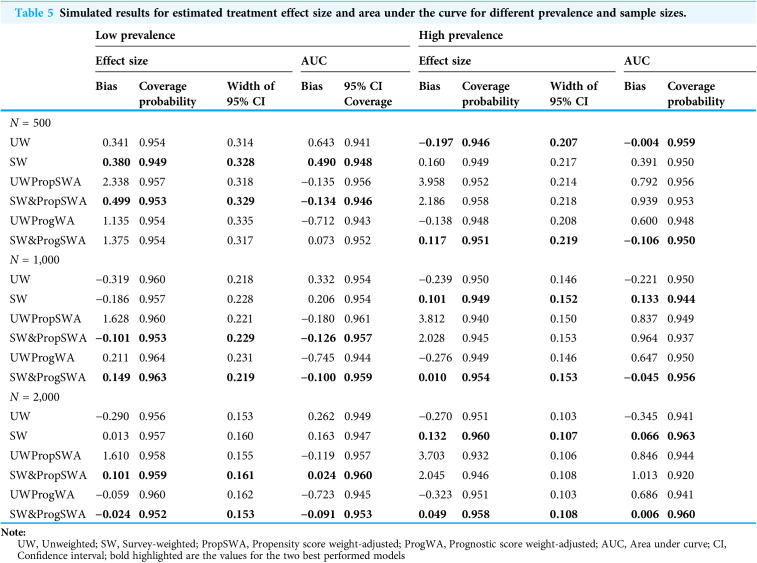 Figure 14
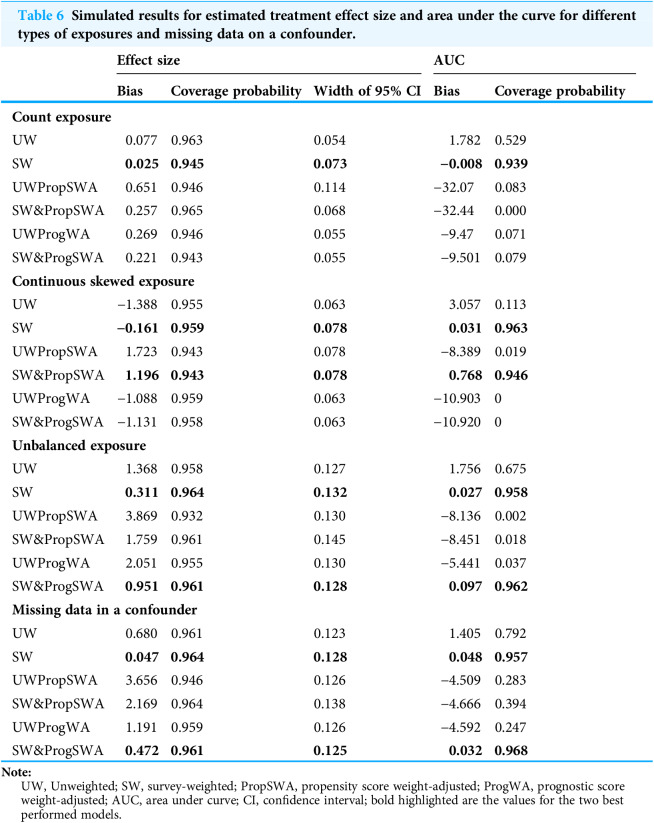 Figure 15
Peer Reviews
No public reviews on file for this paper yet. If you reviewed it on a platform where reviews are public (OpenReview, ICLR, NeurIPS, ICML), you can paste yours below so the community can read it here.
Videos
No videos yet. Explain this paper in a talk, walkthrough, or lecture? Add one.
Taxonomy
TopicsGout, Hyperuricemia, Uric Acid · Statistical Methods in Epidemiology · Sodium Intake and Health