The whole genome analysis of four Orf virus strains from Europe and South America
Marco Cacciabue, Laura C Lozano Calderón, Javier Moleres, Irache Echeverría, Lorena de Pablo, Idoia Glaria, Guido König, Andrea Peralta, Ramsés Reina

TL;DR
This study sequenced and analyzed the genomes of four Orf virus strains from Spain and Argentina, providing insights into their genetic structure and evolutionary history.
Contribution
The first complete genome sequences of Orf virus strains from the Iberian Peninsula and South America are reported, along with their evolutionary divergence estimates.
Findings
The four ORFV strains had genomes of 137,160 to 137,891 bp, each containing 132 genes with high amino-acid identity to the reference strain NZ2.
The median nucleotide substitution rate for cluster 3 was 2.6 x10⁻⁵ subs/site/year, with a TMRCA around 1730.
Microsatellite analysis identified molecular signatures potentially linked to host species (sheep or goat).
Abstract
Orf virus (ORFV) is the etiological agent of Contagious Ecthyma, a global disease that mainly affects sheep, goats, wild ruminants, and humans. Here, we determined the complete genome sequence of two ORFV strains from Spain (NAV and ARA) and two from Argentina (HRE and CHB), representing the first report from the Iberian Peninsula and from South America. The assembled genomes of the ARA, CHB, HRE, and NAV strains of ORFV were found to be 137 891 , 137 160, 137 340, and 137 214 bp long, respectively, each contained 132 genes, and all showed high amino-acid identity and similar lengths compared to the reference strain NZ2. We performed a microsatellite analysis to identify molecular signatures associated with host species (sheep or goat). In addition, the analysis of 32 selected genes showed that the median nucleotide substitution rate for the worldwide cluster 3 that includes the four…
Genes, proteins, chemicals, diseases, species, mutations and cell lines named across the full text — each resolved to its canonical identifier and authoritative record.
Click any figure to enlarge with its caption.
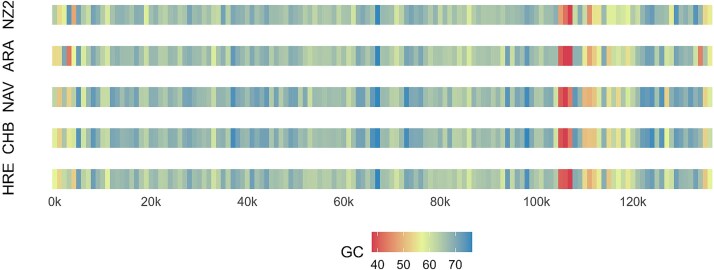 Figure 1
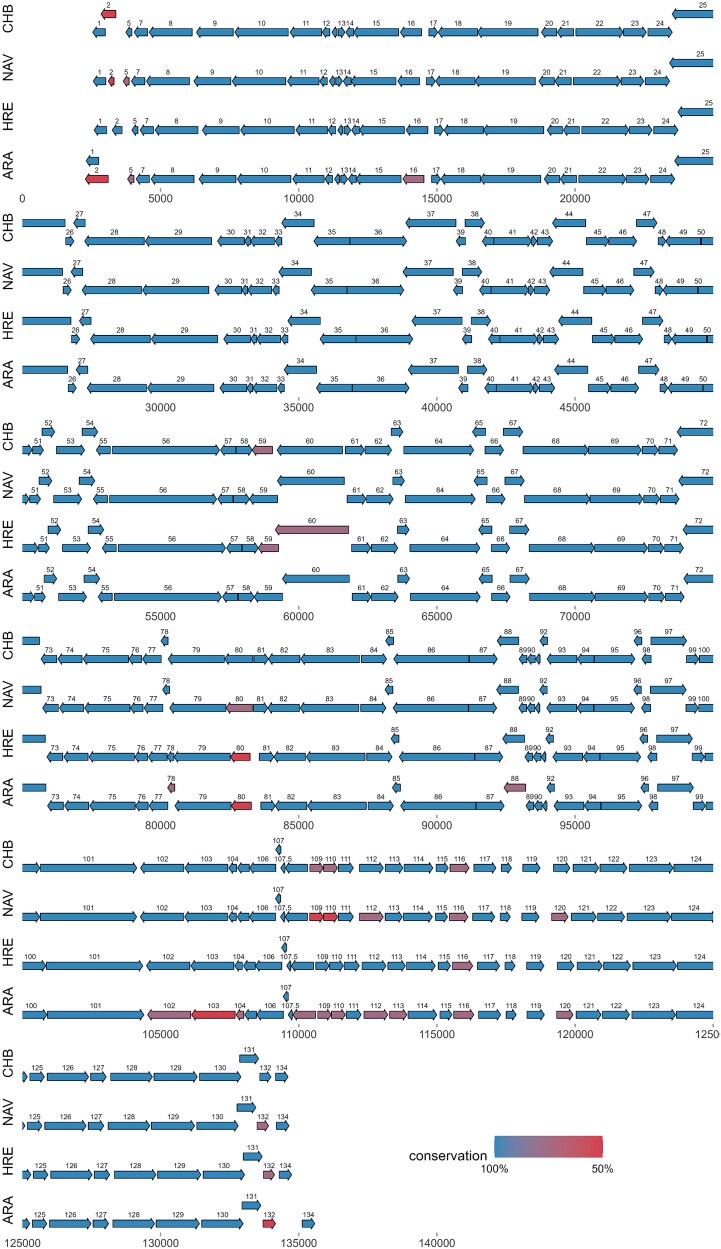 Figure 2
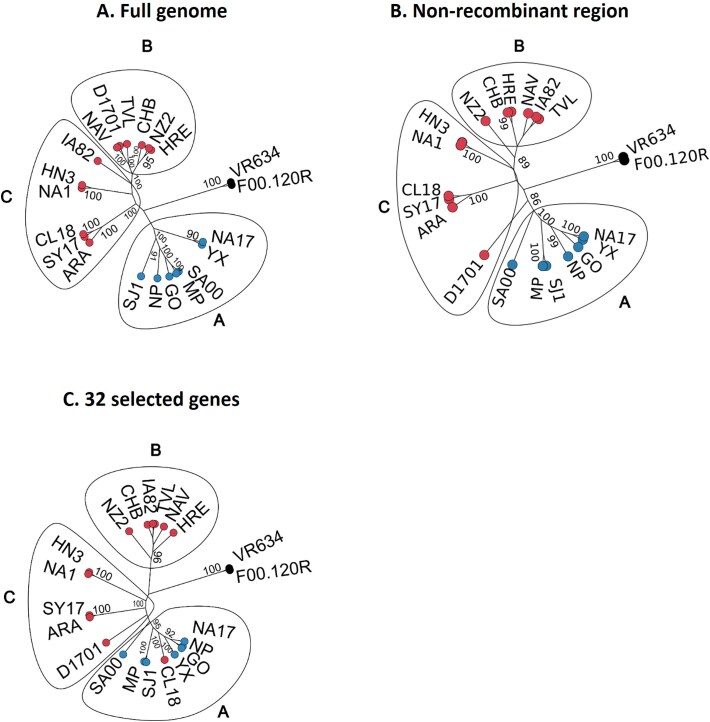 Figure 3
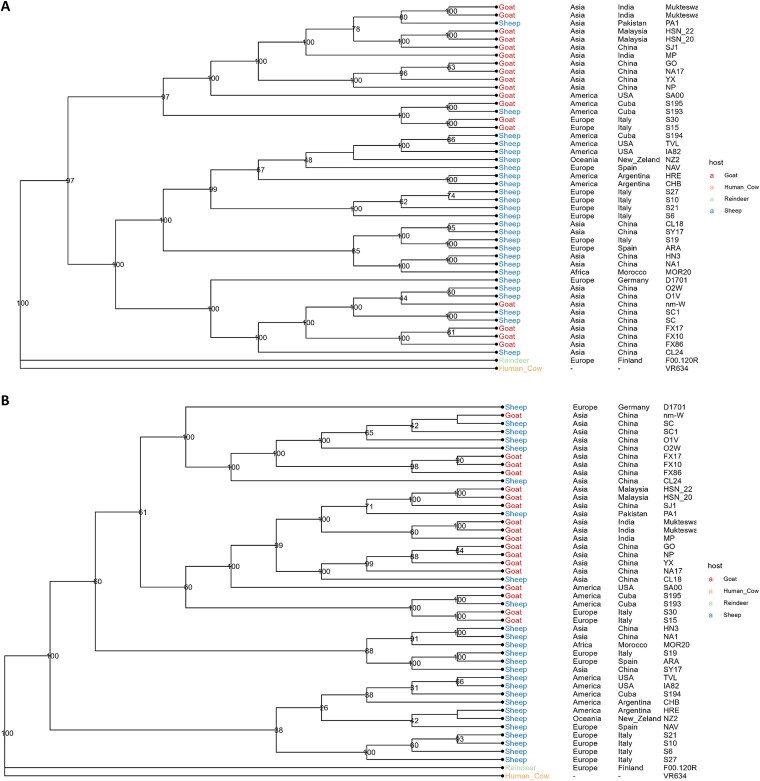 Figure 4
| Strain | Country of isolation | Year of isolation | Host | Accesion number | Reference |
|---|---|---|---|---|---|
| NZ2 | New Zeland | 1982 | Sheep |
| |
| ARA | Spain | 2014 | Sheep | This study | |
| CHB | Argentina | 2016 | Sheep | This study | |
| HRE | Argentina | 2015 | Sheep | This study | |
| NAV | Spain | 2017 | Sheep | This study | |
| NA1 | China | 2011 | Sheep | Li | |
| NA17 | China | 2016 | Goat |
| |
| SY17 | China | 2016 | Sheep |
| |
| HN3 | China | 2012 | Sheep |
| |
| D1701 | Germany | 2011 | Sheep | McGuire | |
| SA00 | USA | 2000 | Goat | Hosamani | |
| IA82 | USA | 1982 | Sheep | Hosamani | |
| SJ1 | China | 2012 | Goat | Chi | |
| NP | China | 2011 | Goat | Chi | |
| GO | China | 2012 | Goat | Chi | |
| MP | India | 2017 | Goat |
| |
| TVL | USA | 2019 | Sheep | Heare | |
| YX | China | 2012 | Goat | Chi | |
| VR634 | - | 1963 | Human (Cow) |
| |
| CL18 | China | 2018 | Sheep |
| |
| F00.120R | Finland | 2000 | Reindeer |
| |
| S6 | Italy | 2020 | Sheep |
| |
| S10 | Italy | 2020 | Sheep |
| |
| S15 | Italy | 2020 | Goat |
| |
| S19 | Italy | 2021 | Sheep |
| |
| S21 | Italy | 2017 | Sheep |
| |
| S27 | Italy | 2019 | Sheep |
| |
| S30 | Italy | 2019 | Goat |
| |
| HSN_20 | Malaysia | 2018 | Goat |
| |
| HSN_22 | Malaysia | 2019 | Goat |
| |
| SC | China | 2019 | Sheep |
| |
| SC1 | China | 2021 | Sheep |
| |
| O1V | China | 2024 | Sheep | Zhang | |
| O2W | China | 2024 | Sheep | Zhang | |
| CL24 | China | 2024 | Sheep |
| |
| PA1 | Pakistan | 2023 | Sheep | not published | |
| MOR20 | Morocco | 2020 | Sheep | Elkarhat | |
| FX10 | China | 2012 | Goat |
| |
| FX17 | China | 2012 | Goat |
| |
| FX86 | China | 2012 | Goat |
| |
| S193 | Cuba | 2008 | Sheep |
| |
| S194 | Cuba | 2008 | Sheep |
| |
| S195 | Cuba | 2007 | Goat |
| |
| Mukteswar_p9 | India | 2005 | Goat | Kumar | |
| Mukteswar_p50 | India | 2005 | Goat | Kumar | |
| nm-W | China | 2020 | Goat | not published | |
| B029 | Germany | 1996 | Human (Sheep) |
| |
| Mx08 | Canada | 2015 | Muskoxen | SRR9974556 |
|
| Mx347 | Canada | 2015 | Muskoxen | SRR9974557 |
|
| Mx444 | Canada | 2017 | Muskoxen | SRR9974558 |
|
| ORF | CHB | HRE | NAV | ARA | Predicted function | ||||
|---|---|---|---|---|---|---|---|---|---|
| Length (aa) | % Id | Length (aa) | % Id | Length (aa) | % Id | Length (aa) | % Id | ||
| 001 | 149 | 98.7 | 149 | 99.3 | 149 | 99.3 | 149 | 96.6 | Hypothetical protein |
| 002 | 178 | 51.9 | 117 | 99.1 | 67 | 56.4 | 274 | 30.3 | Hypothetical protein |
| 005 | 72 | 95.8 | 71 | 100.0 | 70 | 91.5 | 75 | 88.2 | Hypothetical protein |
| 007 | 160 | 96.2 | 159 | 99.4 | 160 | 95.6 | 159 | 96.9 | Dutpase |
| 008 | 516 | 99.2 | 516 | 99.6 | 516 | 98.6 | 516 | 97.5 | Ankyrin/F-box protein |
| 009 | 442 | 99.8 | 442 | 99.3 | 442 | 99.5 | 442 | 99.3 | Hypothetical protein |
| 010 | 643 | 99.1 | 643 | 99.4 | 643 | 99.4 | 643 | 98.6 | EEV-maturation protein |
| 011 | 378 | 99.5 | 378 | 100.0 | 378 | 100.0 | 378 | 100.0 | EEV phospholipase |
| 012 | 89 | 96.6 | 89 | 97.8 | 89 | 96.6 | 89 | 97.8 | Hypothetical protein |
| 012.5 | 60 | 100.0 | 60 | 100.0 | 60 | 100.0 | 60 | 98.3 | Hypothetical protein |
| 013 | 79 | 100.0 | 79 | 97.5 | 79 | 100.0 | 79 | 98.7 | Hypothetical protein |
| 014 | 93 | 100.0 | 93 | 100.0 | 93 | 98.9 | 93 | 97.8 | RING-H2 motif protein |
| 015 | 539 | 99.6 | 539 | 99.3 | 539 | 99.3 | 539 | 98.5 | Hypothetical protein |
| 016 | 252 | 95.4 | 259 | 98.1 | 259 | 98.1 | 252 | 92.7 | Hypothetical protein |
| 017 | 105 | 100.0 | 105 | 100.0 | 105 | 100.0 | 105 | 97.1 | DNA binding phosophoprotein |
| 018 | 472 | 99.4 | 472 | 99.8 | 472 | 99.6 | 472 | 99.4 | Poly-A polymerase catalytic subunit |
| 019 | 725 | 99.2 | 725 | 99.3 | 724 | 99.3 | 725 | 99.2 | Hypothetical protein |
| 020 | 183 | 98.4 | 183 | 98.4 | 183 | 97.8 | 183 | 98.4 | Dsrna-binding, interferon resistance |
| 021 | 193 | 99.5 | 193 | 99.5 | 193 | 99.5 | 193 | 99.5 | RNA polymerase subunit RPO30 |
| 022 | 567 | 100.0 | 567 | 99.6 | 567 | 99.8 | 567 | 99.5 | Hypothetical protein |
| 023 | 272 | 100.0 | 272 | 100.0 | 272 | 100.0 | 272 | 100.0 | Membrane protein |
| 024 | 292 | 96.9 | 292 | 95.9 | 291 | 96.6 | 288 | 96.5 | Hypothetical protein |
| 025 | 1 008 | 99.9 | 1 008 | 99.7 | 1 008 | 99.9 | 1 008 | 99.8 | DNA polymerase |
| 026 | 96 | 100.0 | 96 | 100.0 | 96 | 100.0 | 96 | 100.0 | ERV/ALR-like protein |
| 027 | 137 | 99.3 | 137 | 100.0 | 137 | 100.0 | 137 | 98.5 | Virion core protein |
| 028 | 715 | 98.7 | 719 | 98.5 | 713 | 99.7 | 713 | 98.3 | Hypothetical protein |
| 029 | 797 | 99.9 | 797 | 100.0 | 797 | 99.9 | 797 | 99.1 | Hypothetical protein |
| 030 | 321 | 100.0 | 321 | 100.0 | 321 | 100.0 | 321 | 99.7 | Virion core protein |
| 031 | 70 | 100.0 | 70 | 100.0 | 70 | 100.0 | 70 | 100.0 | Hypothetical protein |
| 032 | 285 | 98.6 | 285 | 98.9 | 285 | 98.2 | 286 | 96.2 | DNA binding phosphoprotein |
| 033 | 78 | 100.0 | 78 | 100.0 | 78 | 98.7 | 78 | 100.0 | IMV protein |
| 034 | 389 | 100.0 | 389 | 100.0 | 389 | 99.7 | 389 | 100.0 | Telomere binding protein |
| 035 | 430 | 100.0 | 430 | 100.0 | 430 | 100.0 | 430 | 99.8 | Virion core protease |
| 036 | 683 | 99.7 | 683 | 99.9 | 683 | 99.9 | 683 | 99.6 | RNA helicase |
| 037 | 603 | 99.8 | 603 | 99.8 | 603 | 99.7 | 603 | 99.2 | Zn-protease, virion morphogenesis |
| 039 | 110 | 99.1 | 110 | 98.2 | 110 | 100.0 | 110 | 97.3 | Hypothetical protein |
| 038 | 231 | 99.6 | 231 | 98.7 | 231 | 99.6 | 231 | 98.7 | Late transcription factor elongation factor |
| 040 | 137 | 100.0 | 137 | 99.3 | 137 | 98.5 | 137 | 98.5 | Glutaredoxin-like protein |
| 041 | 452 | 100.0 | 451 | 99.8 | 452 | 100.0 | 448 | 98.0 | Hypothetical protein |
| 042 | 63 | 100.0 | 63 | 100.0 | 63 | 100.0 | 63 | 100.0 | RNA polymerase subunit RPO7 |
| 043 | 185 | 100.0 | 185 | 100.0 | 185 | 100.0 | 185 | 99.5 | Hypothetical protein |
| 044 | 398 | 99.7 | 398 | 99.7 | 398 | 99.5 | 397 | 99.7 | Virion core protein |
| 045 | 266 | 100.0 | 266 | 100.0 | 266 | 100.0 | 266 | 100.0 | Late transcription factor |
| 046 | 334 | 99.7 | 334 | 99.1 | 334 | 99.1 | 334 | 97.3 | Myristylprotein |
| 047 | 244 | 100.0 | 244 | 100.0 | 244 | 100.0 | 244 | 99.6 | IMV protein |
| 048 | 90 | 100.0 | 90 | 100.0 | 90 | 100.0 | 90 | 100.0 | Hypothetical protein |
| 049 | 418 | 98.6 | 418 | 98.8 | 417 | 98.6 | 417 | 98.3 | Hypothetical protein |
| 050 | 259 | 99.6 | 259 | 98.8 | 259 | 99.2 | 259 | 99.2 | Virion core protein |
| 051 | 128 | 98.4 | 128 | 99.2 | 128 | 99.2 | 128 | 98.4 | Membrane protein |
| 052 | 151 | 99.3 | 151 | 99.3 | 151 | 100.0 | 151 | 100.0 | Virion protein |
| 053 | 336 | 100.0 | 336 | 99.7 | 336 | 100.0 | 336 | 100.0 | Poly(A) polymerase subunit |
| 054 | 186 | 100.0 | 186 | 100.0 | 186 | 100.0 | 186 | 98.9 | RNA polymerase subunit RPO22 |
| 055 | 167 | 99.4 | 167 | 99.4 | 167 | 99.4 | 167 | 98.8 | Late membrane protein |
| 056 | 1 289 | 100.0 | 1 289 | 100.0 | 1 289 | 100.0 | 1 289 | 99.9 | RNA polymerase subunit RPO147 |
| 057 | 181 | 100.0 | 181 | 99.4 | 181 | 99.4 | 181 | 99.4 | Tyrosine phosphatase, virus assembly |
| 058 | 191 | 100.0 | 191 | 100.0 | 191 | 100.0 | 191 | 100.0 | IMV, viral entry |
| 059 | 241 | 71.6 | 241 | 71.6 | 336 | 99.4 | 340 | 97.4 | Immunodominant envelope protein |
| 060 | 786 | 96.3 | 883 | 87.9 | 804 | 100.0 | 804 | 99.6 | RNA-polymerase associated RAP94 |
| 061 | 229 | 98.3 | 229 | 98.3 | 226 | 97.8 | 226 | 97.4 | late transcription factor VLTF4 |
| 062 | 318 | 100.0 | 318 | 100.0 | 318 | 100.0 | 318 | 100.0 | Topoisomerase I |
| 063 | 138 | 100.0 | 138 | 99.3 | 138 | 100.0 | 138 | 99.3 | Hypothetical protein |
| 064 | 841 | 99.9 | 841 | 99.9 | 841 | 99.8 | 841 | 99.8 | mRNA capping enzyme subunit |
| 065 | 156 | 100.0 | 156 | 100.0 | 156 | 100.0 | 156 | 100.0 | Virion protein |
| 066 | 221 | 99.5 | 221 | 99.5 | 221 | 98.6 | 221 | 99.5 | Virion protein |
| 067 | 231 | 99.6 | 231 | 99.6 | 231 | 100.0 | 231 | 99.1 | Uracil-DNA glycosylase |
| 068 | 787 | 100.0 | 787 | 100.0 | 787 | 100.0 | 787 | 100.0 | NTPase |
| 069 | 635 | 99.8 | 635 | 99.8 | 635 | 99.8 | 635 | 99.8 | Early transcription factor |
| 070 | 190 | 99.5 | 186 | 97.4 | 190 | 99.5 | 190 | 99.5 | RNA polymerase subunit RPO18 |
| 071 | 224 | 100.0 | 224 | 100.0 | 224 | 100.0 | 224 | 99.6 | NTP pyrophosphohydrolase |
| 072 | 638 | 99.8 | 638 | 99.8 | 638 | 99.7 | 638 | 99.8 | NPH-1 |
| 073 | 188 | 98.9 | 188 | 98.9 | 188 | 99.5 | 188 | 98.4 | Hypothetical protein |
| 074 | 289 | 100.0 | 289 | 100.0 | 289 | 100.0 | 289 | 99.7 | mRNA capping enzyme |
| 075 | 545 | 100.0 | 545 | 100.0 | 545 | 100.0 | 545 | 100.0 | Rifampicin resistance, membrane protein |
| 076 | 150 | 100.0 | 150 | 99.3 | 150 | 99.3 | 150 | 98.7 | Late transcription factor VLTF2 |
| 077 | 224 | 100.0 | 224 | 100.0 | 224 | 100.0 | 224 | 99.6 | Late transcription factor VLTF3 |
| 078 | 82 | 98.8 | 79 | 95.1 | 82 | 97.6 | 83 | 90.4 | Thioredoxin-like protein |
| 079 | 675 | 99.9 | 674 | 99.4 | 675 | 99.4 | 675 | 99.4 | virion core, P4b precursor |
| 080 | 339 | 98.3 | 339 | 96.2 | 339 | 99.1 | 339 | 94.3 | Virion core protein |
| 081 | 172 | 99.4 | 172 | 98.3 | 172 | 99.4 | 172 | 99.4 | RNA-polymerase subunit RPO19 |
| 082 | 378 | 99.2 | 378 | 98.4 | 378 | 99.2 | 378 | 98.1 | Hypothetical protein |
| 083 | 706 | 99.9 | 706 | 99.9 | 706 | 99.7 | 706 | 99.9 | Early transcription factor |
| 084 | 303 | 100.0 | 303 | 100.0 | 303 | 100.0 | 303 | 99.7 | Intermediate transcription factor |
| 085 | 93 | 100.0 | 93 | 100.0 | 93 | 100.0 | 93 | 100.0 | Virion membrane protein |
| 086 | 905 | 99.8 | 905 | 99.9 | 905 | 99.8 | 905 | 99.2 | Virion core protein P4a precursor |
| 087 | 336 | 100.0 | 336 | 100.0 | 336 | 100.0 | 336 | 100.0 | Virion formation |
| 088 | 258 | 95.4 | 261 | 97.0 | 261 | 98.5 | 258 | 94.7 | Virion core protein |
| 089 | 92 | 98.9 | 92 | 100.0 | 92 | 98.9 | 92 | 100.0 | Virion membrane protein |
| 090 | 91 | 100.0 | 91 | 98.9 | 91 | 100.0 | 91 | 98.9 | IMV membrane protein |
| 091 | 53 | 100.0 | 53 | 100.0 | 53 | 100.0 | 53 | 98.1 | Putative virulence factor, IMV |
| 092 | 89 | 100.0 | 89 | 100.0 | 89 | 100.0 | 89 | 100.0 | Hypothetical protein |
| 093 | 358 | 99.4 | 358 | 99.7 | 358 | 99.7 | 358 | 98.9 | Myristylated protein |
| 094 | 196 | 100.0 | 196 | 100.0 | 196 | 99.5 | 196 | 98.0 | Phosphorylated IMV membrane protein |
| 095 | 488 | 99.8 | 488 | 99.8 | 488 | 100.0 | 488 | 99.8 | DNA helicase |
| 096 | 91 | 100.0 | 91 | 98.9 | 90 | 97.8 | 91 | 100.0 | Zn-finger protein |
| 098 | 108 | 99.1 | 108 | 100.0 | 108 | 100.0 | 108 | 100.0 | Hypothetical protein |
| 097 | 429 | 99.8 | 429 | 99.8 | 429 | 99.8 | 429 | 99.3 | DNA polymerase processivity factor |
| 099 | 146 | 100.0 | 146 | 100.0 | 146 | 100.0 | 146 | 100.0 | Resolvase |
| 100 | 377 | 99.2 | 380 | 99.7 | 380 | 100.0 | 380 | 99.7 | Intermediate transcription factor VITF3 |
| 101 | 1 161 | 100.0 | 1 161 | 100.0 | 1 161 | 100.0 | 1 161 | 100.0 | RNA polymerase RPO132 |
| 102 | 520 | 99.8 | 520 | 98.7 | 520 | 98.8 | 518 | 80.7 | A-type inclusion protein/fusion peptide hybrid |
| 103 | 516 | 99.6 | 516 | 97.1 | 516 | 96.7 | 522 | 65.2 | A-type inclusion protein |
| 104 | 90 | 95.6 | 90 | 97.8 | 90 | 97.8 | 90 | 87.8 | Viral fusion peptide |
| 105 | 140 | 99.3 | 140 | 99.3 | 140 | 99.3 | 140 | 99.3 | IMV surface protein |
| 106 | 314 | 99.7 | 314 | 99.4 | 314 | 99.7 | 317 | 98.4 | RNA polymerase subunit RPO35 |
| 107 | 60 | 100.0 | 60 | 100.0 | 60 | 100.0 | 60 | 100.0 | Virion morphogenesis |
| 107.5 | 49 | 95.9 | 49 | 95.9 | 49 | 98.0 | 49 | 95.9 | Hypothetical protein |
| 108 | 266 | 98.9 | 266 | 98.9 | 266 | 98.9 | 271 | 94.9 | Atpase, DNA packaging |
| 109 | 160 | 85.8 | 160 | 98.1 | 165 | 64.1 | 160 | 87.7 | EEV glycoprotein |
| 110 | 165 | 90.3 | 165 | 100.0 | 167 | 64.4 | 165 | 93.3 | EEV glycoprotein |
| 111 | 179 | 99.4 | 179 | 99.4 | 179 | 98.9 | 179 | 98.9 | Hypothetical protein |
| 112 | 287 | 96.9 | 287 | 96.9 | 286 | 92.7 | 286 | 92.3 | Chemokine binding protein |
| 113 | 211 | 95.7 | 208 | 97.1 | 206 | 95.2 | 205 | 94.3 | Hypothetical protein |
| 114 | 346 | 98.6 | 346 | 98.8 | 346 | 98.8 | 346 | 97.4 | Hypothetical protein |
| 115 | 145 | 99.3 | 145 | 97.9 | 143 | 96.6 | 143 | 95.2 | Hypothetical protein |
| 116 | 228 | 92.7 | 244 | 87.8 | 223 | 91.0 | 240 | 86.2 | Hypothetical protein |
| 117 | 265 | 99.2 | 265 | 98.9 | 265 | 99.6 | 265 | 98.9 | GM-CSF/IL-2 inhibition factor |
| 118 | 119 | 98.3 | 119 | 98.3 | 119 | 100.0 | 119 | 97.5 | Hypothetical protein |
| 119 | 206 | 98.1 | 206 | 98.1 | 206 | 98.5 | 206 | 96.6 | Hypothetical protein |
| 120 | 196 | 97.5 | 196 | 97.0 | 196 | 93.1 | 195 | 93.5 | Hypothetical protein |
| 121 | 306 | 99.3 | 300 | 97.7 | 300 | 97.4 | 300 | 95.1 | Hypothetical protein |
| 122 | 323 | 99.1 | 323 | 99.4 | 323 | 99.1 | 323 | 97.5 | Hypothetical protein |
| 123 | 525 | 98.7 | 525 | 99.4 | 525 | 99.0 | 525 | 98.5 | Ankyrin/F-box protein |
| 124 | 532 | 99.1 | 532 | 99.1 | 532 | 99.4 | 532 | 97.7 | Hypothetical protein |
| 125 | 173 | 99.4 | 173 | 99.4 | 173 | 98.8 | 173 | 98.8 | Hypothetical protein |
| ORF | CHB | HRE | NAV | ARA | Predicted function | ||||
|---|---|---|---|---|---|---|---|---|---|
| Length (aa) | % Id | Length (aa) | % Id | Length (aa) | % Id | Length (aa) | % Id | ||
| 126 | 497 | 99.6 | 497 | 99.8 | 497 | 99.2 | 497 | 99.6 | Ankyrin/F-box protein |
| 127 | 186 | 97.8 | 185 | 96.2 | 186 | 97.3 | 185 | 95.7 | Interleukin 10 |
| 128 | 501 | 98.4 | 501 | 98.8 | 501 | 98.4 | 501 | 96.4 | Ankyrin/F-box protein |
| 129 | 520 | 99.2 | 520 | 99.2 | 520 | 98.8 | 520 | 99.2 | Ankyrin/F-box protein |
| 130 | 498 | 100.0 | 498 | 99.8 | 498 | 100.0 | 497 | 99.8 | Protein kinase |
| 131 | 225 | 99.6 | 225 | 99.1 | 225 | 99.1 | 225 | 96.5 | Membrane protein |
| 132 | 133 | 97.0 | 132 | 89.5 | 137 | 80.9 | 148 | 54.2 | vegf-e |
| 134 | 149 | 98.7 | 149 | 99.3 | 149 | 99.3 | 149 | 96.6 | Hypothetical protein |
| SAMPLE | G + C (%) | SSR | RA | RD | MONO | DI | TRI | TETRA | PENTA | HEXA | SSR | SSR | cSSR | cSSR-coding |
|---|---|---|---|---|---|---|---|---|---|---|---|---|---|---|
| ARA | 83.25 | 934 | 6.77 | 48.22 | 5.35 | 75.16 | 19.06 | 0.21 | 0 | 0.21 | 90.69 | 9.31 | 64 | 93.75 |
| NAV | 84.00 | 946 | 6.89 | 49.32 | 5.39 | 74.84 | 19.24 | 0.21 | 0 | 0.32 | 90.80 | 9.20 | 67 | 89.55 |
| CHB | 83.01 | 951 | 6.93 | 49.35 | 5.47 | 75.50 | 18.61 | 0.00 | 0 | 0.42 | 90.64 | 9.36 | 64 | 87.50 |
| HRE | 84.15 | 936 | 6.82 | 48.78 | 5.34 | 74.68 | 19.34 | 0.32 | 0 | 0.32 | 91.77 | 8.23 | 63 | 93.65 |
| NZ2 | 83.54 | 954 | 6.92 | 49.64 | 5.24 | 74.84 | 19.08 | 0.31 | 0 | 0.52 | 90.67 | 9.33 | 68 | 86.76 |
| SA00 | 80.64 | 1 012 | 7.23 | 51.96 | 4.94 | 74.51 | 18.28 | 2.08 | 0 | 0.20 | 85.08 | 14.92 | 75 | 82.67 |
| cSSR | Cluster 1 | Cluster 2 | Cluster 3 | F00.120R and VR634 | Protein | Hypothetical function | sequence |
|---|---|---|---|---|---|---|---|
| (GC)3-x1-(AC)3 | x | x | x | - | ORFV081 | RNA-polymerase subunit RPO19 | gcgcgctacacac |
| (CG)4-x0-(GC)3 | x | - | - | ORFV038 | Late transcription factor elongation factor | cgcgcgcgcggcgcgc | |
| AGG)3-x7-(GC)3 | x | - | - | - | ORFV064 | mRNA capping enzyme subunit | aggaggagggcaagttgcgcgc |
| (TC)3-x7-(C)7-x6-(CG)3 | x | - | - | - | ORFV017 | DNA binding phosphoprotein | tctctcccgccgtcccccccatgccccgcgcg |
| (TTCC)3-x-3-(TCC)3 | x | - | - | - | - | - | ttccttccttcctcctcc |
| (GC)3-x4-(GC)3 | x | - | - | - | ORFV128 | Ankyrin/F-box protein | gcgcgcccgagcgcgc |
| (CT)3-x7-(CG)3 | - | Partial | - | - | ORFV063 | Hypothetical protein | ctctctgcgcacacgcgcg |
- —Gobierno de Navarra10.13039/501100017266
- —Agencia de Promoción Científica y Tecnológica, Argentina
Peer Reviews
No public reviews on file for this paper yet. If you reviewed it on a platform where reviews are public (OpenReview, ICLR, NeurIPS, ICML), you can paste yours below so the community can read it here.
Videos
No videos yet. Explain this paper in a talk, walkthrough, or lecture? Add one.
Taxonomy
TopicsPoxvirus research and outbreaks · Herpesvirus Infections and Treatments · Virology and Viral Diseases
Introduction
Contagious Ecthyma (CE), also known as Orf, contagious pustular stomatitis or contagious pustular dermatitis, is a worldwide-distributed viral skin disease affecting primarily goats, sheep, and wild ruminants, but also humans causing self-limiting painful pustular lesions on fingers and hands (McElroy and Bassett 2007). CE is caused by Orf virus (ORFV), a member of the family Poxviridae, and the most prevalent within the Parapoxvirus (PPV) genus, which also includes bovine papular stomatitis virus (BPSV), pseudocowpoxvirus (PCPV), PPV of red deer in New Zealand (PVNZ) and PPV of the grey seal (Nettleton et al. 1995). ORFV infects epithelial cells causing severe proliferative dermatitis, which evolves from macules, papules, pustules to scabs, and fissured crusts (Nandi et al. 2011). Lesions are commonly found around the lips, mouth muzzle, nostrils, teats, and oral mucosa, but can also be found in the oesophagus, hooves, reproductive organs, rumen, or respiratory tract (Zhao et al. 2010). Albeit lesions usually resolve in 1 to 2 months, reinfection is commonly observed (McKeever et al. 1988), regardless the administration of live-attenuated vaccines. In some countries, ORFV vaccines produced by multiple passages in cell cultures, achieving attenuation, are marketed. Despite the potential advantages of this type of vaccine, several drawbacks have been reported, ranging from virulence reversion, gene loss, vaccination failure, or contamination with other microorganisms during production (Asín et al. 2021, Buddle and Pulford 1984, Cottone et al. 1998, Jorge and Dellagostin 2017).
ORFV infection is endemic in most countries with sheep/goat-raising industries (Robinson and Balassu 1981). Affected animals, mainly young lambs, dramatically reduce their food intake due to the occurrence of painful lesions, causing transient impairment in daily weight gain, and therefore, to important economic losses in farms with recurrent outbreaks. Noteworthy, the morbidity rate often reaches 100%, and despite the mortality rate is usually low, secondary bacterial infections, such as, pododermatitis and mastitis (Burriel 1997), further increase sanitary costs (Haig and Mercer 1998).
The ORFV genome consists of 132 putative genes distributed along a ~ 135kbp linear double-stranded DNA (Delhon et al. 2004) with an unusually high GC content (~64%) under positive selection (Sahu et al. 2020). Recently, recombination has been suggested as the main force driving genetic evolution and ORFV virus diversity (Sahu et al. 2020), which may jeopardize vaccination strategies. Strikingly, despite worldwide distribution and increasing reports of Orf outbreaks, relatively few strains have been isolated, a small proportion have been completely sequenced and little genetic information of the related strains is available. There are 48 whole genome sequences publicly available, derived from sheep, goats, wild ruminants, and one human sample. For our analyses we selected 44 genomes from sheep and goats, including isolates from China, Malaysia, North America, Germany, France, Italy, India and New Zealand (see Table 1).
Phylogenetic studies usually rely on single genes, being orf011 (B2L) followed by orf020 (VIR), orf132 (VEGF), and orf059 (F1L) the most reported in the literature (Guo et al. 2004, Hosamani et al. 2006, Chan et al. 2007). According to VEGF alleles (orf132), a classification into NZ2- and NZ7-like strains was proposed (Mercer et al. 2006). More recently, according to orf011 and orf020 genes, a classification attending to animal species, sheep or goat has been proposed (Velazquez-Salinas et al. 2018; Karki et al. 2019). However, depending on the selection pressures affecting different genes, evolution inferences may suffer from inaccuracy when considering individual or concatenated genes (Yao et al. 2020).
Microsatellites, also known as simple sequence repeats (SSR), are 1-6 bp unit repeated ubiquitously in the genome of eukaryotes, prokaryotes, and viruses (Davis et al. 1999, Tóth et al. 2000, Mrázek et al. 2007, Alam et al. 2013). Compound microsatellites (cSSR) are composed of two or more individual SSRs directly adjacent to each other, for example, (CAG)n-Xn-(TA)n. Some studies have proposed the use of SSR and cSSR for the characterization of viral strains (Walker et al. 2001, Sahu et al. 2020).
In this study, we analysed four different CE outbreaks reported in South America and Europe. ORFV presence was confirmed in all animals by performing specific PCR amplification of orf045 and orf011 genes in lesions. Isolation was attempted in different ovine primary cells using scabs and replication was assessed by molecular methods. Complete genome sequences were obtained by NGS methods and analysed regarding genome structure, SSRs, recombination events, evolutionary rate, and phylogenetic inferences.
Genetic characterization of ORFV circulating strains may shed light on the molecular epidemiology that underlies ORFV infection. Deciphering genome content and diversity is a first step towards the development of new detection and prevention tools against CE.
Material and methods
Sheep flocks and tissue collection
Spanish flocks from Navarra (42° 49′ 00″ N 1° 39′ 00″ W) and Aragón (41° 39′ 23″ N 0° 52′ 36″ W) under routine veterinary surveillance, were included in the study after reporting two outbreaks of CE in April and May 2017, respectively, (samples NAV and ARA, respectively).
Argentine samples were collected in Huinca Renancó (34° 50′22″ S 64° 22′19″ W) province of Córdoba (sample HRE) and Chacabuco (34° 38′31”S 60° 28′17 “W) province of Buenos Aires (sample CHB) in 2015 and 2016, respectively. In both cases, shepherds did not report previous cases of CE, with the difference that the CHB flock incorporates new animals every year, while HRE is a closed establishment.
Scabs were excised from animals during routine diagnosis by veterinarians, using scalped blades and tweezers, maintained refrigerated until shipment to the respective laboratory and then stored at −80 °C for further analyses. Therefore, ethical approval was not required for reporting these cases.
Virus purification and DNA extraction
Scabs were thoroughly homogenized in liquid nitrogen and 20 mg of the resulting tissue powder was placed in a microcentrifuge tube and incubated with lysis buffer (100 mM Tris–HCl pH 7.5, 12.5 mM ethylenediaminetetraacetic acid (EDTA), 150 mM NaCl, 0.5% Sodium dodecyl sulfate (SDS)) and proteinase K at 56 °C in a water bath, until complete tissue lysis. DNA was then extracted, according to the manufacturer’s instructions (EZNA DNA tissue kit) and stored at −20 °C.
For ORFV detection, PCRs targeting 045 and 011 genes were carried out using previously described methods (Kottaridi et al. 2006).
Sample preparation for MiSeq sequencing
In order to purify viral particles from the scabs, a previously developed protocol (Zwartouw et al. 1962) was used with some modifications:
For Argentine samples, 500 mg of scab material were macerated in a pestle under liquid nitrogen until a homogeneous powder was obtained. A 30% suspension (weight/volume) was prepared in TMN buffer (10 mM Tris–HCl pH 7.5; 1.5 mM MgCl_2_; 10 mM NaCl).
In the case of the Spanish samples, given the limited starting material (< 50 mg of scab), viral amplification was carried out in ovine epithelial cell culture (Eov). The Eov cell culture was derived from a skin biopsy of a healthy adult sheep at the Virology Institute (INTA, Argentina) in 2017. It was analysed to rule out adventitious viruses at the same institute. The number of passages (eight) before the culture entered senescence and ceased to thrive was determined. Passages 4 and 5 were evaluated for ORFV multiplication. Initially, half of the scab maceration was inoculated into one well of a 6-well plate, and the characteristic cytopathic effect of ORFV was observed at Day 3 post-infection. The cells and supernatants were harvested and subjected to three cycles of freezing and thawing. This first passage was used to infect a T25 flask, until the cytopathic effect was evident. The cells and supernatant from the two passages were combined with the second half of the scab sample for further purification along with the Argentine samples.
Samples were freeze-thawed at −80 °C once and sonicated for three cycles of two minutes each, in bath (Elmasonic, sweep mode). Then, the suspension was centrifuged at 2000 x g for 10 min at 4 °C. Clarified supernatant was loaded onto a 30% sucrose cushion (w/w in TMN buffer) and pelleted at 39 000 g for 30 min (Beckman rotor 70Ti). Pellets were resuspended in 2 ml of TMN buffer and further purified on a sucrose cushion (30%–60%) by centrifuging at 12 °C in a swinging rotor (SW41) at 39000 g for 20 min. Purified virus formed an opalescent halo in the 50% sucrose layer. The purified virus was collected and diluted with 2 volumes of TMN buffer and centrifuged at 35 000 g for 60 min. The pellet was resuspended in 50 μl of TMN buffer and stored at—80 °C.
Genomic DNA preparation and sequencing
DNA extraction was performed according to the manufacturer’s instructions of QIAamp DNA mini Kit (QIAGEN). DNASeq library compatible with short read Illumina sequencing was generated using the NEB Ultra DNA library Kit (NEB) starting with 500 ng of DNA, as measured by Qubit (Invitrogen) and following the manufacturer’s instructions. Briefly, DNA was fragmented, end-repaired and subsequently the adapter was ligated. Agencourt AMPure XP beads were used to size select the DNA fragments containing the adapters. Finally, the library was amplified by 15 PCR cycles. The fragment size distribution of the library was analysed on a BioAnalyzer High Sensitivity LabChip showing a size range between 400 and 446 bp with the main peak of the library at 401 bp. The library was diluted to 2 nM and multiplex-sequenced together with five samples on the Illumina MiSeq (2 × 250 bp paired end run, estimated 4.3 million reads/sample).
Raw sequence data processing, mapping, assembly, and genome annotations
For each sample, the sequenced raw data were processed to obtain high-quality reads. Reads with a quality score of Q ≤ 30 or length under 50 bp were discarded and adapter-trimmed using BBDuk (Bushnell 2019). Sequences were mapped against the host genome (Ovis aries) to remove host DNA contamination. Unmapped reads were used as input data for de novo assembly using SPAdes genome assembler v3.15.2 (Bankevich et al. 2012). This procedure rendered two (NAV) or three (HRE, CHB, and ARA) contigs that corresponded to ORFV virus according to Blastx. The resulting contigs were aligned to the reference genome NZ2 (DQ184476.1) and manually checked to obtain draft genomes. Finally, each set of high-quality reads was aligned to the corresponding draft genome using Bowtie2. The consensus genome sequences were extracted using bcftools (Danecek et al. 2021). New ORFV whole sequenced genomes were annotated using GATU with NZ2 as genome reference to capture all the potential open reading frames (ORFs) (Tcherepanov et al. 2006).
Detection of simple sequence repeats
Simple and compound microsatellites were extracted with IMEx software (Mudunuri et al. 2010), which identified perfect mono-, di-, tri-, tetra-, penta-, and hexanucleotide repeats along the genomes characterized. The minimum numbers of iterations were 6, 3, 3, 3, 3, and 3 for mono- to hexanucleotide motifs, respectively, using the parameters previously used for RNA (Chen et al. 2009) and DNA viruses (Wu et al. 2014, Hatcher et al. 2015). Maximum distance allowed between any two SSRs (dMAX) was 10 nucleotides. Other parameters were used as default. Compound microsatellites (cSSR) were not standardized in order to determine real composition.
Phylogenetic analysis
The whole genome sequences obtained were aligned using the MAFFT version 7 package (Katoh and Standley 2013) and curated manually. The phylogenetic analysis was carried out through the maximum likelihood method using IQ-Tree program version 1.4.2(Minh et al. 2020). IQ-Tree was also used for estimating the substitution model by means of ModelFinder. Then, the tree was built using GTR + G4 evolution model within 000 replicates for bootstrap, and the results were visualized with FigTree 1.4.0 tool (available at https://github.com/rambaut/figtree/releases).
Alternatively, MrBayes version 3.2.7 (Ronquist et al. 2012) was used for building trees through Bayesian methodology, setting nst: 6, rates: gamma, and invariant sites as model parameters. This analysis was run for 10 million Markov chain Monte Carlo (MCMC) iterations, sampling trees every 1000 generations. About 10% of the burn-in was considered. Tracer 1.7 version (Rambaut et al. 2018) was used for checking the convergence and evaluating that the effective sample size for relevant parameters was >200. Finally, the tree topology was visualized with FigTree.
Sequence clusters were determined using the Fast hierarchical Bayesian analysis of population structure algorithm (fastbaps), which applies the hierarchical Bayesian clustering (BHC) algorithm to determine clusters of multi-sequence genotypes (Tonkin-Hill et al. 2019). Based on the obtained alignment, 32 genes were selected based on high sequence conservation among available strains.
Detection of recombinant regions
The whole genome multiple sequence alignment was analysed in RDP5 software v. 5.5 (Martin et al. 2021). This software applies several analysis methods to identify the presence of recombinant sequences. Data were analysed using the following recombination methods: RDP, GENECONV, Bootscan/Recscan, MaxChi, Chimaera, SiScan, and 3-seq. Recombination events considered were detected by at least 5 of these 7 methods. A recombination breakpoint graph was obtained and used to detect recombinant regions.
Evolutionary rate and most recent common ancestor estimations
To verify the temporal signal and molecular clocklike behaviour, the TempEst software was implemented (available at https://beast.community/tempest) providing dates of each sample. Evolutionary rate and time to the most recent common ancestor (TMRCA) were estimated through Bayesian coalescent analysis using BEAST program 10.4 version (available at https://beast.community). For this study, a non-parametric Bayesian Skyride coalescent model with an uncorrelated lognormal relaxed clock was used. This analysis was run on samples from the cluster 3, three times for 100 million MCMC iterations each with 10% burn-in, and Tracer 1.7 v. was used to check convergence evaluating that the effective sample size was > 200 for relevant parameters.
Results
Genome characterization
The assembled genomes of ARA, CHB, HRE, and NAV were 137 891, 137 160, 137 340, and 137 214 bp long respectively. As expected, all four genomes contained a large central coding region surrounded by two inverted terminal repeat (ITR) regions. In each case, the left end nucleotide was designated as base 1. Aligned with other whole genome sequences of ORFV strains (Table 1), the ARA strain showed the highest similarity with SY17 strain, showing 98.7% nucleotide identity. For CHB and HRE the largest nucleotide identity was observed with NZ2, with 99.1% and 99.0% respectively. NAV strain showed an identity of 99.1% with the TVL strain.
The ITRs of these viruses were 2 943, 3 108, 3 161, and 3 177 bp (ARA, CHB, HRE, and NAV). The ITR of ARA contained the terminal BamHI sites and the telomere resolution sequence at both ends, similar to SJ1, GO, YX, MP, NA17, SY17, and CL18 strains. However, CHB, HRE, and NAV strains only contained one BamHI site and the conserved telomere-related sequence at the right end, as the NA1 and NP strains.
The G + C nucleotide composition of these ORFV genomes was ARA 63.89%, CHB 64.22%, HRE 64.31%, NAV 64.32% which are similar to the average value of PPV genomes. We used a moving average analysis with a 1 000 bp window to analyse the G + C percentage from the genomes of the four ORFV isolates using NZ2 as a comparison (Fig. 1). The G + C percentage of each strain was predominantly high in the central region and lower in the terminal regions of the genome. Around positions 103–108 kb, a pronounced deviation from the average G + C content was observed. This recognizable signature can be seen in the other strains used in this work (Supplementary Fig. 1).
Genome characterization of the full-length genomes. G/C content genome profile of Argentinian (HRE and CHB) and Spanish (ARA and NAV) together with reference strain ORFV-NZ2 (sliding window size: 100 bp; made with in house R script).
Gene annotation was performed using NZ2 as the reference genome, and 132 genes were identified for each sample in this study (Fig. 2). Additionally, genes were predicted based on their localization within the genome, the size of the predicted proteins and by similarity with proteins previously described in PPV. The majority of the open reading frames were non-overlapping, consistent with other poxvirus genomes and showed both, a relatively high amino acid identity and similar length with their NZ2 counterparts (Table 2).
Comparative map of the CHB, HRE, ARA and NAV whole genomes. Each ORF is represented by an arrow that indicates the size and direction of transcription; open arrowheads indicate that an ORF is split over two lines of the diagram. Different colours of arrows indicate amino acid identity of predicted proteins between the corresponding genome and ORFV-NZ2.
Interestingly, few notable exceptions were found in the genomes described in this work, regardless of geographical origin:
ORF002 from ARA, which overlaps with ORF001 and is ~50% larger than the encoded in NZ2.The ORFs 102, 103, and 104 from ARA showed a lower level of identity with NZ2 (80, 65, and 88, respectively) than the other three isolates.Meanwhile, the ORFs 109 and 110 showed lower identity in NAV isolate (64.1 and 64.4%) and somewhat higher (from 85.8%) for ARA and CHB isolates.
SSR and cSSR analysis
The SSR analysis of the four isolates show a Relative Abundance (RA) and a Relative Density (RD) similar to that of NZ2 (Table 3). In each case the most abundant type of repeat was the dinucleotide (DI) followed by TRI, MONO, HEXA, and TETRA repeats. No PENTA repeat was detected.
Additionally, the compound SSR (cSSR) composition was obtained and the occurrence of each cSSR in the 50 PPV full genomes used in this work was analysed. Of the 308 cSSR found, more than half (159) were present in only one sample each. Furthermore, 48 ORFV complete sequences presented the cSSR (GC)3-x1-(AC)3, that was not present in PCPV samples (F00.120R and VR634). Interestingly, cluster 1 and cluster 2 presented 3 and 1 specific cSSR, respectively (Table 4 and Fig. 3).
Comparative map of the CHB, HRE, ARA and NAV whole genomes. Each ORF is represented by an arrow that indicates the size and direction of transcription; open arrowheads indicate that an orf is split over two lines of the diagram. Different colours of arrows indicate amino acid identity of predicted proteins between the corresponding genome and ORFV-NZ2.
Phylogenetic analysis
The phylogenetic analysis was performed at three different levels: full genome, excluding recombinant regions and using 32 selected genes (Fig. 3, Fig. 4 and supplementary Fig. 2).
Phylogenetic analysis. Maximum-likelihood phylogenetic tree based on genome sequences, excluding recombinants regions (A), and 32 concatenated selected genes (B). The numbers at nodes correspond to bootstrap values. Tip labels indicate goat and sheep samples, respectively.
The phylogenetic tree derived from the full-length genome alignment was well supported, with a group structure of three clusters, namely 1, 2, and 3 (Fig. 3).
Cluster 1 is composed mostly by goat and sheep sequences from Chinese origin, with the exceptions of D1701 sample from Germany. Cluster 2 does not seem to have a monophyletic origin and is formed mostly by goat strains, which share the (CG)4-X0-(GC)3 cSSR. Interestingly, only Asian strains of this group presented the molecular signature of the (CT)3-X7-(CG)3 cSSR (Fig. 3). Cluster 3 comprised sheep strains, with representation from North, Central, and South America, Europe, Africa, and only four Chinese strains. The four strains in this study (ARA, CHB, HRE, NAV) belong to cluster 3. Interestingly, sequences from wild ruminants and a human strain are placed within cluster 3 (Supplementary Figure 3).
In order to test if a better separation between species could be achieved, by avoiding tne inclusion of recombination areas that might confuse the phylogenetic signal, recombinant regions were identified and excluded from the alignment (positions 19 000 to 100 904 of the full-length genome alignment were retained). A concatenated sequence 81 905 bp-long was obtained for each sample. The obtained tree showed a similar group structure with the three clusters (Fig. 4), but now it is possible to establish better phylogenetic relationships in cluster 2. In cluster 3, two groups emerged: one containing Argentine strains CHB and HRE and Spanish NAV along with strains from Cuba, the United States, and Italy; while in the other group we can find the Spanish ARA strain along with strains from China, Morocco, and the Italian S19.
Moreover, we selected 32 highly conserved genes for the family Poxviridae (Babkin and Babkina 2011; Le Loc’h et al. 2015), all present in the dataset excluding recombinant regions. Most of these genes encode proteins involved in viral DNA replication and transcription. Specifically**,** a 42 417 bp-long concatenated sequence was identified and the obtained tree was well supported (bootstrap value of 100%). The maximum likelihood tree showed a similar group structure consistent with previous analyses (Fig. 4B).
Evolutionary estimated rate and most recent common ancestor
We performed a molecular clock analysis on all three datasets obtaining well-supported Bayesian trees (posterior probability of 1), confirming clade composition and group structure observed with the maximum-likelihood method (data not shown). No convergence was obtained when the full-length genome or the non-recombinant regions datasets were considered. But convergence was obtained for the 32 selected genes dataset.
The temporal signal analysis exhibited a positive correlation between genetic divergence and time, however diffuse regression plots (R^2^ = 0.043) were obtained using the full-length genome dataset (Supplementary File 1). Analysing only cluster C, a slight improvement in the regression coefficient was obtained (R^2^ = 0.099). These results strongly suggest an uneven evolutionary rate among the branches, so a relaxed molecular clock was chosen for the next phylogenetic analysis.
The MCMC analysis, performed with Beast software for the worldwide cluster 3 that includes the four samples described in this study, estimated a nucleotide substitution rate of 2.6 x10^−5^ subs/site/year (9.2x10^−8^—6.7x10^−5^—95% HPD) placing the TMRCA (median divergence time) around 1729 (X—95% HPD). The result was consistent among the three runs.
Discussion
In this work, we isolated and sequenced four novel ORFV strains named ARA, CHB, HRE, and NAV from infected sheep in Argentina and Spain. The whole genomic sequence of the isolates ranged between 137 160 and 137 891 bp, including the inverted terminal repeats. Despite differences in length, all the sequences obtained resembled those publicly available in gene composition, encoding 132 non-overlapping genes as featured by other ORFV.
The G + C content for all samples was ~64%. This value coincides with that described for other genomes of the PPV genus (Mercer et al. 2006). A small region located approximately between 103 and 108 kb with a low G + C concentration (40%–45%) draws attention. This coincides with previous findings in ORFV genomes, and also in PCPV and BPSV genomes, so it could be considered a molecular signature of the PPV genus as previously proposed (Mercer et al. 2006; Hautaniemi et al. 2010).
Characterization of the four genomes with respect to microsatellites showed between 934 and 951 SSRs per genome, with RA and RD values between 6.77–6.89 and 48.22–49.35 respectively. These values are slightly lower than those reported by Sahu et al. 2020, but within the ranges found for other DNA viruses (Ouyang et al. 2012, Singh et al. 2014). In the four genomes, the most abundant repetitive units were: dinucleotide (75.04%), trinucleotide (19.06%) and mononucleotide (5.38%). The majority of the SSRs and cSSRs were found in coding regions (90.97% and 91.11% respectively). This distribution is reasonable since viruses have short intergenic regions and can often overlap with coding regions.
Certain studies have suggested the use of SSR and cSSR for the characterization of viral strains (Houng et al. 2009; Burrel et al. 2013). We focused on the analysis of cSSRs since, given the complexity of their structure, they could serve as specific spots to determine relationships between viral isolates. Cluster 1, primarily consisting of Chinese sheep and goat strains, shares three cSSRs: (TTCC)3-X3-(TCC)3, (AGG)3-X7-(GC)3 and (TC)3-X7-C7-X6-(CG)3. The only exception to this molecular signature is the German strain D1701, which lacks any of these cSSRs. This strain was obtained after multiple passages in cell culture and is characterized as attenuated due to the loss of genic regions (Cottone et al. 1998), which could explain the partial or complete absence of these cSSRs.
Cluster 2 (mainly sheep strains) presented a specific cSSR (CG)4-(GC)3 but only Asian samples contained the cSSR (CT)3-X7-(CG)3 (Fig. 3). It was not possible to find a cSSR as a marker for group 3. Maintaining the structure of cSSRs is complex because different forces act: mutations, duplication, recombination, etc. It is possible that the members of group 3 have an incomplete cSSR and therefore cannot be detected by standard microsatellite studies (Delgrange and Rivals 2004, Mudunuri and Nagarajaram 2007). Having information from more genomes would allow us to determine if these cSSRs are really a molecular signature of groups 1 and 2 or if they are a residual in the differentiation of these groups.
Our phylogenetic analyses with full-length genomes (Fig. 3), and in datasets with partial sequences, based on the whole genome excluding recombinant regions (Fig. 4A) and the 32 selected conserved genes (Fig. 4B) suggest a viral population structuring in three well-supported clusters.
The four samples that originated from sheep and were isolated from Argentina (CHB and HRE) and Spain (NAV and ARA) grouped with other sheep samples (Cluster 3). A phylogenetic analysis based on the whole genomic sequences of 44 ORFV strains revealed that CHB and HRE strains isolated from Argentinian sheep have a close relationship with NZ2 from New Zealand. Spanish sequence NAV was highly similar to TVL and S194 strains (USA and Cuba respectively), while ARA (Spain) was associated to Chinese SY17 and CL18, and MOR20 from Morocco.
Regarding the two Spanish samples sequenced and analysed in this paper, it is remarkable that both belong to two different groups/clades, confirming the existence of at least two genomic clusters circulating in this country.
On the contrary, the two Argentinean samples showed a closer relationship within the same cluster. Nevertheless, previous descriptions have found the presence of distinct clusters in the country (Peralta et al. 2018) based on analysis of partial sequences from genes orf011, orf020, orf109, and orf127, so it is essential to gather data from additional sequences in order to accept or reject this hypothesis. In addition to the difference in the data set that was used in both studies, in Peralta et al. 2018, ORFV strains from goats were analysed, so we could be observing a different evolutionary history of the ORFV in Argentina, depending on the host species. However, it is essential to gather data from additional sequences in order to accept or reject this hypothesis.
Interestingly, some research using specific genes (Chi et al. 2015, Coradduzza et al. 2021) has established a clustering of sequences by host. However, when whole genomes are analysed (Coradduzza et al. 2024, and Figs. 3 and 4A of this work), although the phylogenetic tree is separated into two large branches, there are sequences from caprine in the ovine branch and there are sequences from ovine in the caprine branch. Additional analysis including more sequences, ideally from a more representative geographic background, would clarify this point.
Due to the size and complexity of the genome, the analysis using whole genome sequences can generate discordant signals and incompatible results when compared to partial sequence analysis. For this reason, in this work, we conducted a gene selection reducing the interfering signals, bioinformatics cost and offering more reproducible results. Of the 90 genes that form the core of Chordopoxviruses (Upton et al. 2003) we selected 32 genes, many of which were used to determine the molecular clock either in Orthopoxvirus (Babkin and Babkina 2011) or in Avipoxvirus (Le Loc’h et al. 2015). It is not surprising that it was only with this set of data, that convergence was reached and molecular dating of the analysed sequences was obtained.
As far as we know, this is the first molecular epidemiology study that includes ORFV sequences using 32 highly conserved genes and showing comparable results to the full-length genome.
The nucleotide substitution rate inferred in this work was 2.6x10^−5^ subs/site/year. This value could be considered high for a DNA virus, but in accordance with previous works studying Myxoma virus (Kerr et al. 2017) or Avipox viruses (Le Loc’h et al. 2015). Noteworthy, the analysis of MCRA for the worldwide cluster 3, suggested a date in the 18th century, not far from the first case of ORFV reported in a sheep by Steeb in 1787 (Barraviera 2005). However, it is important to include more sequences in the analysis to reduce the confidence interval.
Since sheep and goats are not native animals to South America, it could be hypothesized that the ORFV arrived on the continent with colonization from Europe. The analysis of the four genomes available in our study (two from Spain and two from Argentina) does not allow us to confirm this hypothesis, although the Spanish NAV strain belongs to the same subgroup as the Argentine HRE and CHB. While whole-genome analysis can be challenging, it provides much more information than the analysis of individual genes, where each gene can tell a different evolutionary story (Li et al. 2023).
In this work, we determined the complete genome of two ORFV strains from Spain and two from Argentina. This is the first report for South America and the first for the Iberian Peninsula. Genetic characterization of ORFV strains is the first step towards the development of molecular tools oriented to diagnostics and vaccine development. Furthermore, increasing the knowledge on ORFV strains genetic composition will establish relationships and contribute to future epidemiological studies. Moreover, the ORFV evolutionary analysis will gain precision when more whole genome sequences become available.
Supplementary Material
Supplementary_materials_veag004_Figure_1
Supplementary_materials_veag004_Figure_2
Supplementary_materials_veag004_File_1
The reference list from the paper itself. Each links out to its DOI / PubMed record.
- 1Alam CM, Singh AK, Sharfuddin C et al. In-silico analysis of simple and imperfect microsatellites in diverse tobamovirus genomes. Gene 2013;530:193–200. 10.1016/j.gene.2013.08.04623981776 · doi ↗ · pubmed ↗
- 2Asín J et al. An outbreak of abortions, stillbirths and malformations in a Spanish sheep flock associated with a bovine viral diarrhoea virus 2‐contaminated orf vaccine. Transboundary and Emerging Diseases 2021;68:233–9. 10.1111/tbed.1361932386079 · doi ↗ · pubmed ↗
- 3Babkin IV, Babkina IN. Molecular dating in the evolution of vertebrate poxviruses. Intervirology 2011;54:253–60. 10.1159/00032096421228539 · doi ↗ · pubmed ↗
- 4Bankevich A, Nurk S, Antipov D et al. SP Ades: A new genome assembly algorithm and its applications to single-cell sequencing. J Comput Biol 2012;19:455–77. 10.1089/cmb.2012.002122506599 PMC 3342519 · doi ↗ · pubmed ↗
- 5Barraviera S . Diseases caused by poxvirus-orf and milker’s nodules: A review. J Venom Anim Toxins Trop Dis 2005;11:102–8.
- 6Buddle BM, Pulford HD. Effect of passively-acquired antibodies and vaccination on the immune response to contagious ecthyma virus. Veterinary Microbiology 1984;9:515–52. 10.1016/0378-1135(84)90013-06506446 · doi ↗ · pubmed ↗
- 7Burrel S, Ait-Arkoub Z, Voujon D et al. Molecular characterization of herpes simplex virus 2 strains by analysis of microsatellite polymorphism. J Clin Microbiol 2013;51:3616–23. 10.1128/JCM.01714-1323966512 PMC 3889742 · doi ↗ · pubmed ↗
- 8Burriel AR . Udder Orf infection and its role in ovine clinical mastitis caused by Pasteurella haemolytica. J Trace Elem Med Biol 1997;11:28–31. 10.1016/S 0946-672X(97)80006-59176868 · doi ↗ · pubmed ↗