Coexistence with Staphylococcus aureus modulates the virulence and antibiotic resistance of Pseudomonas aeruginosa
Zeinab M. Helal, Soha Lotfy Elshaer, Mohammed El-Mowafy, Elsayed E. Habib

TL;DR
Coexistence with Staphylococcus aureus increases Pseudomonas aeruginosa's antibiotic resistance and virulence in both lab and mouse experiments.
Contribution
This study reveals that co-culturing P. aeruginosa with S. aureus enhances resistance and virulence through synergistic interactions.
Findings
Co-cultured P. aeruginosa showed increased survival when treated with multiple antibiotics.
Virulence factors like pyocyanin and biofilm production were significantly elevated in co-cultures.
In vivo experiments showed co-infection with S. aureus increased P. aeruginosa pathogenicity and mortality in mice.
Abstract
In this study, we were aimed to investigate the impact of co-cultures of different bacterial species on bacterial antibiotic resistance and virulence. The effect of co-cultures of Pseudomonas aeruginosa (Gram-negative bacteria) and Staphylococcus aureus (Gram-positive bacteria) on antibiotic resistance, virulence and biofilm formation in P. aeruginosa was examined in vitro in 14 mixtures. These mixtures were categorized into three groups: Standard category (including standard strains), naturally co-isolated category (co-isolated from the same patient) and random co-culture category (bacterial species from different patients). Additionally, the impact of the standard category on pathogenicity was assessed in vivo using mouse model. Intergroup comparisons were conducted using multiple t-test and comparisons between treated and untreated control isolates grown under the same conditions…
Genes, proteins, chemicals, diseases, species, mutations and cell lines named across the full text — each resolved to its canonical identifier and authoritative record.
Click any figure to enlarge with its caption.
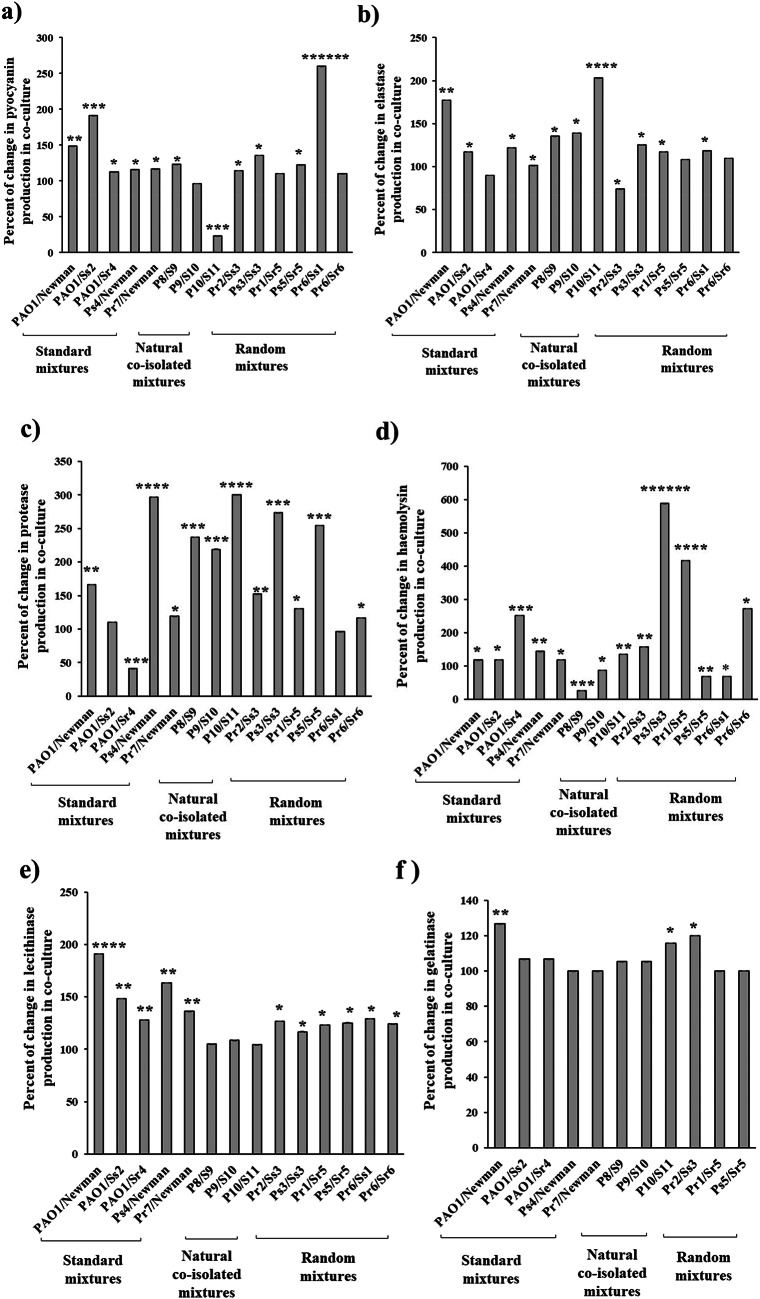 Figure 1
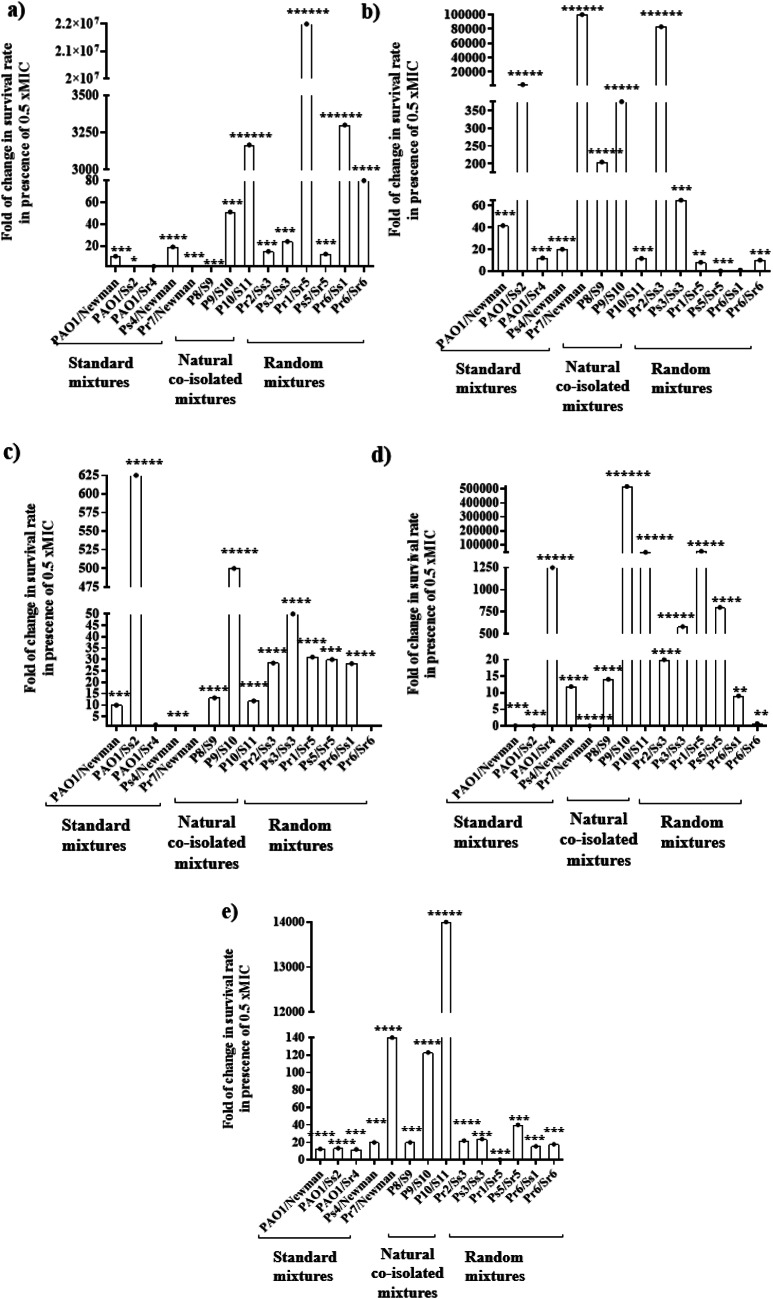 Figure 2
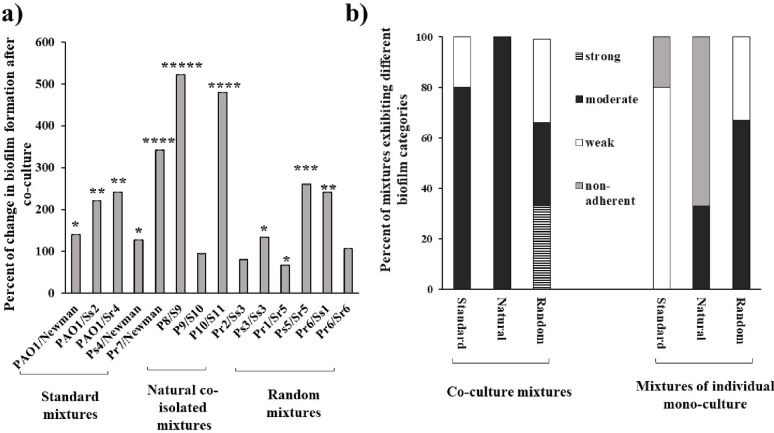 Figure 3
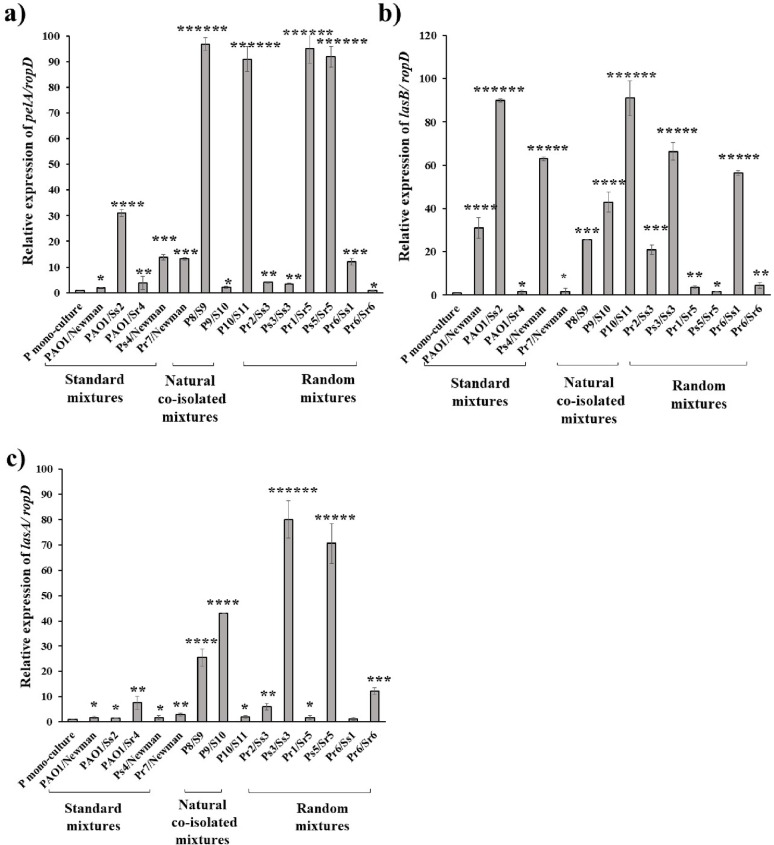 Figure 4
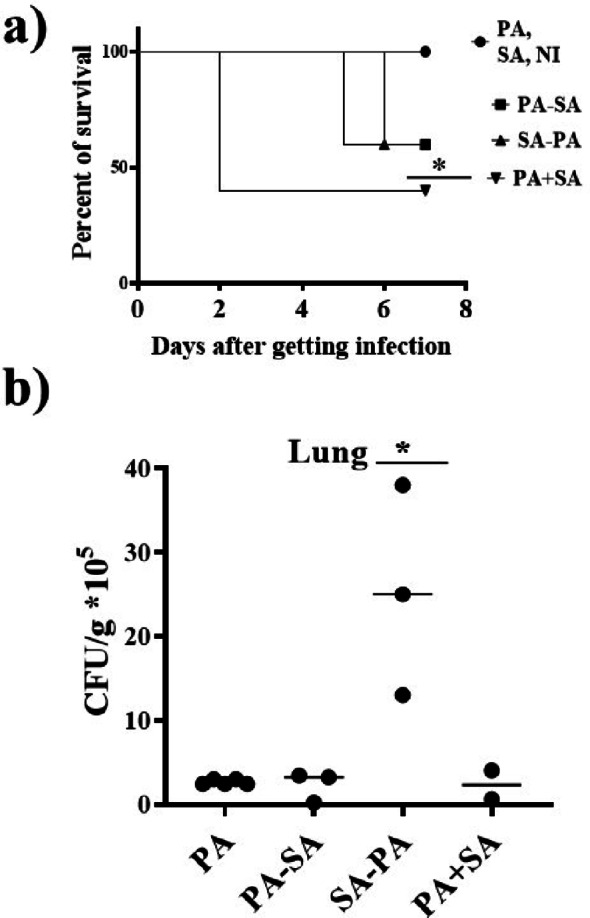 Figure 5
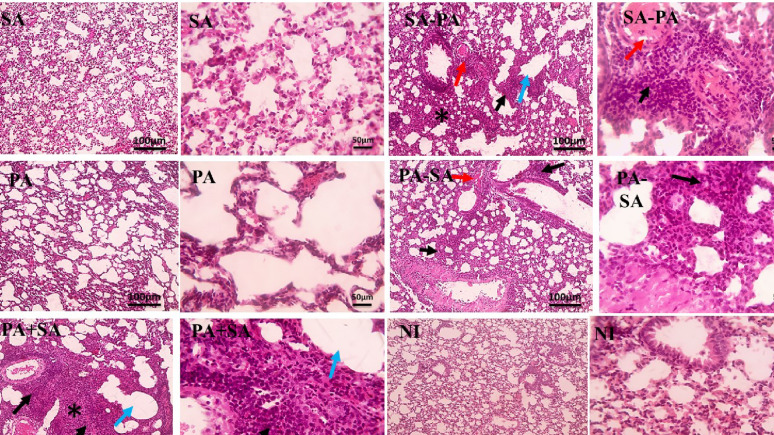 Figure 6
- —Mansoura University
Peer Reviews
No public reviews on file for this paper yet. If you reviewed it on a platform where reviews are public (OpenReview, ICLR, NeurIPS, ICML), you can paste yours below so the community can read it here.
Videos
No videos yet. Explain this paper in a talk, walkthrough, or lecture? Add one.
Taxonomy
TopicsBacterial biofilms and quorum sensing · Antibiotic Resistance in Bacteria · Infections and bacterial resistance
Background
Interactions between microorganisms of mixed species within an infection site, could worsen the infection’s outcomes and increase the rate of morbidity and mortality among hospitalized patients [1]. This type of infection can target the respiratory tract, surgical wound or individuals suffering from diabetic foot and soft tissue infections, where Pseudomonas aeruginosa (P. aeruginosa) and Staphylococcus aureus (S. aureus) are the most prevalent and isolated pathogens [2, 3]. P. aeruginosa and S. aureus are frequently isolated from infected patients with cystic fibrosis (CF) [4]. The interaction between the two pathogens can affect their pathogenic behavior including triggering biofilm formation, virulence machinery and antimicrobial resistance, thus reducing the availability of treatment options during co-infections [5].
P. aeruginosa produces different virulence factors attributed to cell structure as flagellum, pilus and alginate, while others are secretory or exoenzymatic like pyocyanin, hemolysin and exotoxin [6]. In addition, it produces a wide range of extracellular proteases that help the pathogen during infection. Among them LasA, LasB elastase and alkaline protease are the most secreted under the regulation of quorum sensing (QS) [7]. Biofilm matrix formation by P. aeruginosa helps the bacterial cell withstand various environmental stresses including antibiotics and be guarded from the host immune defenses, ultimately worsen the infection state [8]. S. aureus is a significant human pathogen known for secreting a broad array of virulence factors including proteases, staphylokinase and coagulase that play important roles in its pathogenicity and antibiotic resistance. These factors help S. aureus pass through the skin and mucous membrane, leading to infection proliferation. These infections range from minor skin conditions to severe systemic diseases [9]. Furthermore, S. aureus secretes exotoxins, hemolysin, superantigens and Panton-Valentine leukocidin that facilitate immune evasion by disrupting host immune responses [9].
Healing of wounds infected with both S. aureus and P. aeruginosa takes much more time than those infected with either organism [10]. Several studies have been performed to determine whether co-infection between P. aeruginosa and S. aureus represents a transitional phase between infections caused by each pathogen alone or reflects a stable, permanent co-existence state [11]. It is important to consider the polymicrobial interactions between different microorganisms, as these interactions play significant roles in the disease’s pathogenesis and may influence the overall clinical outcomes. Identifying and analyzing these factors can greatly enhance our ability to manage and treat the disease more effectively [1]. The aim of this study was to understand the interaction (competition or co-existence) between different P. aeruginosa and S. aureus isolates and how this interaction affects P. aeruginosa resistance to different antibiotics and P. aeruginosa virulence factor production.
Methods
Bacterial strains and growth conditions
A total of 67 isolates were collected from different clinical sources. P. aeruginosa and S. aureus isolates were obtained either from different clinical samples or simultaneously from the same patient sample. Inclusion criteria involved patients with a specific infection e.g., a wound infection, pus, and diabetic foot, while exclusion criteria included start of antibiotic treatment and coinfections with other pathogens other than our target ones (P. aeruginosa and S. aureus). All specimens were obtained from different Mansoura University Hospitals and Clinics after approval from the ethical research committee, Faculty of Pharmacy, Mansoura University, following the medical research requirements in the usage, handling and care of human subjects (Ethical code:2025-97.). The standard strains P. aeruginosa PAO1 and S. aureus Newman were also included throughout the study. P. aeruginosa and S. aureus were recovered using cetrimide-supplemented agar (CA, Oxoid, Basingstoke, UK) and mannitol salt agar (MSA, Bio-life Italiana S.r.l. Milan, Italy), respectively and were further identified based on the standard microbiological recommendations [12]. All purified isolates were cryopreserved at − 80 °C as glycerol stocks (25%).
Antibiotic sensitivity pattern
The antimicrobial susceptibility of the purified P. aeruginosa and S. aureus isolates was assessed by the Kirby-Bauer disc diffusion method [13], according to Clinical Laboratory Standard Institute guidelines (CLSI, 2021) [14], where we selected a representative member for each class of antibiotic suggested by the CLSI 2021. Pure bacterial colonies of P. aeruginosa and S. aureus in Muller-Hinton broth (MHB, Oxoid, Basingstoke, UK) medium were adjusted to an equal 0.5 McFarland, followed by streaking on Muller-Hinton agar plates. Different antimicrobial discs (Oxoid, Basingstoke, UK) included; cefepime (FEP,30 µg), amoxicillin/clavulanic acid (AMC, 20/10 µg), ceftazidime (CAZ,30 µg), aztreonam (ATM, 30 µg), ciprofloxacin (CIP, 5 µg), gentamicin (CN, 10 µg) and meropenem (MEM, 10 µg) for P. aeruginosa isolates. While cefepime (FEP,30 µg), amoxicillin/clavulanic acid (AMC, 20/10 µg), gentamicin (CN, 10 µg), ciprofloxacin (CIP,5 µg), azithromycin (AZM,15 µg) and doxycycline (DO, 30 µg) were used for S. aureus isolates. After overnight incubation of the plates at 37 °C, the inhibition zones were measured and the results were interpreted according to CLSI [14].
Growth competition assay
The growth competition assay, via drop plate method, was performed to investigate how co-cultured S. aureus and P. aeruginosa, isolated from the same or different patients, co-exist or compete with each other [15]. Overnight cultures of both P. aeruginosa and S. aureus in Tryptic soy broth (TSB, Oxoid, Basingstoke, UK) were adjusted to 0.5 McFarland and further sub-cultured as co-cultures (1:1 mixed ratio) or as mono-cultures (1:1 mixed ratio with sterile TSB medium) and incubated with shaking at 37 °C for 24 h. One hundred µL were taken at 2 h intervals for 8 h, ten-fold serially diluted and streaked onto CA medium for enumeration of P. aeruginosa colonies (CA plates allow the growth of P. aeruginosa but not S. aureus). The experiment was carried out in triplicate to ensure reproducibility and the average number of colonies was obtained. Colony-forming unit (CFU) /mL on CA plates were determined for streaked mono-culture of P. aeruginosa or its co-culture with S. aureus, then the fold change (FC) in the growth of P. aeruginosa was calculated as follows: FC = CFU/mL of co-cultured P. aeruginosa / CFU/mL of mono-culture of the corresponding P. aeruginosa isolate at each time interval [4, 16]. The co-cultured mixtures showing competitive interaction were excluded from further experiments in this work.
The effect of coculturing of S. aureus and P. aeruginosa on antibiotic susceptibility of P. aeruginosa
The minimum inhibitory concentrations (MIC) of cefepime, ceftazidime, gentamicin, ciprofloxacin and meropenem were firstly determined for P. aeruginosa mono-culture in MHB via the microbroth dilution method, using a 96-well plate with an initial inoculum of 10^6^ CFU/mL [14]. MIC was determined as the lowest concentration showing no visible growth at OD_600nm_. After that, the overnight mono-cultures of either P. aeruginosa or S. aureus in MHB were adjusted to 10^6^ CFU/mL and further sub-cultured as co-culture (1:1 mixed ratio) or as mono-cultures (1:1 mixed ratio with MHB) in the presence of 0.5x MIC of the tested antibiotics. After incubation of plates at 37 °C, 5 µL of each co-culture and its corresponding mono-cultures, challenged with the 0.5x MIC of each antibiotic, were plated on CA for enumeration of P. aeruginosa colonies. The percentage of bacterial survival after antibiotic treatment was determined by dividing the number of P. aeruginosa colonies (in mono- or co-culture) after antibiotic treatment by that without antibiotic treatment. Afterwards, the fold change in P. aeruginosa survival rate was calculated as follows: FC= % of survival of co-cultured P. aeruginosa after antibiotic treatment / % survival of P. aeruginosa mono-culture after antibiotic treatment [17].
The effect of coculturing S. aureus and P. aeruginosa on virulence factors of P. aeruginosa
The impact of the co-existence of P. aeruginosa and S. aureus on the virulence of P. aeruginosa including the production of: pyocyanin, elastase, total proteases, hemolysin, lecithinase and gelatinase was examined. Individual cultures of P. aeruginosa and S. aureus were cultivated at 37 °C. The overnight cultures were adjusted to 0.5 McFarland and further sub-cultured as co-cultures (1:1 mixed ratio) or as mono-cultures (1:1 mixed ratio with sterile Luria-Bertani (LB, Oxoid, Basingstoke, UK) broth medium and incubated at 37 °C (16–18 h) followed by centrifugation. The supernatants of mono-cultures or co-cultures were stored at -80 °C, after sterile filtration with 0.22 µM filters, until further assay of the virulence factors of P. aeruginosa.
Regarding the assay of elastase and pyocyanin (produced only by P. aeruginosa), the supernatants of mono-cultures were compared with those of co-cultures. The percentage change in elastase or pyocyanin production in P. aeruginosa after co-culturing was calculated as follows: 100* Production of virulence factor of P. aeruginosa in co-culture/ Production of virulence factor of P. aeruginosa in mono-culture. On the other hand, in the case of virulence factors produced by both P. aeruginosa and S. aureus (total proteases, hemolysin, lecithinase, and gelatinase), the mixtures of supernatants of mono-cultures of both bacterial species (1:1) were compared to those of the corresponding co-cultures mixed with sterile LB medium (1:1). The percent of change in the virulence factors production in P. aeruginosa after co-culturing was calculated as follows: 100* Production of the virulence factor in co-cultured supernatant/ Production of virulence factor in supernatant mixtures of their corresponding P. aeruginosa and S. aureus mono-cultures.
For pyocyanin quantification, the supernatant was extracted with chloroform, and the organic layer containing pyocyanin was extracted with 0.2 N HCL (El-Nasr pharmaceutical chemicals Co. Cairo, Egypt), then the pink color was measured at OD_520nm_ [18].
Elastase activity was measured in the supernatant by the elastin Congo red (ECR, Sigma Aldrich, St. Louis, MO, USA) method and the developed color was measured at OD_495nm_ [19].
Measurement of total proteases was done using a skimmed milk procedure, where the increase in the proteolytic activity of the dual-culture was estimated through a decrease in OD_600nm_ absorbance reading after comparison with a negative control that comprised LB medium instead of supernatant [20].
The hemolysis activity was measured according to [21], where the supernatants were incubated with 2% RBCs suspended in hemolysin buffer for 2 h at 37 °C. LB medium and 1% SDS were used instead of the supernatant as negative and positive control, respectively. Then, the percentage of RBCs lysis was calculated as follows: 100* (OD_600nm_ of tested supernatant - negative control)/ (OD_600nm_ of positive - negative control).
Lecithinase activity was investigated in the supernatant after mixing with 10% egg yolk suspension in sterile 96-well microtiter plate, followed by incubation for 72 h at 37 °C. LB broth was used as negative control instead of bacterial supernatant. The absorbance of the white-colored solution was measured at 600 nm, where higher absorbance indicated higher lecithinase production [22].
Gelatinase production was measured using gelatin agar plates according to [23], where 5 µL of each supernatant was spotted on gelatin plates and incubated overnight at 37 °C. Afterwards, the plates were flooded with saturated ammonium sulfate solution. Gelatin hydrolysis was indicated by clear zones around the applied spots in gelatin media. Among the 14 investigated co-culture mixtures, only mixtures in which P. aeruginosa mono-cultures producing gelatinase were included in the gelatinase assay.
Quantitative biofilm formation was assessed using the polystyrene microtiter plate adsorption method [24]. Overnight mono-cultures of P. aeruginosa and S. aureus, propagated in TSB, were diluted to 0.5 McFarland and cultivated as co-culture (1:1 mixed ratio) or as mono-culture. The wells were inoculated with 200 µL of each mono-or co-cultured suspension, in addition to negative control wells that were filled with 200 µL of TSB. After incubation overnight at 37 °C, non-adherent planktonic growth was gently aspirated and rejected. The attached biofilm in each well was washed twice with sterile saline, fixed with methanol (El-Nasr pharmaceutical chemicals Co. Cairo, Egypt) (200 µL) for 20 min and stained with 1% w/v crystal violet (200 µL) for 15 min. The plates were dried after rinsing the excess crystal violet, while the adhered stained biofilm was solubilized by 33% v/v glacial acetic acid (El-Nasr pharmaceutical chemicals Co. Cairo, Egypt) (200 µL/ well).
To study the effect of the co-culture of S. aureus/ P. aeruginosa on biofilm formation by the two pathogenic bacteria, the measured OD_T_ of the solubilized biofilm in the case of co-culture mixtures or the mixture of the solubilized biofilm of the corresponding individual mono-cultures were categorized according to biofilm formation into non-adherent (OD_T_ ≤ OD_C_), weak-adherent (ODc < OD_T_≤ 2ODc), moderate-adherent (2ODc < OD_T_ ≤ 4ODc, ) and strong-adherent (4ODc < OD_T_), where OD_C,_ a cutoff value, was estimated as three standard deviations (SD) above the mean OD_570 nm_ of the negative control [25]. The percentage change in biofilm formation for co-culture in comparison with mixtures of corresponding individual mono-cultures was calculated as follows: 100* OD_T_ of the solubilized biofilm of co-culture / OD_T_ of the mixture of the solubilized biofilm of the corresponding individual mono-cultures of both bacterial species.
Real-time quantitative PCR
RT-PCR was used to measure the effect of the co-existence of S. aureus on the expression of some virulence-encoding genes in P. aeruginosa including; pelA, lasB and lasA. It should be mentioned that we performed PCR screening for 11 genes; including secretory virulence gene (lasA,* lasB*,* exoS*,* exoY*,* toxA* and PIcH), biofilm gene (pelA) and quorum sensing genes (lasI, lasR, RhIR and Rhll). However, only the lasA, lasB and pelA genes were harbored by all the investigated isolates (Data not shown). Therefore, the last genes were further adopted in the RT-PCR experiments. Individual cultures of P. aeruginosa and S. aureus were cultivated at 37 °C. The overnight cultures were adjusted to 0.5 McFarland and further incubated as co-cultures (1:1 mixed ratio) or as mono-cultures. Afterwards, 100 µL of both co-culture and corresponding P. aeruginosa mono-culture were sub-cultured separately in 10 mL LB media, incubated with shaking till the mid exponential phase (OD_600_ = 0.5–0.6) was reached [26]. Cells of mono-and co-cultures were obtained by centrifugation at 4 ℃ for 20 min at 8000 rpm and the total RNA was extracted using TRI reagent (Sigma-Aldrich, St. Louis, MO, USA) based on the manufacturer’s guidelines. DNA contamination was removed using DNase enzyme (Thermo Scientific™, Waltham, Massachusetts, USA) according to the manufacturer’s guidelines. RNA concentration was measured by NanoDrop (Wilmington, Delaware, USA). The cDNA synthesis was performed by Thermo Scientific revertAid kit (Thermo Scientific™, Waltham, Massachusetts, USA). RT-PCR was done by Hera plus sybr green master mix (HERAPLUS SYBR Green, Willowfort, Nottingham, UK) along with primers and conditions listed in Table 1 and the reaction was performed in Rotor-Gene Q thermocycler (Qiagen, Hilden, Germany). The relative expression levels of P. aeruginosa virulence genes were normalized to the expression levels of ropD housekeeping gene in accordance with the 2^−∆∆CT^ [27]. Finally, the impact of S. aureus / P. aeruginosa co-culture on gene expression (pelA, lasB and lasA) of P. aeruginosa was determined after considering the expression of each gene in P. aeruginosa mono-culture as control.
Table 1. List of primers used in this studyGenePrimer nameSequence (5′→3′)Annealing temperature(°C)Amplicon size(bp)Reference ropD
ropD FCGAACTGCTTGCCGACTT56131 [28] ropD RGCGAGAGCCTCAAGGATAC pelA
pelA FAAGAACGGATGGCTGAAGG58148 [28] pelA RTTCCTCACCTCGGTCTCG lasB
lasB FGGTAGAACGCACGGTTGT56165 [28] lasB RGGCAAGAACGACTTCCTGAT lasA
lasA FCTC GCC GTT CCT CTT CGT CT5886 [29] lasA RGCC ATC GTC ATG GGC ATT GGF or R in the primer name refers to forward and reverse primer, respectively
In vivo assay
Mice
Female BALB/c mice (Conventional), aged six to eight weeks and weighing between 19 and 20 g, were utilized in this study. BALB/c mice are well recognized for their high immunological responsiveness and sensitivity, making them one of the most widely used strains in immunological and infectious disease research. Male BALB/c mice are typically more aggressive and exhibit strong territorial behavior, which makes group housing challenging and may induce stress that interferes with immune parameters. In contrast, female BALB/c mice demonstrate greater consistency in experimental outcomes, largely attributed to differences in hormonal physiology and immune regulation mechanisms [30–32].
Mice were provided with food (standard rodent chow), water and 12-h light/dark cycles at a temperature of 22 ± 2 °C. Mice were placed in well ventilated cages for each group and monitored daily for distress or illness. Clinical assessment included fur condition, activity level, body weight and response to handling. A scoring system (0–3 scale for each parameter) was applied and humane endpoints were defined as > 20% weight loss, severe lethargy or inability to eat or drink. At the end of the experiment or upon reaching humane endpoints, mice were anesthetized with isoflurane (Universal Pharma Co, Cairo, Egypt) and euthanized by cervical dislocation to ensure rapid and humane death [33].
Determination of non-lethal dose of each bacterial species
The bacterial non-lethal dose of P. aeruginosa PAO1 and S. aureus Newman strain was determined, where different groups of mice were subjected to intranasal administration of different bacterial inocula (10^9^, 10^7^ and 10^5^ CFU) in 20 µL of phosphate buffered saline (PBS). Animals were monitored daily for survival and weight variation [34–36].
In vivo co-cultures
Six different groups of mice were used. Five mice were randomly selected to be included in each group of the experiment. After anesthesia, mice groups were subjected to single intranasal administration of 20 µL (containing non-lethal inoculum 10^5^ CFU) of each of the following; P. aeruginosa PAO1 strain only (PA group), S. aureus Newman strain only (SA group), P. aeruginosa PAO1 strain followed by intranasal administration of S. aureus Newman strain after three days (PA-SA group), S. aureus Newman strain followed by P. aeruginosa PAO1 strain after three days (SA-PA group), both P. aeruginosa PAO1 strain and S. aureus Newman strain simultaneously (PA + SA group) and the non-infected group (NI group) which received sterile PBS only. Animals were monitored for one week for survival, weight and behavior changes. After a week, lungs were aseptically collected using sterile instruments and transferred immediately into pre-weighed sterile tubes containing 1 mL of sterile PBS, followed by homogenization using sterile tissue homogenizer, and the homogenized lung suspensions were serially diluted in PBS. Such dilutions were plated on CA plates and incubated at 37 °C for 18–24 h to determine viable bacterial counts of P. aeruginosa that were expressed as colony-forming units (CFU/g tissue) [34–36].
The primary endpoint of the study was bacterial burden in target organs (expressed as CFU/g) at predefined time points post-infection. Secondary endpoints included survival up to [one week], change in body weight, clinical score, and histopathological assessment. Humane endpoints were implemented to minimize animal suffering: animals were monitored twice daily and euthanized if they met any of the following criteria — ≥20% body weight loss, severe dyspnea (use of accessory respiratory muscles or cyanosis), inability to eat/drink for > 48 h, hypothermia, severe lethargy/unresponsiveness, or any clinical score meeting or exceeding the humane threshold [37, 38]. All procedures, care and handling of the animals were performed according to the institutional and national ethical guidelines. Additionally, the study was approved by the Animal Care and Use Committee, Mansoura university (MU-ACUC (PHARM.PHD.24.05.41).
Histological evaluation
Histological evaluation was performed using single mice from each group. Lungs were collected, fixed in formalin and embedded in paraffin for histological sections (5 μm) after staining with Hematoxylin-Eosin, followed by microscopic observation [39].
Statistical analysis
Excel (Microsoft Office) was used to calculate the average and SD of each experiment, which was conducted in triplicate. Graph Pad Prism software package (version 6.01) was used for all the statistical analyses. The multiple t-test was utilized for intergroup comparisons in addition to comparisons between treated and untreated control isolates cultivated under the same circumstances. Survival experiments were analyzed using the Mantel-Cox log-rank test; with n = 5/group, while non-parametric t-test was used in the case of bioburden assays.
Results
Design of co-culture mixtures and detection of growth interaction type
A total of 29 isolates of P. aeruginosa and 38 isolates of S. aureus were obtained from different clinical sources (Table S1 supplementary material). The P. aeruginosa isolates, were given the codes; P1-29, while S. aureus were given the codes S1-38. The antibiotic resistance patterns for the P. aeruginosa and S. aureus isolates are demonstrated in Tables 2 and 3 supplementary material. The co-cultures of P. aeruginosa and S. aureus (16 mixtures) that were investigated in this study were classified into 3 categories; standard category, naturally co-isolated category (co-isolated from the same patient) and random co-cultures category (Table 2). It should be mentioned that the three naturally co-isolated mixtures were not subjected to repeated subculture to retain their original characters.
The most resistant and sensitive isolates of either P. aeruginosa or S. aureus, resistant and sensitive to most classes of antibiotics were selected for the design of co-culture categories. Such resistant isolates of P. aeruginosa included P1, P2, P6 and P7, while for S. aureus it comprised S4, S5, S6 and S7. On the other side, P3, P4 and P5 were selected as the most sensitive P. aeruginosa isolates, while S1, S2, S3 and S8 were the most sensitive S. aureus isolates (Tables S2 and S3 supplementary material).
Table 2. Design of co-cultures categories used in this studyCategoryCo-culture compositionCode of the co-culture P. aeruginosa
S. aureus StandardP. aeruginosa strain PAO1S. aureus strain NewmanPAO1/NewmanP. aeruginosa strain PAO1Randomly selected sensitive isolate (Ss2)PAO1/Ss2P. aeruginosa strain PAO1Randomly selected resistant isolate (Sr4)PAO1/Sr4Randomly selected sensitive isolate (Ps4)S. aureus strain NewmanPs4/NewmanRandomly selected resistant isolate (Pr7)S. aureus strain NewmanPr7/NewmanNatural co-isolatedP8S9P8/S9P9S10P9/S10P10S11P10/S11Random designedResistant isolate (Pr2)Sensitive isolate (Ss3)Pr2/Ss3Sensitive isolate (Ps3)Sensitive isolate (Ss3)Ps3/Ss3Resistant isolate (Pr1)Resistant isolate (Sr5)Pr1/Sr5Sensitive isolate (Ps5)Resistant isolate (Sr5)Ps5/Sr5Sensitive isolate (Ps5)Resistant isolate (Sr7)Ps5/Sr7Sensitive isolate (Ps5)Sensitive isolate (Ss8)Ps5/Ss8Resistant isolate (Pr6)Sensitive isolate (Ss1)Pr6/Ss1Resistant isolate (Pr6)Resistant isolate (Sr6)Pr6/Sr6Pr: Resistant P. aeruginosa isolate, Ps: Sensitive P. aeruginosa isolate, Sr: Resistant S. aureus isolate, Ss: Sensitive S. aureus isolate
All co-cultures exhibited co-existence interaction except Ps5/Sr7 and Ps5/Ss8 mixtures which showed antagonistic interaction. The FCs in the growth of P. aeruginosa strains after 6 and 8 h cultivation in co-cultures are demonstrated in Table 3.
Table 3FCs in the growth of P. aeruginosa co-culture after 6 and 8 h cultivationCategoryCo-culture codeFC in growth of P. aeruginosa after6 h8 hStandardPAO1/Newman6001153PAO1/Ss2500727PAO1/Sr49331800Ps4/Newman1142942Pr7/Newman727.3500Naturally co-isolatedP8/S912002200P9/S101026.31119P10/S111055.61280Random designedPr2/Ss3900980Ps3/Ss324001093Pr1/Sr5824843.7Ps5/Sr533332208Pr6/Ss18571889Pr6/Sr68572222Competitive categoryPs5/Sr70.0070.004Ps5/Ss80.0090.006
The effect of co-culture with S. aureus on P. aeruginosa antibiotic susceptibility
Most of P. aeruginosa in co-culture mixtures showed an increase in survival rate in the presence of 0.5x MIC of the investigated antibiotics. The highest significant increase in the survival rate of P. aeruginosa was obtained with meropenem in 13 co-culture mixtures (92.9%), followed by ceftazidime (12 mixtures, 85.7%), cefepime (11 mixtures, 78.6%) and gentamicin (11 mixtures, 78.6%) (Fig. 1).
The highest increase in FC of survival rates in P. aeruginosa was observed with cefepime (2.210^7^ FC, Pr1/Sr5 mixture) (Fig. 1a), followed by ciprofloxacin (518075 FC, P9/S10 mixture) (Fig. 1d) and ceftazidime (110^5^ FC, Pr7/Newman mixture) (Fig. 1b).
Fig. 1. Fold change of survival rates of P. aeruginosa in co-cultures in presence of 0.5x MIC of antibiotics. a Cefepime, b Ceftazidime, c Gentamicin, d Ciprofloxacin and e Meropenem. * P < 0.05, ** P < 0.01, ***P < 0.005, ****P < 0.001, *****P < 0.0005 and ****** P < 0.0001
The effect of co-culture with S. aureus on P. aeruginosa virulence factors production
A significant increase in pyocyanin production of P. aeruginosa was observed in ten co-culture mixtures (71.4%, p = 0.008) compared to pyocyanin production in their corresponding mono-culture of P. aeruginosa, where the Pr6/Ss1 mixture was the highest in increasing pyocyanin production (260%), while only the mixture P10/S11 demonstrate a significant decrease in pyocyanin production (Fig. 2a).
Regarding elastase production, a significant increase in elastase production was obtained in ten co-culture mixtures (71.4%, p = 0.036) including all the naturally co-isolated ones, compared to elastase production by P. aeruginosa mono-culture, the mixture P10/S11 was the highest in increasing elastase production by 200% (Fig. 2b), while only Pr2/Ss3 showed significant decrease in elastase production.
Concerning proteolytic activities, a significant increase was produced by 11 co-culture mixtures (78.6%, p = 0.007) including all naturally co-isolated ones, compared to their controls, where the mixtures P10/S11, Ps4/ Newman and Ps3/Ss3 were the highest for increasing proteolytic activities by 300, 297% and 273.3%, respectively. On the other hand, the two mixtures PAO1/Sr4 and Pr6/Ss1 showed a decrease in proteolytic activities (Fig. 2c).
A significant increase in hemolysin production was observed in ten co-culture mixtures (71.4%), including all the standard ones. The randomly designed mixture, Ps3/Ss3 was the highest in increasing hemolysin production by 588% (Fig. 2d).
Regarding lecithinase production, a significant increase was produced among 11 co-culture mixtures (78.6%, p < 0.0002), including all standard and randomly designed ones. The standard mixtures, PAO1/ Newman, Ps4/ Newman and PAO1/Ss2 were the highest to increase lecithinase activities by 191%, 163.6% and 148%, respectively. No significant increase was demonstrated among the three natural co-isolated mixtures (Fig. 2e).
For gelatinase production activities, the three co-culture mixtures; Ps3/Ss3, Pr6/Ss1 and Pr6/Sr6 were not investigated because P. aeruginosa isolates in these mixtures do not produce gelatinase. Among 11 investigated co-culture mixtures, only 7 mixtures (63.7%) demonstrated an increase in gelatinase production. The PAO1/Newman mixture was the highest in increasing gelatinase production activities by 126.7% (Fig. 2f).
Fig. 2. Effect of S. aureus co-culture on virulence factors’ production in P. aeruginosa. a Pyocyanin, b Elastase, c Protease, d Hemolysin, e Lecithinase, f Gelatinase. The SD of the three independent experiments is illustrated by error bars. * P < 0.05, ** P < 0.01, ***P < 0.005, ****P < 0.001 and ****** P < 0.0001
Pertaining biofilm formation by P. aeruginosa, a significant increase was produced by ten of co-culture mixtures (71.4%, p = 0.006), where the P8/S9, the naturally co-isolated mixture, was the highest biofilm-forming mixture (522%) (Fig. 3a).
Among the five standard mixtures, four co-cultures (80%) turned to be moderate biofilm producers, whereas their mixtures of corresponding individual mono-cultures were weak biofilm and non-biofilm producers (Fig. 3b). Additionally, two mixtures of the naturally co-isolated ones (66.7%), P8/S9 and P10/S11, demonstrated moderate biofilm production compared to their mixtures of corresponding individual mono-cultures that were non-biofilm producers. Furthermore, Ps5/Sr5 and Pr6/Ss1, the two random selected mixtures, turned to produce strong biofilm adhering activity, where their mixtures of corresponding individual mono-cultures were classified as moderate-adherent (Fig. 3b) (Table S4 supplementary material).
Fig. 3. Effect of S. aureus co-culture on biofilm production in P. aeruginosa. (a) Percent of change in biofilm formation after co-culture, (b) Percent of mixtures exhibiting different biofilm categories. SD of the three independent experiments is illustrated by error bars (* P < 0.05, ** P < 0.01, ***P < 0.005, ****P < 0.001 and *****P < 0.0005)
RT-PCR analysis
According to the 2^−∆∆CT^ analysis method, the expression level of pelA, lasB and lasA virulence genes in either P. aeruginosa mono-cultures or those co-cultured was quantified and further relatively normalized to the expression level of ropD housekeeping gene expressed in the same mono-or co-culture. This normalized value of each tested gene expression in co-culture relative to mono-culture was used to obtain the fold change.
The data revealed that pelA was significantly up-regulated in 13 mixtures (92.9%, p = 0.01), including all the standard and naturally co-isolated mixtures. Tremendous increase (p < 0.0001) in pelA expression was shown in two natural co-isolated mixtures (P8/S9 and P10/S11) and two random mixtures (Pr1/Sr5 and Ps5/Sr5) by 96-, 91-, 95- and 92-fold, respectively, compared to their corresponding P. aeruginosa mono-culture. While, pelA expression was significantly (p < 0.05) down-regulated by 22% in only the random Pr6/Sr6 mixture, compared to Pr6 isolate (Fig. 4a).
Regarding lasB gene, it was significantly up-regulated among all the co-culture mixtures, but with varying degree (p = 0.001, Fig. 4b). Compared to P. aeruginosa mono-culture, the fold change in lasB expression started from a slight increase (by 1.5–4.5-fold) in PAO1/Sr4, Pr7/Newman, Pr1/Sr5, Ps5/Sr5 and Pr6/Sr6 till very noticeable increase (by > 50–91-fold) in PAO1/Ss2, Ps4/Newman, P10/S11, Ps3/Ss3 and Pr6/Ss1 (p < 0.0001).
Additionally, lasA gene was significantly up-regulated in 13 co-culture mixtures (92.9%, p = 0.03), since the highest relative expression was in random mixtures, Ps3/Ss3 and Ps5/Sr5, by 80- and 71-fold, respectively. A slight increase (18%), with no significant difference, in lasA expression was observed in only Pr6/Sr1 mixture, comparing with P. aeruginosa mono-culture (Fig. 4c).
Fig. 4. Effect of S. aureus co-culture on relative expression of virulence genes in P. aeruginosa. a Relative pelA expression, b Relative lasB expression, c Relative lasA expression. SD of the three independent experiments is illustrated by error bars (* P < 0.05, ** P < 0.01, ***P < 0.005, ****P < 0.001, *****P < 0.0005 and ****** P < 0.0001)
In vivo assay
Determination of non-lethal dose of each bacterial species
The inoculum 10^9^ CFU/ mL cause death within 24 h for all mice in the investigated group, while the inoculum 10^7^ CFU/ mL affected the mice severely causing the mice to stop eating, leading to severe weight loss, followed by mice death after 48 h. The 10^5^ CFU/ mL inoculum was associated with clinical signs consistent with systemic infection and respiratory distress, but the mice recovered from the symptoms after 3 days of infection. Therefore, the inoculum 10^5^ CFU/ mL was selected in further experiments.
Co-infection with S. aureus Newman strain increased morbidity and mortality in P. aeruginosa PAO1 strain-infected mice
By tracking mice death, it was found that S. aureus Newman strain increased the death in mice groups that were co-infected by P. aeruginosa PAO1 and S. aureus Newman strains, where three dead mice were found in the PA + SA group by the second day of infection. PA-SA group and SA-PA group have the same rate of mortality (40%); however, the SA-PA group was associated with an earlier mortality rate at the second day in comparison with the PA-SA group that was at the third day. On the other side, all mice of control groups PA, SA and NI were still alive till the end of the experiment (Fig. 5a).
Regarding P. aeruginosa PAO1 strain burdens in the lung of the mice that were still alive after the 7 days of the experiment, we observed that, mice that were co-infected by P. aeruginosa PAO1 strain and S. aureus Newman strain simultaneously did not significantly affect the P. aeruginosa PAO1 strain count in the investigated lungs in comparison with the PA group. On the other side, pre-infection with S. aureus Newman strain, in SA-PA group, significantly increased P. aeruginosa PAO1 burdens in lungs of the investigated mice (P < 0.05, Fig. 5b).
Fig. 5. Survival rates and bacterial counts in lungs of mice models after co-infection with P. aeruginosa PAO1 and S. aureus Newman strains. a Cumulative survival rate of different mice groups and b P. aeruginosa PAO1 strain burdens in lungs of infected mice groups. Dots represent CFU in the lung of individual mice, and horizontal lines represent median values. PA and SA group: Means mice got infection with P. aeruginosa PAO1 strain and S. aureus Newman strain, respectively, NI group: non-infected mice that got sterile PBS only, PA-SA group: Mice infected with P. aeruginosa PAO1 strain followed S. aureus Newman strain three days a part, SA-PA group: Mice infected with S. aureus Newman strain followed by P. aeruginosa PAO1 strain three days apart, PA + SA group: Mice infected with P. aeruginosa PAO1 strain and S. aureus Newman strain simultaneously (* P < 0.05)
S. aureus Newman increased the inflammation in the lung of P. aeruginosa PAO1-infected mice
The histology of the lungs was evaluated after 7 days of infection by either single or both bacteria species. Unfortunately, due to the unexpected mortality of most experimental animals before tissue collection, histology could only be conducted on one representative mouse. It should be mentioned that, the purpose of histology was for qualitative supportive observation rather than a quantitative comparison. Microscopic pictures of Hematoxylin-eosin-stained lungs sections showed no structural damage, inflammation or congestion in control groups PA, SA and NI. The SA-PA group showed the most obvious change, where severe perivascular and peribronchiolar inflammation mainly neutrophils infiltration, marked thickening of alveolar wall, congestion, alveolar emphysema and collapse were observed (Fig. 6). On the other side, PA-SA and PA + SA groups showed mild histological pattern (Fig. 6).
Fig. 6. Microscopic pictures of Hematoxylin-eosin-stained lungs sections of different groups of mice. PA and SA group: Means mice got infection with P. aeruginosa PAO1 strain and S. aureus Newman strain, respectively, NI group: Non-infected mice that got sterile PBS only, PA-SA group: Mice infected with P. aeruginosa PAO1 strain followed S. aureus Newman strain three days a part, SA-PA group: Mice infected with S. aureus Newman strain followed by P. aeruginosa PAO1 strain three days apart, PA + SA group: Mice infected with P. aeruginosa PAO1 strain and S. aureus Newman strain simultaneously. Red arrows: lung congestion, blue arrow: alveolar emphysema, thin black arrow: perivascular and peribronchiolar inflammation and (*): alveolar collapse (narrowing of the alveolar lumen)
Discussion
Different studies have reported that polymicrobial infections produce severe infections than single ones [11]. Several studies have shown that S. aureus/P. aeruginosa co-infections are one of the most common polymicrobial infections [4, 11, 40, 41]. Most of these studies, have illustrated the impact of P. aeruginosa on S. aureus antibiotic resistance and pathogenicity [4, 11, 40]. The main aim of this study was to investigate the impact of co-cultures of P. aeruginosa and S. aureus on antibiotic resistance, virulence and biofilm formation in P. aeruginosa.
Initially, 16 co-culture mixtures of S. aureus/P. aeruginosa were designed (Table 2). These mixtures were examined, via growth competition assay, for the type growth interaction (co-existence or competition). The competition assay showed that 14 mixtures of S. aureus/P. aeruginosa were able to co-exist. These mixtures were further used in this work to investigate the impact of S. aureus/P. aeruginosa on antibiotic resistance and virulence of P. aeruginosa.
It has been shown that different stages of growth and environmental conditions, including media and planktonic versus biofilm modes of growth, can promote the synergistic interaction of P. aeruginosa and S. aureus [42, 43]. The Ps5/Sr7 and Ps5/Ss8 mixtures showed a competitive type of interaction. This may be a result of the secretion of proteinaceous toxins through the S. aureus type VII secretion system (T7SS) that inhibit the growth of other bacterial specie [44]. It was also reported that S. aureus can bio-transform pyochelin, a siderophore produced by P. aeruginosa, thereby reducing its availability and hindering P. aeruginosa iron acquisition [45].
Several reports have highlighted that the presence of two or more species alters the susceptibility of individual bacterial species through different mechanisms including; physiological or transcriptional alterations, or a combination of both [24, 46]. Our results revealed that, P. aeruginosa resistance to cefepime, ceftazidime, gentamicin, ciprofloxacin and meropenem antibiotics increased by 78.6%, 85.7%, 78.6%, 71.4% and 92.9%, respectively in co-culture mixtures compared to P. aeruginosa mono-cultures (Fig. 1). It was reported that P. aeruginosa resistance in co-culture with S. aureus is attributed to interaction between S. aureus protein A (SpA) and P. aeruginosa Psl [40, 47]. Interestingly, all the naturally co-isolated mixtures showed a significant increase in the survival rate of P. aeruginosa in co-culture except for the mixture P8/S9 in the case of cefepime antibiotic.
Co-culture of P. aeruginosa/S. aureus was reported to affect the expression of virulence encoding genes in P. aeruginosa [48]. Our results revealed that the production of all the examined virulence factors increased significantly in most of the P. aeruginosa isolates in the investigated co-cultures except for gelatinase production (which only increased in 3 co-cultures mixtures) (Fig. 2). Interestingly, the PAO1/Newman co-culture mixture was associated with significant increase in all of the considered virulence factors of P. aeruginosa PAO1 strain. Moreover, all the natural co-isolated mixtures showed significant increase in the production of elastase and protease for P. aeruginosa strains. Supporting our results, several studies have reported that in polymicrobial infections, S. aureus increases the virulence factors (pyocyanin, pyoverdine, alginate and biofilm) of P. aeruginosa [40, 41, 49, 50]. On the other side, previous study showed a significant inhibitory effect of S. aureus on P. aeruginosa virulence factors (phenazine and pyochelin) in the case of co-culture [51].
Our study demonstrated that, the biofilm-forming abilities were enhanced after co-culture of S. aureus/ P. aeruginosa, in comparison with the cumulative forming ability of their individual mono-cultures, in 9 mixtures, while 4 mixtures were not changed and one mixture was shifted to a lower category of biofilm formation (Table S4 Supplementary material). Interestingly, the two naturally co-isolated mixtures; P8/S9 and P10/S11 showed the highest increase in biofilm formation by 522% and 480%, respectively (Fig. 3a). It was reported that cultivation of both bacteria leads to the formation of a more rigid biofilm, where S. aureus is located mainly in the upper layers, while P. aeruginosa can be found mostly in the lower layers of the biofilm [15]. Additionally, it was indicated that cultivation of P. aeruginosa with S. aureus produced a more rapid biofilm through the formation of large bacterial aggregates that exceeded the amount in mono-culture biofilm, illustrating the high biofilm formation activity among the naturally co-existed mixtures [5].
Co-culture of P. aeruginosa and S. aureus increased the expression of P. aeruginosa virulence encoding genes, where 92.9%, 100% and 92.9% of the co-culture mixtures significantly up-regulated pelA, lasB and lasA genes, respectively compared to their corresponding P. aeruginosa mono-cultures (Fig. 4). Up-regulation of virulence genes in P. aeruginosa may be a result of an adaptive strategy that P. aeruginosa uses to enhance its competitive ability against S. aureus, where the elevated gene expressions promote aggressive behaviors, such as increase protease or biofilm producing activities that enable P. aeruginosa to lyse competing bacteria and access essential nutrients like iron [41].
Previous studies have demonstrated that microorganisms modulate their gene expression and lifestyle to adapt to competitive niches. For instance, it was reported that in most co-culture conditions the QS systems of P. aeruginosa specifically the lasI/lasR operon and its dependent virulence factors including; lasA, lasB and biofilm-associated genes, were significantly up-regulated with the exception of one mixture [41]. On the other hand, the anti-staphylococcal product (LasA protease) was not up-regulated under their experimental conditions in P. aeruginosa [51].
To mimic the co-infection of P. aeruginosa/ S. aureus in human we performed in vivo studies in animal to study the effect of co-infection of both bacteria species on the pathogenicity of P. aeruginosa. Our results revealed that co-infecting with P. aeruginosa PAO1 and S. aureus Newman simultaneously has the highest rate of mortality. Infecting the mice with the two bacteria species three days a part leads to the same rate of mortality, however infection with S. aureus first, then P. aeruginosa accelerates mice death in comparison with the PA-SA group (Fig. 5a). Several animal models have been proposed for studying S. aureus or P. aeruginosa pathogenicity [52]. Moreover, previous studies reported that the success of S. aureus colonization during co-infection was correlated with the extent of P. aeruginosa colonization in the lungs, irrespective of the interaction type between the two pathogens [35]. On the other hand, it was demonstrated that, pre-infection with S. aureus decreased the mortality rate caused by P. aeruginosa, where P. aeruginosa and S. aureus co-existed in the mouse lungs without interfering with each other [34].
Regarding histological examination of the lung, our results revealed that mice groups that were infected by either one of the two pathogens showed no inflammation. The SA-PA group showed the most severe perivascular and peribronchiolar inflammation. Moreover, both PA-SA and PA + SA groups were associated with mild inflammation in the lung (Fig. 6). Our results were in agreement with that previously reported, where S. aureus pre-colonization represented a risk factor for initial P. aeruginosa airway infection [34].
Conclusions
The study emphasizes the significant impact of the co-existence of S. aureus/ P. aeruginosa on P. aeruginosa antibiotic resistance and virulence production. Co-culturing with S. aureus led to an increase in P. aeruginosa resistance to multiple antimicrobial classes, such as cefepime, ceftazidime, gentamicin, ciprofloxacin and meropenem. Moreover, there was a notable increase in the production of key virulence factors, including pyocyanin, elastase, protease, hemolysin, lecithinase, gelatinase, and biofilm formation. Moreover, gene expression analysis confirmed the up-regulation of virulence-related genes (pelA, lasB, and lasA) in co-cultured isolates. The in vivo mouse infection model supported these findings, showing higher mortality rate, increase in bacterial loads in the lungs, and heightened lung inflammation in co-infected groups. These findings underscore the potential for interspecies interactions to enhance P. aeruginosa pathogenicity and antibiotic resistance, underscoring the clinical importance of polymicrobial infections and the necessity of considering microbial co-existence in antimicrobial therapy strategies.
Supplementary Information
Below is the link to the electronic supplementary material.
Supplementary Material 1
The reference list from the paper itself. Each links out to its DOI / PubMed record.
- 1Anju VT, Busi S, Imchen M, Kumavath R, Mohan MS, Salim SA et al. Polymicrobial infections and biofilms: clinical significance and eradication strategies. Antibiot (Basel). 2022;11(12):1731. 10.3390/antibiotics 11121731} 10.3390/antibiotics 11121731 PMC 977482136551388 · doi ↗ · pubmed ↗
- 2Nickol ME, Ciric J, Falcinelli SD, Chertow DS, Kindrachuk J. Characterization of host and bacterial contributions to lung barrier dysfunction following co-infection with 2009 pandemic influenza and methicillin resistant Staphylococcus aureus. Viruses. 2019;11(2):116. 10.3390/v 11020116} 10.3390/v 11020116 PMC 640999930699912 · doi ↗ · pubmed ↗
- 3Jurado-Martín I, Sainz-Mejías M, Mc Clean S. Pseudomonas aeruginosa: an audacious pathogen with an adaptable arsenal of virulence factors. Int J Mol Sci. 2021;22(6):3128. } 10.3390/ijms 22063128} 10.3390/ijms 22063128 PMC 800326633803907 · doi ↗ · pubmed ↗
- 4Sharma S, Mohler J, Mahajan SD, Schwartz SA, Bruggemann L, Aalinkeel R. Microbial biofilm: a review on formation, infection, antibiotic resistance, control measures, and innovative treatment. Microorganisms. 2023;11(6):1614. 10.3390/microorganisms 11061614} 10.3390/microorganisms 11061614 PMC 1030540737375116 · doi ↗ · pubmed ↗
- 5Ezeador C, Ejikeugwu C, Ushie S, Agbakoba N, Isolation. Identification and prevalence of Pseudomonas aeruginosa isolates from clinical and environmental sources in Onitsha Metropolis, Anambra state. Eur J Med Health Sci. 2020;2(2). } 10.24018/ejmed.2020.2.2.188}
- 6Limoli DH, Whitfield GB, Kitao T, Ivey ML, Davis MR Jr., Grahl N et al. Pseudomonas aeruginosa alginate overproduction promotes coexistence with Staphylococcus aureus in a model of cystic fibrosis respiratory infection. m Bio. 2017;8(2):e 00186-17. 10.1128/m Bio.00186-17} 10.1128/m Bio.00186-17PMC 536203228325763 · doi ↗ · pubmed ↗
- 7Alonaizan R, Woods S, Hargrave KE, Roberts CW. An exaggerated immune response in female BALB/c mice controls initial Toxoplasma gondii multiplication but increases mortality and morbidity relative to male mice. Pathogens. 2021;10(9):1154. 10.3390/pathogens 10091154} 10.3390/pathogens 10091154 PMC 847093334578186 · doi ↗ · pubmed ↗
- 8Armbruster CR, Wolter DJ, Mishra M, Hayden HS, Radey MC, Merrihew G et al. Staphylococcus aureus protein A mediates interspecies interactions at the cell surface of Pseudomonas aeruginosa. m Bio. 2016;7(3):e 00538-16. 10.1128/m Bio.00538-16} 10.1128/m Bio.00538-16PMC 489510727222468 · doi ↗ · pubmed ↗