Geographical Variation in SARS-CoV-2 Transmission Potential in Massachusetts
Ina Sze-Ting Lee, Xinyi Hua, Jing Xiong Kersey, Kayoko Shioda, Gerardo Chowell, Isaac Chun-Hai Fung

TL;DR
This study analyzed how SARS-CoV-2 spread differently across regions in Massachusetts from 2020 to 2022 and how nonpharmaceutical interventions affected transmission.
Contribution
The study provides new insights into the regional effectiveness of early nonpharmaceutical interventions on SARS-CoV-2 transmission in Massachusetts.
Findings
School closures and gathering restrictions in 2020 reduced the reproduction number (Rt) by 14.7% statewide.
High-density areas like Boston saw a 16.9% reduction in Rt due to these interventions.
Other NPIs like mask mandates and curfews did not significantly impact Rt.
Abstract
Background/Objectives: This ecological study aimed to investigate changes in the time-varying reproduction number (Rt) of SARS-CoV-2 across six regions of Massachusetts from 2020 to 2022 and to evaluate the impact of various nonpharmaceutical interventions (NPIs) implemented in 2020 by examining associated changes in the Rt. Methods: COVID-19 incident case data from the Johns Hopkins University database were adjusted for reporting delays using deconvolution and for underreporting via a Poisson-distributed multiplier of 4. Negative and zero counts were corrected using imputation. Rt was estimated using R package EpiEstim (Version 2.2-4) with a 7-day sliding window from 2020 to 2022 and with non-overlapping time windows between policy changes in 2020. Results: From 2020 to 2022, Massachusetts experienced five COVID-19 surges, linked to the wild-type strain and emerging variants, with Rt…
Genes, proteins, chemicals, diseases, species, mutations and cell lines named across the full text — each resolved to its canonical identifier and authoritative record.
Click any figure to enlarge with its caption.
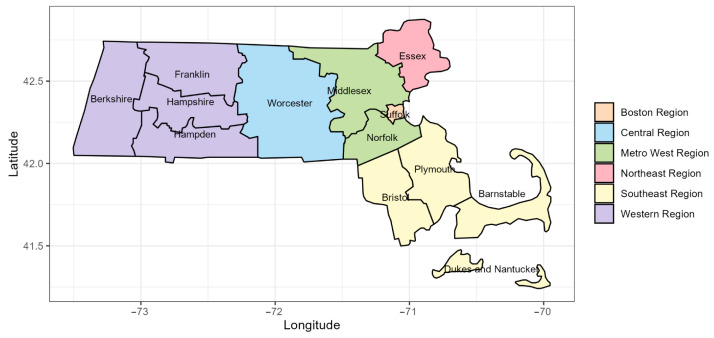 Figure 1
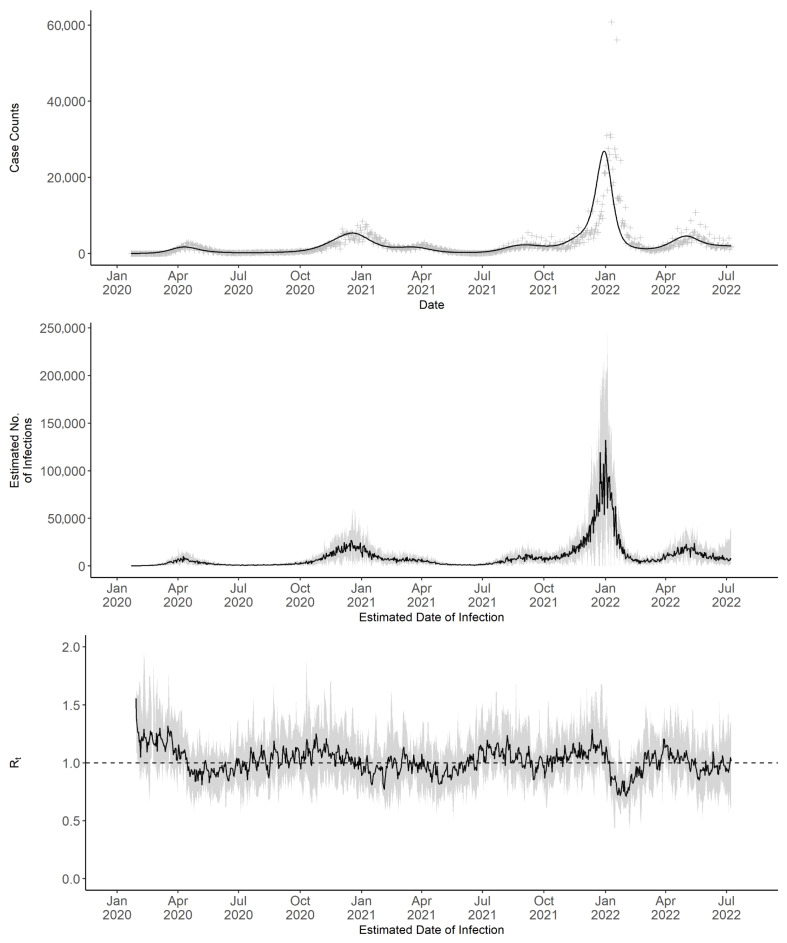 Figure 2
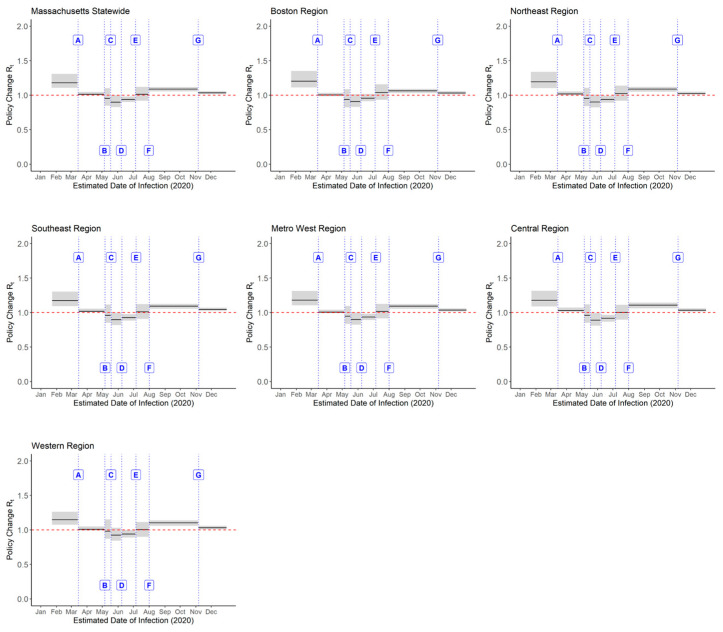 Figure 3
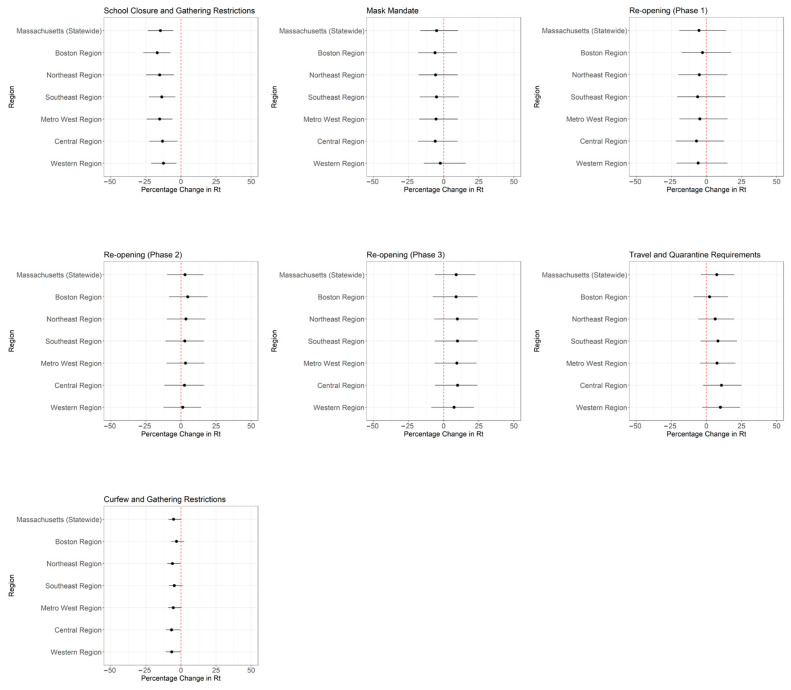 Figure 4
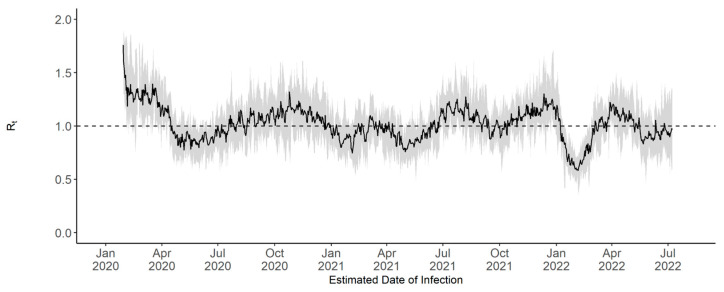 Figure 5
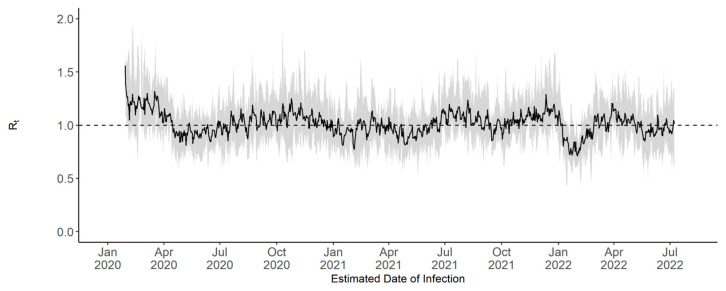 Figure 6
 Figure 7
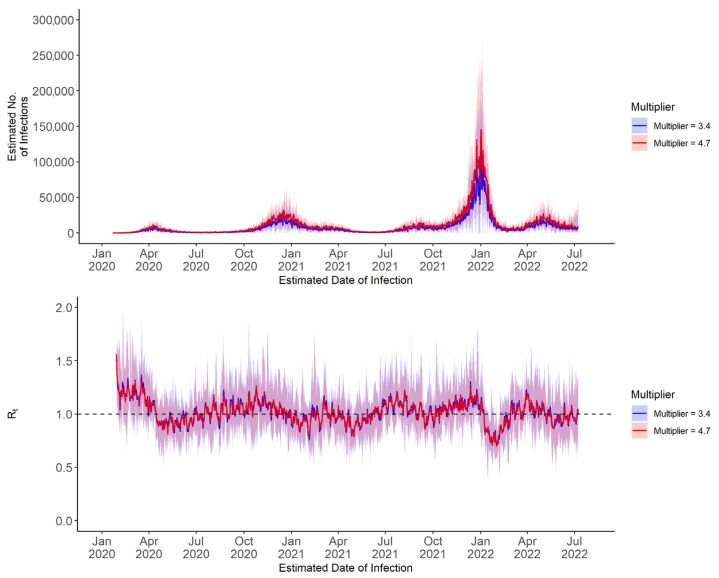 Figure 8
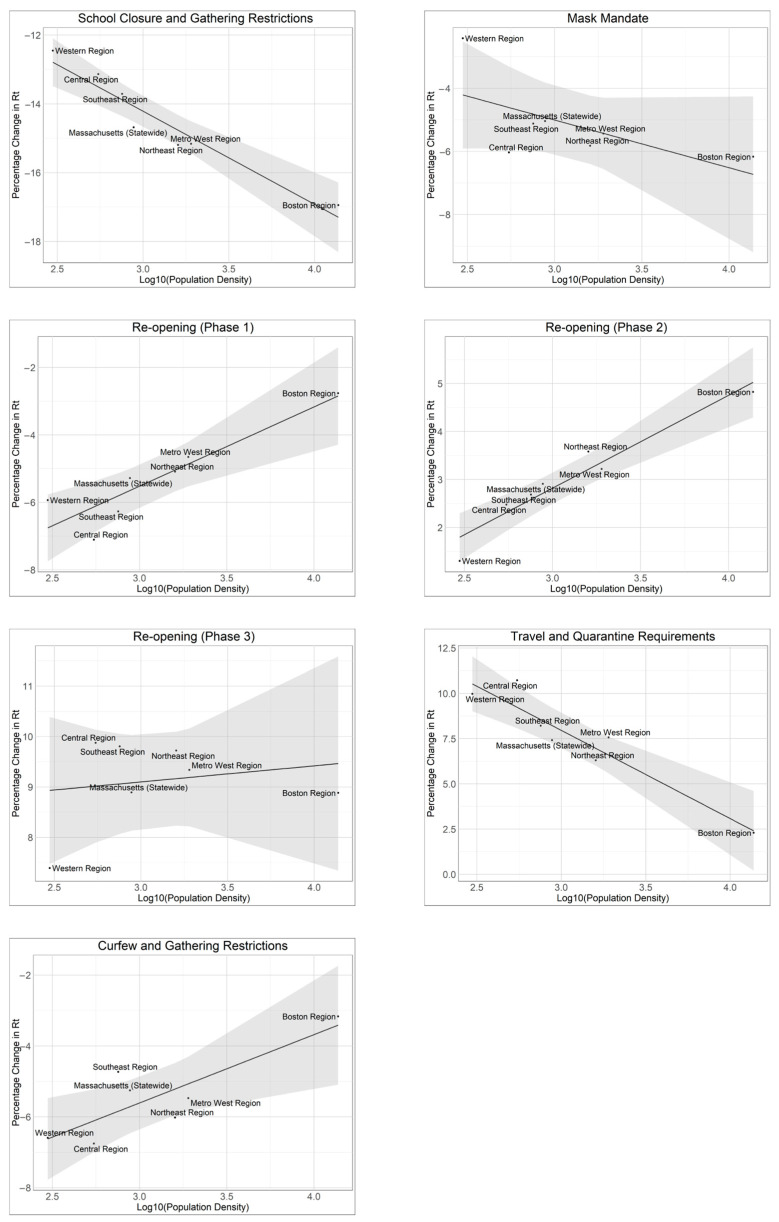 Figure 9
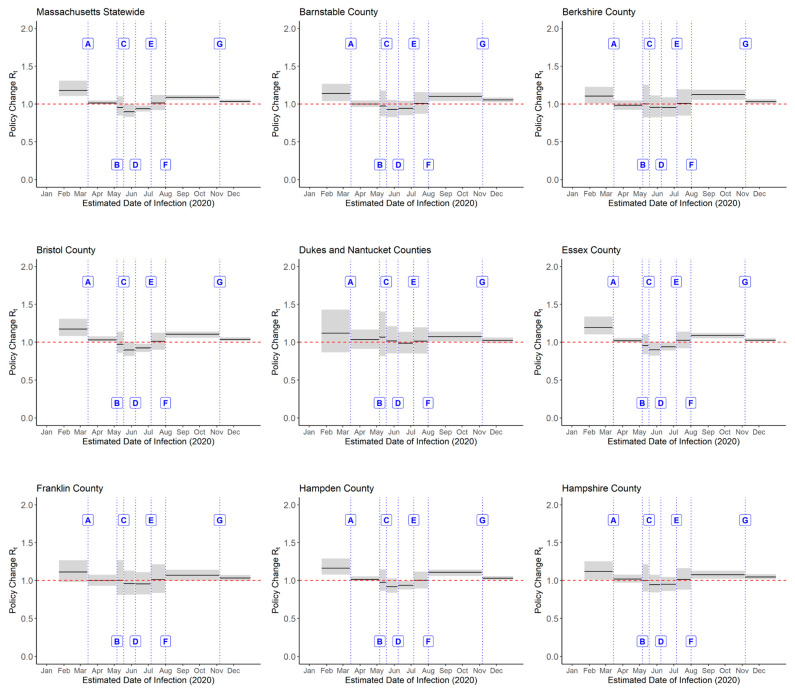 Figure 10
 Figure 11
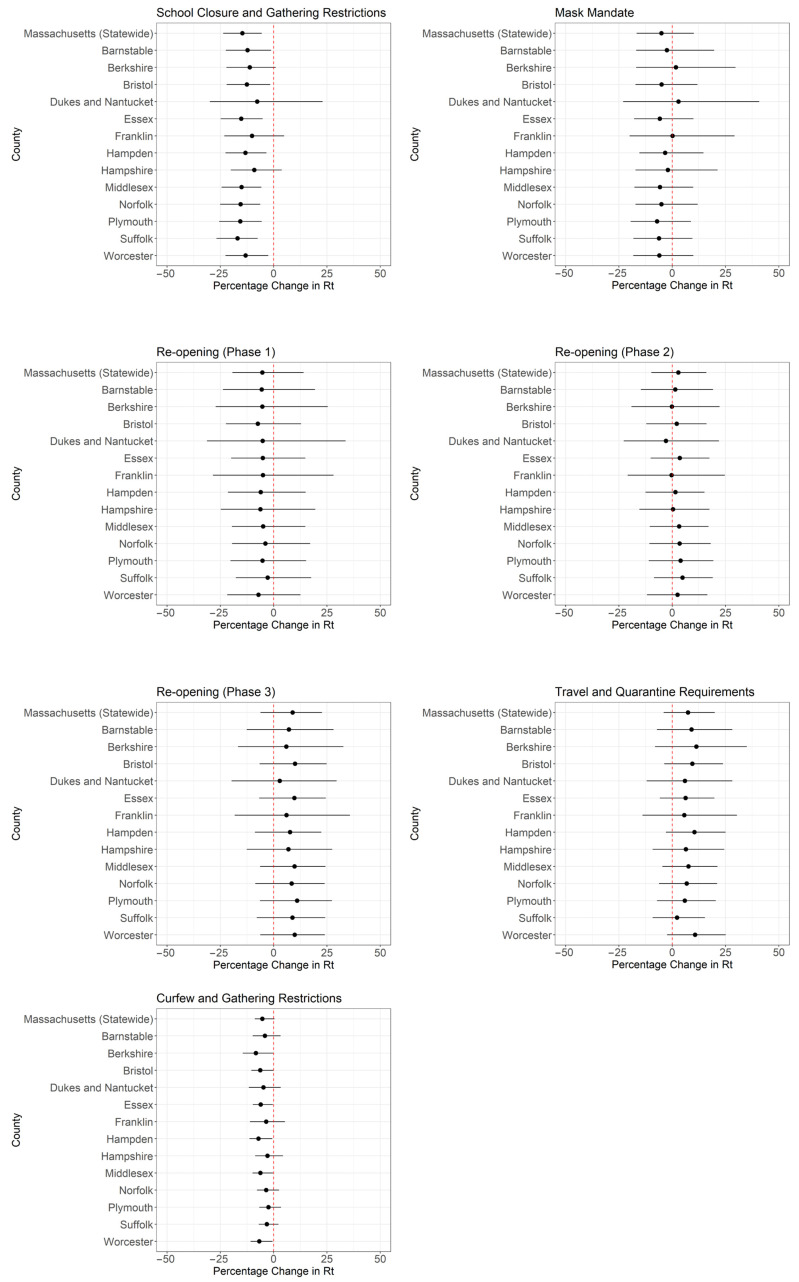 Figure 12
Peer Reviews
No public reviews on file for this paper yet. If you reviewed it on a platform where reviews are public (OpenReview, ICLR, NeurIPS, ICML), you can paste yours below so the community can read it here.
Videos
No videos yet. Explain this paper in a talk, walkthrough, or lecture? Add one.
Taxonomy
TopicsCOVID-19 epidemiological studies · SARS-CoV-2 detection and testing · SARS-CoV-2 and COVID-19 Research
1. Introduction
Severe acute respiratory syndrome coronavirus 2 (SARS-CoV-2) emerged as a global health crisis, prompting widespread public health interventions to reduce transmission. Massachusetts serves as a valuable case study for understanding pandemic dynamics due to its robust healthcare infrastructure, which facilitates in-depth analysis of coronavirus disease 2019 (COVID-19) transmission and epidemiological patterns. The state’s top-ranked healthcare access and favorable social determinants of health provide important context for examining viral spread and control [1], particularly in relation to non-pharmaceutical interventions (NPIs) and healthcare resource utilization. Additionally, Massachusetts was the site of one of the earliest major clusters, linked to a superspreading event at an international business conference in Boston [2], highlighting the complexities of early outbreak dynamics.
The time-varying reproduction number (Rt) represents the expected number of secondary cases generated by an infected individual at a given time [3]. When Rt > 1, an epidemic grows; when Rt < 1, an epidemic subsides. As Rt is relatively simple to understand, it serves as a critical metric for assessing disease transmission dynamics over time. Rt is influenced by both pathogen-specific characteristics and external factors such as human mobility, population immunity, public compliance with interventions, and healthcare accessibility [3]. Monitoring Rt enables the evaluation of NPIs, informs epidemic modeling, and facilitates the strategic adaptation of response measures during outbreaks. Our prior research has investigated the temporal variation in the Rt of COVID-19 transmission at the state and/or sub-state levels in parts of the United States [4,5,6,7,8,9,10,11,12]. Here, we extended our research to the state of Massachusetts.
This study examines the transmission dynamics of SARS-CoV-2 in Massachusetts, with the following objectives: (1) to analyze variation in SARS-CoV-2 transmission across the six regions of Massachusetts from January 2020 to July 2022; and (2) to evaluate the association between NPIs and Rt in these regions in 2020 (with a county-level sensitivity analysis). This study aims to provide insights into the differential impact of the pandemic across the state.
2. Materials and Methods
2.1. Data Acquisition
Data were obtained from the COVID-19 Unified Dataset compiled by Johns Hopkins University Center for Systems Science and Engineering, available through their GitHub repository ‘CSSEGISandData’ [13,14]. This dataset includes daily confirmed incident case counts, defined as positive polymerase chain reaction (PCR) test results, reported at the state and county levels from 22 January 2020 to 9 March 2023. County-level population data were sourced from the American Community Survey conducted by the United States Census Bureau [15,16]. In addition, a review of the Governor’s Orders issued by the Commonwealth of Massachusetts was conducted to document the timing of NPI implementations and subsequent relaxations (Table A1).
2.2. Statistical Analysis
2.2.1. Unit of Analysis
In this study, the 14 counties of Massachusetts were grouped into six regions based on county boundaries. Specifically, the Boston region includes Suffolk County; the Central region includes Worcester County; the Metro West region includes Middlesex and Norfolk counties; the Northeast region includes Essex County; the Southeast region includes Barnstable, Bristol, Dukes, Nantucket, and Plymouth counties; and the Western region includes Berkshire, Franklin, Hampden, and Hampshire counties (Figure 1).
To assess whether regional aggregation obscured within-region heterogeneity in transmission dynamics or policy impacts, we conducted a county-level sensitivity analysis. All steps from the previous sections were repeated using individual counties as the unit of analysis (13 in total, with Dukes and Nantucket aggregated in the original dataset). County-level Rt estimates and percentage changes across policy periods were then compared with region-level results to evaluate robustness.
2.2.2. Data Cleaning, Deconvolution and Multiplier
To estimate Rt, negative incident case counts were first corrected. In addition, adjustments were made to the weekend effect, in which no cases are reported on weekends, to reduce artificial spikes in Rt. Negative values were identified and imputed using a local average of data points from three days before to three days after the corresponding date, resulting in a total imputation window of seven days. Zero values reported during weekends and holidays were imputed using the same method. For data preceding 6 March 2020, which was chosen to align with the beginning of significant COVID-19 case reporting in Massachusetts, zero case counts were not imputed in order to preserve the original data. Imputation near the end of the dataset was performed by averaging available surrounding values, accounting for boundary conditions. These methods were consistently applied to county-level data from all counties in Massachusetts, ensuring uniform corrections and enabling reliable analysis of infection trends and Rt estimation.
Using the R package incidental [17], deconvolution was performed on the observed incident case count data to estimate the date of infection by adjusting for the delay between infection and case reporting. This adjustment used the package’s default distribution for COVID-19, which is based on a Florida dataset from 2020 [17]. The incidental package employs an empirical Bayes method to fit a regularized likelihood model on a spline basis, thereby removing noise and smoothing the deconvoluted incident case count curve. In the incidental package, the parameter dof_grid specifies an integer vector of degrees of freedom for the spline basis used in the deconvolution model. We expanded the default range to include values from 6 to 40 in increments of 2, to increase flexibility in model fitting and explore sensitivity to different spline configurations. To estimate daily infection counts, 1000 deconvoluted time series of incident cases were generated. A Poisson-distributed multiplier of 4 was then applied to each time series to account for underreporting of asymptomatic and mildly symptomatic infections [6,18], producing a total of 10,000 time series of estimated daily incident infection counts. The median and 95% credible interval (CrI) were then derived from these 10,000 time series. Additional sensitivity analyses were performed using multipliers of 3.4 and 4.7, corresponding to the United States CDC’s estimated lower and upper bounds for the number of infections per reported case [19].
2.2.3. Rt Estimation
Rt was estimated from the daily incident infection counts using the instantaneous reproduction number method proposed by Cori et al. [3], implemented using the R package EpiEstim. Rt is defined as the ratio of the number of new cases at a given time to the total infectiousness of infected individuals at that time. An Rt value greater than 1 indicates that the infection is spreading, while a value less than 1 indicates a decline in transmission.
In EpiEstim, the prior distribution for the reproduction number Rt is specified using two parameters: mean_prior, which defines the mean of the prior distribution, and std_prior, which defines its standard deviation. The default values for both are 5. For this analysis, we adopted more conservative assumptions by setting mean_prior = 2 and std_prior = 2. These adjustments were incorporated into the estimation of Rt across each time window corresponding to the implementation or relaxation of NPIs in Massachusetts.
The 7-day sliding window Rt analysis covered the period from 22 January 2020, which marks the first date in the COVID-19 Unified Dataset, to 8 July 2022, the final day before Massachusetts transitioned from daily to weekly COVID-19 reporting. For the main analysis, Omicron-specific serial interval parameters were used, with a mean of 2.9 days and a standard deviation of 1.64 days [20]. A sensitivity analysis using statewide-level data was conducted with an alternative serial interval distribution based on early pandemic data, which had a mean of 4.6 days and a standard deviation of 5.55 days [9,21]. A sensitivity analysis was also conducted using the default prior distribution for Rt (mean, 5; serial interval, 5). For each Rt estimate, 10 values were sampled from the posterior distribution. From the 10,000 time series of estimated daily infection counts, a total of 100,000 time series of Rt estimates were generated, from which the median and 95% CrI were calculated.
The policy change Rt analysis covered the period from 22 January to 31 December 2020. Seven non-overlapping time windows were used, aligned with specific dates corresponding to Massachusetts Executive Orders related to the implementation or relaxation of NPIs (Table 1). These NPIs were selected because they directly affected social interactions and mobility, were uniformly implemented statewide, and were most relevant for evaluating SARS-CoV-2 transmission dynamics at the population level. Other government orders (Table A1), such as those concerning licensing, insurance, or health care operations, were excluded as they primarily applied to specific sectors and were less directly related to community-wide transmission. Each time window represents a combination of NPIs in place as prior NPIs may continue to be implemented. For each time window, median Rt estimates and their 95% CrI were calculated. The effect of these policy changes on transmission dynamics was assessed by calculating the percentage change in Rt between successive time windows throughout 2020. The median and 95% CrI of the percentage change were obtained via bootstrapping. A simple linear regression analysis was conducted to examine the relationship between percentage change in Rt and the log_10_-transformed population density of each region.
2.2.4. Statistical Language
All statistical analyses were performed using R version 4.4.1 (R Core Team, R Foundation for Statistical Computing, Vienna, Austria, 2024). Important R packages used in this paper include the incidental package (version 0.1) for deconvolution and EpiEstim package (version 2.2.4) for Rt estimation. The R script for this project is provided in Supplementary File S1. Our custom functions can be found in Supplementary File S2.
3. Results
In early 2020, incident case counts and estimated infections remained low, indicating minimal transmission (Figure 2). This was followed by a gradual increase through mid-2020, marking the onset of periodic fluctuations. These fluctuations continued throughout 2021, with observable peaks in December 2020 and September 2021 indicating elevated case counts; however, neither peak approached the pronounced surge recorded in early 2022 during the Omicron wave. Following this surge, cases declined rapidly and then stabilized, with relatively minor fluctuations through mid-2022.
3.1. 7-Day Sliding Window Rt
The 7-day sliding window Rt fluctuated throughout the COVID-19 pandemic in Massachusetts (Figure 2). In early 2020, Rt remained above 1, indicating sustained transmission. By mid-2020, Rt declined. During the summer and fall of 2020, it fluctuated around 1, suggesting near-equilibrium transmission levels. Increases in Rt were observed in October and November 2020. By late 2020, Rt again exceeded 1. After fluctuating near or below 1 for several months, Rt increased during the summer and in November 2021. The November peak was followed by a surge in cases and estimated infections in December. Following this surge, Rt declined and remained near or below 1 through mid-2022.
Sensitivity analyses were conducted to assess the effect of using an alternative serial interval distribution on Rt estimates. This distribution, with a mean of 4.6 days and a standard deviation of 5.55 days, was derived from early pandemic data [9,21]. These parameters were applied to the statewide 7-day sliding window Rt estimation (Figure A1). Additional analyses tested other combinations of serial interval and prior parameters (Figure A2 and Figure A3). Results showed no substantial differences from the main analysis (Figure 2). Our sensitivity analyses also examined the effect of varying the infection multiplier. Estimates based on multipliers of 3.4 and 4.7 differed in scale from those using the multiplier of 4 in the primary analysis but showed the same temporal patterns (Figure A4).
We also performed 7-day sliding window Rt estimation for the regions and counties. The results were similar to the state level results, and they were not shown here.
3.2. Policy Change Rt
Throughout 2020, Massachusetts implemented a range of public health measures with differential effects on Rt across the state. Analysis of these changes (Figure 3 and Figure 4; Table A2) showed that statewide school closure and gathering restrictions (Policy A) were associated with a notable reduction in Rt (−14.7%; 95% CrI: −23.6%, −5.6%). Meanwhile, the mask mandate (Policy B), the re-opening phases (Policies C–E), travel and quarantine measures (Policy F), and curfew and gathering restrictions (Policy G) were not associated with statistically significant changes in Rt at the state level.
Regional analysis indicated variability in the effects of these NPIs (Figure 3 and Figure 4; Table A2). The Boston region experienced the largest reduction in Rt from school closure and gathering restrictions (−16.9%; 95% CrI: −26.9%, −7.5%), followed by the Northeast (−15.2%; 95% CrI: −24.9%, −5.1%) and Metro West (−15.2%; 95% CrI: −24.4%, −6.1%) regions. In contrast, the Western region showed no statistically significant reduction in Rt (−12.5%; 95% CrI: −21.3%, 3.2%). The mask mandate showed limited effect across all regions, which was consistent with state-level findings. Similarly, Phase 3 re-opening and travel and quarantine requirements were not associated with changes in Rt across regions. Curfew and gathering restrictions were only associated with reductions in Rt in the Central (−6.8%; 95% CrI: −10.8%, −0.5%) and Western (−6.6%; 95% CrI: −10.7%, −0.3%) regions.
We postulate that the magnitude of percentage change in Rt following policy changes is associated with regional population density (Table A3). Linear regression analyses demonstrated strong correlations between the implementation and relaxation of certain NPIs and log_10_-transformed population density. For example, for every 10-fold increase in population density, the percentage change in Rt decreased by 2.7% (95% CrI: −3.6%, −1.8%) following school closure and gathering restrictions, with an R^2^ of 0.93. In contrast, Phase 2 re-opening was associated with a 1.9% increase in the percentage change in Rt (95% CrI: 1.3%, 2.6%) per 10-fold increase in population density, also with an R^2^ of 0.93. Similarly, the implementation of travel and quarantine requirements in August 2020 was associated with a 4.9% decrease in the percentage change in Rt (95% CrI: −6.8%, −3.0%) per 10-fold increase in population density, with an R^2^ of 0.90. Other NPIs, such as the mask mandate and curfew restrictions, showed weaker correlations, as reflected by lower R^2^ values (Table A4; Figure A5).
At the county level, both the median Rt estimates (Figure A6) and the percentage changes in Rt (Figure A7) were broadly consistent with the regional results, supporting the robustness of our findings. However, credible intervals were generally wider in counties with smaller populations.
4. Discussion
In this study, we estimated COVID-19 Rt in Massachusetts from January 2020 to July 2022 and examined how NPIs were associated with the transmission dynamics of SARS-CoV-2 in Massachusetts during 2020. Specifically, we assessed the association between seven major statewide NPI policy changes in 2020 and SARS-CoV-2 transmission across six regions of the state (Figure 4). Our findings indicate that early interventions, such as school closure and gathering restrictions, were associated with reductions in Rt. In contrast, none of the subsequent NPI policy implementation and relaxation was associated with statistically significant changes in Rt at the state level, and the magnitude of percentage change in Rt varied by region. Notably, the mask mandate introduced in May 2020 was not associated with a significant change in Rt. This may be due to the short interval (less than two weeks) between the implementation of the mask mandate (Policy B) and Phase 1 re-opening (Policy C), which could have confounded the observed trends. Prior research by Li et al. suggested the effects of NPIs may not be immediate, with their maximal effect potentially delayed by up to four weeks, and that the optimal timing of their effect varies by intervention [33].
Our findings on the effects of widely implemented NPIs in reducing COVID-19 Rt align with similar studies conducted in 13 other U.S. states and three Canadian provinces [6,7,8,9,10,11,34]. In Kentucky, North Dakota, Alberta, British Columbia, and Ontario, the implementation of school closure early in the pandemic had a significant impact on reducing transmission, with reductions in Rt ranging from −18.0% to −42.6%. Similarly, other physical distancing measures, including business closures and stay-at-home orders, were associated with reductions in Rt ranging from −20.0% to −62.7%. Although some states implemented multiple NPIs concurrently, potentially compounding their effects, the findings consistently highlight the effectiveness of early interventions, such as school closure and physical distancing, in controlling transmission before vaccines were available. K–12 school closure, in particular, have proven effective in mitigating influenza pandemics by reducing case burden [35,36]. Our findings, along with the aforementioned studies, provide further evidence that limiting physical gatherings may reduce COVID-19 transmission. These findings are also consistent with those of Auger et al., who reported that statewide school closure was temporally associated with reductions in COVID-19 incidence and mortality [37]. This underscores the role of children in transmission, likely due to prolonged close contact and mild or asymptomatic presentations [38]. While the effectiveness of school closure in reducing transmission is well-documented, the negative consequences of prolonged closures on children’s education have also been emphasized [39,40]. Decisions regarding school closure should therefore be made with careful consideration to balance educational needs with public health goals. Furthermore, we acknowledge the negative mental health effects of prolonged social distancing measures, which may be associated with the observed increase in opioid overdose events and overdose-related deaths in the U.S. at the onset of the COVID-19 pandemic [41,42]. Decision-makers, therefore, must carefully weigh the benefits and drawbacks of social distancing measures when responding to future pandemics caused by emerging respiratory pathogens.
Our regional analysis showed variability in policy change Rt across the six regions of Massachusetts. Following school closure and gathering restrictions in March 2020, the Boston, Northeast, and Metro West regions experienced slightly larger reductions in Rt (−15.2% to −16.9%) compared to the statewide average (−14.7%), while the Southeast, Central, and Western regions saw smaller reductions (−12.5% to −13.7%). However, the CrIs for these estimates overlapped considerably (Table A4), suggesting that there were no statistically significant differences in Rt reductions between regions. Given the similarity in Rt changes across regions, these differences are unlikely to warrant tailored interventions at the regional level.
The mask mandate showed limited effects across all regions, with reductions in Rt ranging from −2.4% to −6.6%. However, as multiple NPIs were implemented around the same time, it is difficult to isolate the specific impact of the mask mandate. Given that Rt had already been driven low by school closure and gathering restrictions since 15 March 2020, the marginal effect of adding a mask mandate to the existing package of NPIs on 6 May 2020, in further reducing Rt was small. This does not imply that masks themselves were ineffective. Rather, the population-level effectiveness of masking depends on adherence. Evidence from U.S. states indicates that those with ≥75% adherence, including Massachusetts, experienced substantially lower COVID-19 incidence in subsequent months, whereas states with lower adherence saw much higher case rates [43]. In this context, the statewide mask mandate was likely more important for encouraging protective behaviors that reduced individual risk of infection and for preparing the public for Phase 1 reopening than for producing an immediate reduction in Rt at the population level. Subsequently, Phase 2 and Phase 3 re-openings were associated with slight increases in Rt in several regions. Given the uncertainty around Rt estimates, the percentage change in Rt was also highly uncertain and statistically insignificant. Taken together, while interventions like school closure and gathering restrictions were associated with reductions in Rt, other measures such as the mask mandate and re-opening phases did not show statistically significant effects across regions. These findings indicate that not all NPIs were equally effective in reducing transmission at the population level, and their marginal effects were difficult to detect in real-world settings given the observational nature of the study design.
While our analysis did not find statistically significant associations between certain NPIs, such as the mask mandate and travel and quarantine requirements, and reductions in Rt, a key consideration in pandemic emergency response is that proactive measures, even with modest effects, are often preferable to inaction. In the context of a rapidly spreading pandemic before vaccines became available, even small reductions in spread could contribute to improved health outcomes at the population level. These effects might be amplified when multiple interventions were implemented in combination, potentially leading to greater overall reductions in transmission [44]. Furthermore, these interventions, when coupled with effective public health messaging that fostered compliance and signaled government action to curb transmission, could reduce strain on healthcare systems and lower the risk of more severe outcomes [45]. Future research could examine the effects of population immunity over time on transmission dynamics and investigate factors contributing to variation in intervention outcomes across regions. These efforts could strengthen pandemic preparedness and inform more effective, evidence-based public health responses.
Limitations
This study was subject to several limitations. First, irregularities in public health surveillance reporting, such as negative or zero incident case counts, necessitated data imputation using surrounding values. While this approach might not fully reflect true case counts, it provided reasonable estimates that reduced discontinuities caused by reporting anomalies and enabled a more interpretable dataset for Rt analysis. Second, our deconvolution process to estimate infection time relied on the incidental package’s default infection-to-report time lag distribution, which was derived from a 2020 Florida dataset. However, the time lag distribution in Massachusetts could differ from that in Florida, and this distribution might change over time. Third, the underreporting of COVID-19 cases, particularly asymptomatic or mildly symptomatic infections, might have introduced bias into infection estimates. To address this, we applied a Poisson-distributed multiplier of 4 to estimate total infections [6,18]. While this provided a simple adjustment for underreporting, it did not account for regional or temporal variation in reporting rates or symptom presentation. These differences likely affected the accuracy of infection estimates and might limit the comparability of results across regions and over time. As such, findings related to spatial or temporal differences in transmission should be interpreted with caution. Fourth, Rt was estimated using the EpiEstim package, which assumes a fixed serial interval distribution. While serial intervals might have changed over time due to shifting NPIs or behavioral adaptations [46], time-varying data on serial intervals were not available for most of the study period. As such, the use of a constant serial interval was considered a reasonable approximation, though it may introduce bias during periods of rapid transmission or major policy change. Fifth, the policy change Rt analysis was segmented into seven non-overlapping time windows defined by key Executive Orders related to NPIs. This segmentation inevitably involved some arbitrariness, but it offered a systematic way to examine the association between policy changes and transmission dynamics. Because public adherence and enforcement did not always coincide with the exact dates of policy enactment, the analysis could not fully capture the timing of behavioral shifts. A policy change Rt estimate between the time points of two major policy enactments was essentially an average of Rt estimates over that period of time, reflecting the average transmission potential over the time period under a specific combination of policy mandates. That said, anchoring estimates to official enactment dates could smooth short-term fluctuations and capture the broader temporal effects of major interventions. Sixth, this is an ecological study using aggregate data. Association at the group level may not reflect the relationship at the individual level. Ecological fallacy is a possibility. That said, this is an appropriate study design, given our research questions.
5. Conclusions
The Massachusetts COVID-19 Rt case study provides valuable insights into the impact of public health interventions during the early stages of the pandemic. While modest regional differences in Rt were observed, overlapping CrIs suggest that these differences were not statistically significant enough to warrant region-specific interventions. Our findings highlight the importance of early and broad measures, such as school closure and gathering restrictions, in mitigating transmission.
The reference list from the paper itself. Each links out to its DOI / PubMed record.
- 1Sharecare Boston University School of Public Health Sharecare Community Well-Being Index: 2022 State Rankings Report Available online: https://wellbeingindex.sharecare.com/wp-content/uploads/2023/09/CWBI-State-Rankings-Report 20230828.pdf(accessed on 30 November 2024)
- 2Lemieux J.E. Siddle K.J. Shaw B.M. Loreth C. Schaffner S.F. Gladden-Young A. Adams G. Fink T. Tomkins-Tinch C.H. Krasilnikova L.A. Phylogenetic analysis of SARS-Co V-2 in Boston highlights the impact of superspreading events Science 2021371 eabe 326110.1126/science.abe 326133303686 PMC 7857412 · doi ↗ · pubmed ↗
- 3Cori A. Ferguson N.M. Fraser C. Cauchemez S. A new framework and software to estimate time-varying reproduction numbers during epidemics Am. J. Epidemiol.20131781505151210.1093/aje/kwt 13324043437 PMC 3816335 · doi ↗ · pubmed ↗
- 4Lee I.S.-T. Ofori S.K. Babatunde D.A. Akowuah E.A. Kwok K.O. Chowell G. Fung I.C.-H. COVID-19 Transmission Potential and Non-Pharmaceutical Interventions in Maine During the COVID-19 Pandemic Pathogens 20251489310.3390/pathogens 1409089341011793 PMC 12472373 · doi ↗ · pubmed ↗
- 5Buesseler A.A. Hua X. Adom D.A. Das S. Kutten W.S. Olatunde O. Sheppard O.A. Soo J.-C. Kersey J. Kwok K.O. Geographical Variation in COVID-19 Transmission Potential and Case Burden, West Virginia, 2020–2023 Disaster Med. Public Health Prep.202519 e 7510.1017/dmp.2025.4940230244 · doi ↗ · pubmed ↗
- 6Ogwara C.A. Ronberg J.W. Cox S.M. Wagner B.M. Stotts J.W. Chowell G. Spaulding A.C. Fung I.C.H. Impact of public health policy and mobility change on transmission potential of severe acute respiratory syndrome coronavirus 2 in Rhode Island, March 2020–November 2021 Pathog. Glob. Health 2024118657910.1080/20477724.2023.220198437075167 PMC 10769146 · doi ↗ · pubmed ↗
- 7Davies M.R. Hua X. Jacobs T.D. Wiggill G.I. Lai P.Y. Du Z. Deb Roy S. Robb S.W. Chowell G. Fung I.C.H. SARS-Co V-2 transmission potential and policy changes in South Carolina, February 2020–January 2021 Disaster Med. Public Health Prep.202317 e 27610.1017/dmp.2022.212PMC 953038535924560 · doi ↗ · pubmed ↗
- 8Hua X. Kehoe A.R.D. Tome J. Motaghi M. Ofori S.K. Lai P.Y. Ali S.T. Chowell G. Spaulding A.C. Fung I.C.H. Late surges in COVID-19 cases and varying transmission potential partially due to public health policy changes in 5 western states, March 10, 2020–January 10, 2021 Disaster Med. Public Health Prep.202317 e 27710.1017/dmp.2022.24836325878 PMC 9794457 · doi ↗ · pubmed ↗