Age-Stratified Differences in Cardio–Reno–Metabolic Risk Profiles
Mihaela Simona Popoviciu, Timea Claudia Ghitea

TL;DR
This study shows how cardio–reno–metabolic risk factors change with age, highlighting the need for age-specific prevention strategies.
Contribution
The study identifies distinct age-related shifts in dominant risk markers from metabolic to vascular-renal profiles.
Findings
Younger adults (<65) showed higher metabolic risk markers like BMI and triglycerides.
Older adults (>75) exhibited higher systolic blood pressure and lower eGFR, indicating vascular-renal risk.
Composite risk scores were similar across age groups despite differing individual markers.
Abstract
Background: Susception to cardio–reno–metabolic disorders increases markedly with age; however, the dominant contributors to risk may differ across the adult life course. While metabolic abnormalities often predominate at younger ages, vascular and renal alterations become more prominent in older populations. Understanding how these risk components reconfigure with aging may inform age-tailored prevention strategies. Methods: This cross-sectional observational study included 287 adults undergoing clinical and biochemical evaluation for cardio–metabolic risk. Participants were stratified into three age categories: <65 years (n = 175), 65–75 years (n = 84), and >75 years (n = 28). Anthropometric measurements, blood pressure, metabolic parameters, liver enzymes, inflammatory markers, and renal function indices were assessed. Insulin resistance was estimated using the triglyceride–glucose…
Genes, proteins, chemicals, diseases, species, mutations and cell lines named across the full text — each resolved to its canonical identifier and authoritative record.
Click any figure to enlarge with its caption.
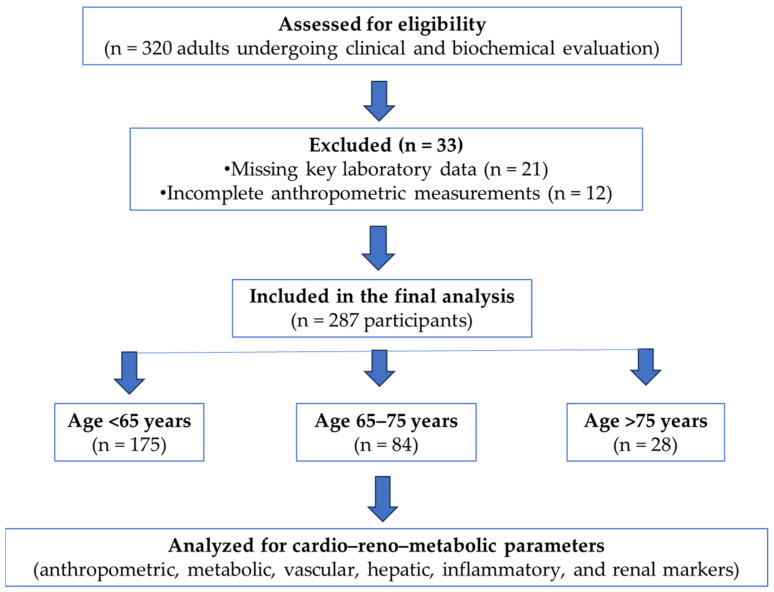 Figure 1
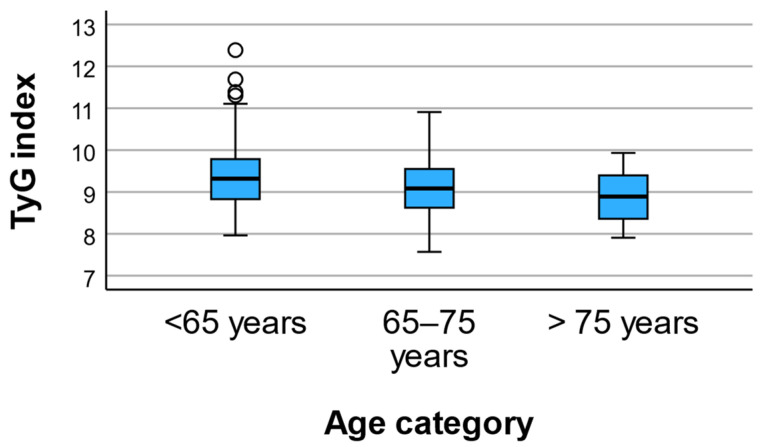 Figure 2
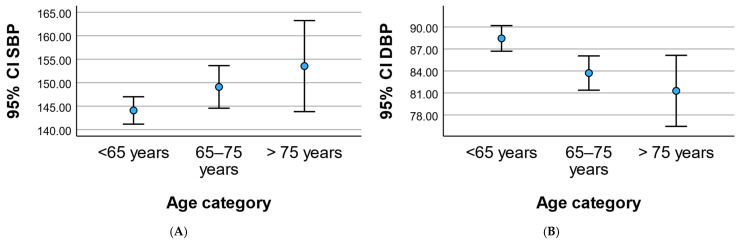 Figure 3
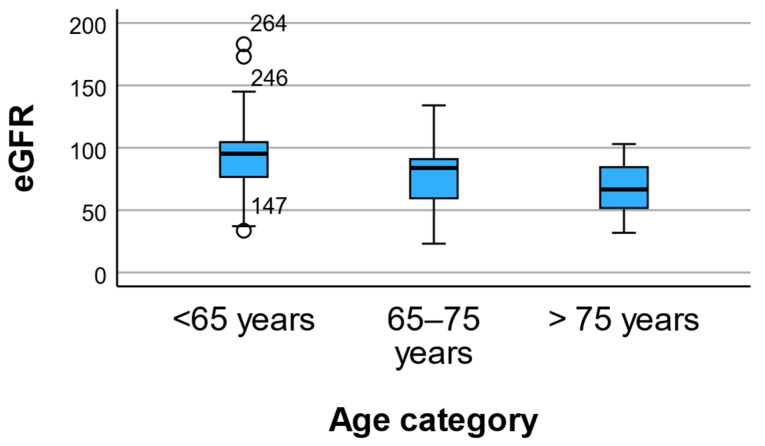 Figure 4
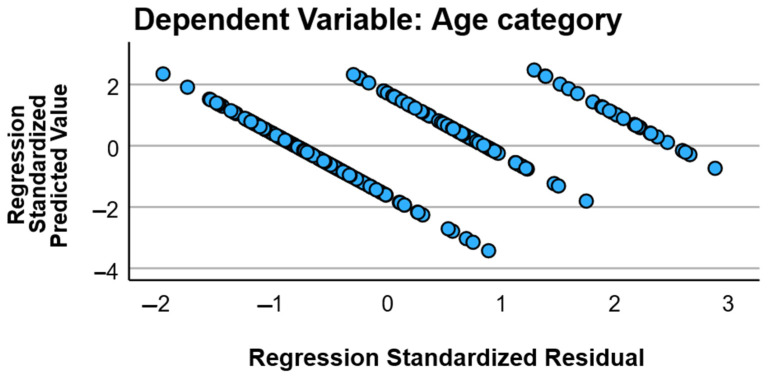 Figure 5
- —University of Oradea
Peer Reviews
No public reviews on file for this paper yet. If you reviewed it on a platform where reviews are public (OpenReview, ICLR, NeurIPS, ICML), you can paste yours below so the community can read it here.
Videos
No videos yet. Explain this paper in a talk, walkthrough, or lecture? Add one.
Taxonomy
TopicsChronic Kidney Disease and Diabetes · Dialysis and Renal Disease Management · Diabetes, Cardiovascular Risks, and Lipoproteins
1. Introduction
Cardio–metabolic and renal disorders are major contributors to global morbidity and mortality, with their burden increasing substantially with advancing age. Aging is associated with complex physiological changes that affect glucose metabolism, lipid handling, vascular structure, and renal function, ultimately leading to a higher prevalence of cardiovascular disease, chronic kidney disease, and their shared risk factors in older populations. However, the relative contribution of metabolic versus vascular–renal mechanisms to overall risk may vary across different stages of adulthood and aging [1,2,3].
In younger and middle-aged adults, cardio–metabolic risk is often dominated by obesity, insulin resistance, dyslipidemia, and impaired glucose regulation. These metabolic abnormalities promote endothelial dysfunction, low-grade inflammation, and early microvascular injury, processes that may precede clinically overt cardiovascular or renal disease by many years. As individuals age, cumulative exposure to metabolic stressors, together with age-related vascular remodeling and arterial stiffness, may shift the risk profile toward hemodynamic and renal vulnerability [4,5,6,7,8].
In older adults, particularly those over 75 years of age, vascular aging becomes a central determinant of adverse outcomes. Increased systolic blood pressure, reduced diastolic pressure, and declining renal function reflect progressive arterial stiffness and microvascular damage. These changes are closely linked to cardiovascular events, functional decline, and increased mortality in geriatric populations. Importantly, renal impairment often represents a late manifestation of long-standing cardio–metabolic and vascular injury, raising questions about the optimal timing for risk detection and preventive interventions [9,10,11].
Despite extensive evidence linking aging to increased cardio–renal risk, relatively few studies have examined how the dominant components of cardio–reno–metabolic risk shift across age categories, particularly in populations with a high burden of metabolic disorders. Understanding whether metabolic dysregulation predominates at younger ages while vascular–renal alterations emerge later may have important implications for age-tailored risk stratification and prevention strategies [12,13].
From a clinical perspective, this life-course approach suggests that identifying vascular and microvascular risk at earlier stages—when metabolic abnormalities are already present but before irreversible vascular or renal damage has occurred—could offer a critical window for intervention. However, data directly comparing metabolic, vascular, and renal markers across distinct age strata within the same cohort remain limited.
The aim of this study was to investigate age-related differences in cardio–reno–metabolic risk profiles by comparing anthropometric, metabolic, vascular, hepatic, inflammatory, and renal parameters across three age categories (<65 years, 65–75 years, and >75 years). By characterizing how risk patterns shift with advancing age, this study seeks to provide insight into the potential importance of early vascular risk detection in metabolically burdened younger adults.
2. Materials and Methods
2.1. Study Design and Population
This study was designed as a cross-sectional observational analysis conducted in adult patients undergoing clinical and biochemical evaluation for cardio–metabolic risk. A total of 287 participants were included and stratified according to age into three predefined categories: <65 years, 65–75 years, and >75 years.
Participants were included if complete clinical, anthropometric, and laboratory data were available at the time of assessment. Individuals with missing key variables required for the calculation of composite indices were excluded from the analysis (Figure 1).
2.2. Clinical and Anthropometric Assessment
Anthropometric measurements were performed using standardized procedures. Body mass index (BMI) was calculated as weight divided by height squared (kg/m^2^). Waist circumference was measured at the midpoint between the lower margin of the last palpable rib and the top of the iliac crest.
Blood pressure was measured in a seated position after a minimum of 5 min of rest, using a calibrated sphygmomanometer. Systolic (SBP) and diastolic blood pressure (DBP) values were recorded and used for analysis.
2.3. Laboratory Measurements
Venous blood samples were collected after an overnight fast. Laboratory analyses included investigations of the following:
- Fasting plasma glucose;
- Lipid profile, including triglycerides and HDL cholesterol;
- Liver enzymes, alanine aminotransferase (ALT) and aspartate aminotransferase (AST);
- Inflammatory markers and C-reactive protein (CRP);
- Hematological parameters, including platelet count;
- Renal function markers, serum creatinine and estimated glomerular filtration rate (eGFR);
- Urinary samples were collected for the assessment of urinary albumin-to-creatinine ratio (UACR).
The eGFR was calculated using the CKD-EPI creatinine equation and expressed as mL/min/1.73 m^2^.
2.4. Composite Indices
The triglyceride–glucose (TyG) index was calculated as a surrogate marker of insulin resistance using the established formula:
The FIB-4 index, a non-invasive marker of hepatic fibrosis risk, was calculated based on age, AST, ALT, and platelet count using the standard equation. Given that age is a component of the FIB-4 formula, this index was interpreted with caution in age-stratified analyses.
A composite risk category score was also recorded, reflecting global cardio–metabolic risk stratification according to institutional clinical protocols.
2.5. Data Collection
All personal identifiers were removed prior to analysis. Data were coded and stored on a password-protected institutional server accessible only to authorized investigators. Clinical and biochemical data were obtained by the same trained medical team under standardized institutional procedures. Anthropometric measurements were performed by certified nurses, and venous blood samples were collected by licensed laboratory staff.
2.6. Statistical Analysis
SPSS (v30) was used for data cleaning, visualization, and regression modeling with robust (HC3) standard errors, and for classical statistical tests (normality, ANOVA, and correlation analyses) to ensure consistency and cross-validation of results. Continuous variables were expressed as mean ± standard deviation (SD) or median (IQR), and categorical data as frequencies (%). Between-group comparisons across metabolic risk categories were performed using one-way ANOVA or the Kruskal–Wallis test, as appropriate. Correlations were evaluated using Pearson’s r and Spearman’s ρ coefficients.
Normality was assessed using Shapiro–Wilk tests. For skewed variables (e.g., triglycerides, fasting glucose, UACR, CRP), nonparametric Kruskal–Wallis tests were performed to verify robustness of group comparisons.
2.7. Ethical Considerations
The study was conducted in accordance with the Declaration of Helsinki and approved by the Institutional Ethics Committee of the University of Oradea (protocol CEFMF/1, 31 January 2023).
3. Results
3.1. Study Population Characteristics
A total of 287 participants were included in the analysis and stratified into three age categories: <65 years (n = 175), 65–75 years (n = 84), and >75 years (n = 28), presented in Table 1. Sex distribution did not differ significantly across age groups (male/female: <65 = 94/81; 65–75 = 41/43; >75 = 10/18; p = 0.195).
3.2. Anthropometric Profile
Significant differences were observed in anthropometric parameters across age categories. Both body mass index and waist circumference decreased progressively with advancing age, with the lowest values recorded in participants older than 75 years. Mean BMI declined from 35.54 ± 5.03 in individuals younger than 65 years to 35.04 ± 3.97 in those aged 65–75 years and to 32.71 ± 2.29 in the oldest group (p = 0.009). Similarly, waist circumference showed a comparable age-related pattern, decreasing from 111.93 ± 10.82 cm to 111.25 ± 8.65 cm and 105.79 ± 4.75 cm across the respective age categories (p = 0.009).
3.3. Glycemic and Lipid Profile
Markers of glucose metabolism and insulin resistance differed significantly across age categories. Fasting plasma glucose levels were highest in participants younger than 65 years and showed a progressive decline with advancing age, decreasing from 162.48 ± 62.58 mg/dL in the youngest group to 148.06 ± 44.51 mg/dL in those aged 65–75 years and to 133.00 ± 31.98 mg/dL in participants older than 75 years (p = 0.012).
A similar age-related pattern was observed for lipid metabolism and markers of insulin resistance. Triglyceride concentrations decreased progressively across age strata, from 201.14 ± 182.82 mg/dL in individuals younger than 65 years to 146.65 ± 78.04 mg/dL and 125.07 ± 62.52 mg/dL in the intermediate and oldest age groups, respectively (p = 0.004). Consistently, the triglyceride–glucose (TyG) index declined significantly with age (9.43 ± 0.78 vs. 9.14 ± 0.61 vs. 8.88 ± 0.58; p = 0.001) (Figure 2). In contrast, HDL cholesterol levels did not differ significantly among age groups (p = 0.503).
3.4. Blood Pressure Profile
Age-related differences were observed in blood pressure components (Figure 3). Systolic blood pressure increased progressively across age categories, rising from 144.09 ± 19.57 mmHg in participants younger than 65 years to 149.10 ± 20.92 mmHg in those aged 65–75 years and reaching 153.54 ± 25.02 mmHg in individuals older than 75 years (p = 0.030). In contrast, diastolic blood pressure showed a significant decline with advancing age, decreasing from 88.44 ± 11.71 mmHg to 83.71 ± 10.77 mmHg and 81.29 ± 12.49 mmHg across the respective age groups (p = 0.001).
3.5. Hepatic and Hematological Markers
Significant age-related differences were observed in hepatic and hematological markers. Alanine aminotransferase (ALT) levels were highest in participants younger than 65 years and declined progressively with advancing age, decreasing from 33.71 ± 20.82 U/L to 21.39 ± 9.20 U/L and 19.00 ± 10.07 U/L in the 65–75 and >75 year age groups, respectively (p = 0.001). Aspartate aminotransferase (AST) showed a similar downward trend with age, although this association reached only borderline statistical significance (29.37 ± 25.60 vs. 22.50 ± 8.34 vs. 25.54 ± 19.81 U/L; p = 0.052).
Platelet count decreased significantly across age categories, from 250.09 ± 65.01 × 10^3^/µL in the youngest group to 238.10 ± 61.90 × 10^3^/µL in those aged 65–75 years and 212.89 ± 56.66 × 10^3^/µL in participants older than 75 years (p = 0.012). In contrast, the FIB-4 index increased markedly with age, rising from 1.18 ± 0.80 in individuals younger than 65 years to 1.57 ± 0.74 and 2.71 ± 3.12 in the intermediate and oldest age groups, respectively (p = 0.001).
3.6. Renal Function and Albuminuria
Renal function parameters differed significantly across age categories (Figure 4). Serum creatinine levels increased with advancing age, rising from 0.82 ± 0.21 mg/dL in participants younger than 65 years to 0.92 ± 0.27 mg/dL in those aged 65–75 years and 0.91 ± 0.29 mg/dL in individuals older than 75 years (p = 0.005).
A pronounced age-related decline was observed in estimated glomerular filtration rate (eGFR), which decreased progressively from 91.31 ± 22.53 mL/min/1.73 m^2^ in the youngest group to 76.32 ± 20.34 mL/min/1.73 m^2^ and 67.73 ± 19.69 mL/min/1.73 m^2^ in the intermediate and oldest age groups, respectively (p = 0.001). In contrast, urinary albumin-to-creatinine ratio (UACR) showed no significant differences across age categories, despite substantial variability within groups (p = 0.243).
Sensitivity Analysis Using eGFR Categories
When renal function was analyzed using KDIGO eGFR categories rather than continuous values, a clear age gradient remained evident. Mean age category increased progressively from G1 (>90 mL/min/1.73 m^2^) to G3b (30–44 mL/min/1.73 m^2^). One-way ANOVA confirmed significant differences across categories (F(3283) = 13.31, p < 0.001).
The effect size was moderate-to-large (η^2^ = 0.124; ω^2^ = 0.114), indicating that the observed differences were clinically meaningful. Post hoc Bonferroni tests showed that individuals with preserved renal function (G1) were significantly younger than those in G2, G3a, and G3b categories (all p < 0.001).
These findings support that age-related differences in renal markers were not fully explained by physiological age-related decline in eGFR but reflect meaningful stratification across clinically relevant renal function categories.
3.7. Inflammatory Marker
C-reactive protein (CRP) levels did not differ significantly across age categories. Mean CRP values were 50.56 ± 74.69 mg/L in participants younger than 65 years, 57.37 ± 82.59 mg/L in those aged 65–75 years, and 39.83 ± 51.08 mg/L in individuals older than 75 years (p = 0.546), indicating no significant age-related differences in systemic inflammatory status.
3.8. Hierarchical Linear Regression Between Age Category, eGFR, and TyG Index
The distribution of the composite risk category score did not differ significantly between age groups (p = 0.882), despite marked age-related differences in individual cardio-metabolic and renal parameters (Figure 5). Results should be interpreted in terms of direction and association strength rather than prediction.
To further explore the joint relationship between renal function and insulin resistance across age strata, we performed a hierarchical multiple linear regression with age category as the dependent variable (coded ordinally, with higher values indicating older age), presented in Table 2. Predictors were entered in two steps using the Enter method: Model 1 included eGFR only, and Model 2 added the TyG index.
Model 1 (eGFR only) was statistically significant (F(1285) = 45.142, p < 0.001) and explained 13.7% of the variance in age category (R^2^ = 0.137; adjusted R^2^ = 0.134). Lower eGFR was associated with higher age category (B = −0.011, β = −0.370, p < 0.001).
After adding the TyG index (Model 2), the model remained significant (F(2284) = 35.328, p < 0.001) and explained 19.9% of the variance (R^2^ = 0.199; adjusted R^2^ = 0.194). The inclusion of the TyG index improved model fit by ΔR^2^ = 0.062, corresponding to an estimated F-change of ≈22.2 (p < 0.001). In Model 2, both predictors were independently associated with age category: eGFR remained negatively associated (B = −0.011, β = −0.367, p < 0.001) and the TyG index was also negatively associated (B = −0.227, β = −0.250, p < 0.001), indicating that higher insulin resistance (higher TyG) was more strongly represented in younger age categories.
Nonparametric analyses confirmed the main findings. Kruskal–Wallis tests showed significant age-group differences for triglycerides (p < 0.001) and fasting glucose (p = 0.038), while UACR and CRP remained non-significant.
4. Discussion
4.1. Cross-Sectional Age-Related Differences in Cardio–Reno–Metabolic Risk
In this cross-sectional analysis, we observed clear differences in dominant cardio–reno–metabolic risk patterns across age groups. Participants aged <65 years exhibited a predominantly metabolic phenotype, characterized by higher body mass index, waist circumference, fasting glucose, triglycerides, and TyG index. In contrast, older age groups—particularly those >75 years—demonstrated a shift toward a vascular–renal phenotype, marked by higher systolic blood pressure, lower diastolic blood pressure, and a progressive decline in estimated glomerular filtration rate.
This divergence suggests that aging is associated not merely with an accumulation of risk factors, but with a qualitative shift in the dominant pathophysiological pathways contributing to cardio–renal vulnerability. While metabolic dysregulation appears to be more prominent at younger ages, vascular stiffness, microvascular damage, and renal impairment become increasingly salient later in life [14,15,16,17]. These findings describe cross-sectional contrasts between age groups and should not be interpreted as evidence of individual-level temporal transitions. Detailed data on pharmacological treatment were not systematically available and may represent a source of residual confounding. Results should be interpreted in terms of direction and association strength rather than prediction.
4.2. Metabolic Burden at Younger Ages as a Potential Precursor of Vascular–Renal Injury
The elevated TyG index and triglyceride levels observed in the <65 age group indicate a higher degree of insulin resistance and metabolic stress. These alterations are known to promote endothelial dysfunction, low-grade inflammation, and early microvascular injury, even before overt clinical cardiovascular or renal disease becomes apparent.
Importantly, although markers of overt renal impairment (e.g., reduced eGFR) were more pronounced in older participants, the metabolic burden observed in younger individuals may represent an upstream driver of later vascular and renal damage. In this context, metabolic dysregulation at younger ages could be viewed as a risk amplifier, predisposing individuals to accelerated vascular aging and subsequent renal functional decline [17,18,19,20,21].
Thus, the apparent dissociation between metabolic risk at younger ages and vascular–renal manifestations at older ages may reflect different stages along a shared disease continuum rather than distinct, unrelated phenotypes.
4.3. Blood Pressure Pattern and Vascular Aging
The blood pressure profile observed across age groups provides additional insight into the vascular dimension of this risk reconfiguration. The progressive increase in systolic blood pressure combined with a decline in diastolic blood pressure is consistent with increased arterial stiffness and reduced vascular compliance in older adults.
This pattern has important clinical implications, as isolated systolic hypertension and widened pulse pressure are well-established predictors of cardiovascular events, cognitive decline, and renal damage in older populations. The emergence of this hemodynamic profile in the presence of declining eGFR underscores the close interplay between vascular aging and renal vulnerability [22,23,24].
4.4. Renal Function Decline as a Late Manifestation of Cumulative Risk
The marked decline in eGFR with advancing age observed in this study likely reflects the combined effects of chronological aging, vascular remodeling, and long-standing exposure to metabolic and hemodynamic stressors. Although the urinary albumin-to-creatinine ratio did not differ significantly between age groups, its wide variability suggests heterogeneity in microvascular renal involvement that may not be fully captured in a cross-sectional design.
From a clinical perspective, these findings reinforce the concept that reduced eGFR represents a relatively late marker of cumulative cardio–renal injury. Consequently, reliance solely on renal function indices at older ages may miss opportunities for earlier intervention during the metabolically driven phase of disease development [25,26,27]. The consistency of findings across both continuous and categorical renal measures strengthens confidence that the observed age-stratified patterns reflect genuine differences rather than index calibration effects.
4.5. Clinical Implications: Rationale for Early Vascular Risk Detection
Taken together, our findings support the notion that early detection of vascular and microvascular risk in metabolically burdened younger adults may be critical for preventing or delaying the transition toward overt vascular–renal disease in later life.
While younger individuals in this cohort exhibited a more adverse metabolic profile, they had not yet developed the pronounced vascular and renal alterations seen in older age groups. This window may represent a crucial opportunity for enhanced risk stratification, incorporating not only traditional metabolic markers but also early indicators of vascular dysfunction and renal stress [28,29,30].
Such an approach aligns with a life-course perspective on cardio–renal health, emphasizing prevention and early intervention rather than late-stage disease management [31].
4.6. Strengths and Limitations
The strengths of this study include the comprehensive assessment of metabolic, vascular, hepatic, and renal parameters across a broad age range and the use of clinically relevant composite indices such as the TyG index and eGFR.
However, several limitations warrant consideration. The cross-sectional design precludes causal inference and does not allow direct assessment of temporal risk progression. Potential confounding factors, including medication use, duration of metabolic disease, and survivor bias, may also influence age-related differences. Additionally, the FIB-4 index incorporates age into its calculation and should therefore be interpreted cautiously when comparing across age strata.
A key limitation relates to the age-dependent behavior of certain biomarkers. The estimated glomerular filtration rate physiologically declines with age even in the absence of overt kidney disease, and the FIB-4 index includes age as a direct component of its formula. Therefore, differences observed across age strata may partly reflect age-related calibration characteristics rather than purely pathological processes. Our findings should thus be interpreted as comparative risk patterns rather than diagnostic thresholds.
Information on pharmacological treatment was not systematically available and may represent a source of residual confounding.
Because age category is an ordinal outcome, linear regression treats the coding as approximately continuous. This approach is acceptable for exploratory modeling and effect direction; however, an ordinal logistic regression could be considered as a sensitivity analysis.
An additional limitation relates to the relatively small sample size in the oldest age group (>75 years, n = 28). This may reduce statistical precision and limit the generalizability of findings specific to this subgroup. Although the observed patterns were directionally consistent and clinically plausible, results concerning the oldest participants should be interpreted cautiously and confirmed in larger geriatric cohorts.
4.7. Future Directions
Longitudinal studies are needed to confirm whether the metabolic burden observed at younger ages directly contributes to subsequent vascular and renal deterioration. Future research should also explore whether early vascular or renal markers can improve risk prediction beyond traditional metabolic parameters and guide targeted preventive strategies across the aging continuum.
5. Conclusions
This study shows that cardio–reno–metabolic risk profiles differ across age groups. In contrast, older age groups—particularly those over 75 years—demonstrated a shift toward vascular–renal vulnerability, marked by higher systolic blood pressure, lower diastolic blood pressure, and a progressive decline in renal function.
These findings are consistent with the hypothesis that metabolic and vascular–renal markers may show different prominence across age strata, although longitudinal studies are required to confirm temporal sequencing. From a clinical perspective, this pattern underscores the importance of early identification of vascular and microvascular risk in metabolically burdened younger adults, before the onset of overt renal dysfunction and advanced vascular aging.
Although causal relationships cannot be established due to the cross-sectional design, our results support a life-course approach to cardio–renal risk assessment, emphasizing early prevention and timely intervention as key strategies to mitigate long-term vascular and renal complications across the aging continuum.
The reference list from the paper itself. Each links out to its DOI / PubMed record.
- 1Li J. Wei X. Association of cardiovascular-kidney-metabolic syndrome with all-cause and cardiovascular mortality: A prospective cohort study Am. J. Prev. Cardiol.20252210098510.1016/j.ajpc.2025.10098540242364 PMC 12003006 · doi ↗ · pubmed ↗
- 2Chia C.W. Egan J.M. Ferrucci L. Age-related changes in glucose metabolism, hyperglycemia, and cardiovascular risk Circ. Res.201812388690410.1161/CIRCRESAHA.118.31280630355075 PMC 6205735 · doi ↗ · pubmed ↗
- 3Shi J. Ye X. Yu S. Zhao Y. Xiong J. Ji H. Zhang Y. Vascular aging, cardiovascular-kidney-metabolic syndrome, and cardiovascular risk: The northern shanghai study JACC Adv.2025410224210.1016/j.jacadv.2025.10224241165644 PMC 12805181 · doi ↗ · pubmed ↗
- 4Drozdz D. Alvarez-Pitti J. Wójcik M. Borghi C. Gabbianelli R. Mazur A. Herceg-Čavrak V. Lopez-Valcarcel B.G. Brzeziński M. Lurbe E. Obesity and cardiometabolic risk factors: From childhood to adulthood Nutrients 202113417610.3390/nu 1311417634836431 PMC 8624977 · doi ↗ · pubmed ↗
- 5Buzle A.M. Cinezan C. Sasu P.S. Cura A.T. Ghitea M.C. Ghitea E.C. Gîtea M.F. Luncan A.B. Ghitea T.C. Popescu M.I. Post-pci inflammation and diastolic dysfunction in patients with metabolic risk factors: A retrospective observational study Medicina 202561201510.3390/medicina 6111201541303851 PMC 12654420 · doi ↗ · pubmed ↗
- 6Buzle A.M. Matache P. Moisi M.I. Ghitea M.C. Ghitea E.C. Gîtea M.F. Ghitea T.C. Popescu M.I. Early post-pci inflammatory risk score for diastolic dysfunction: Development and internal validation (tripod-compliant)Appl. Sci.2025151001810.3390/app 151810018 · doi ↗
- 7Kopaliani I. Elsaid B. Speier S. Deussen A. Immune and metabolic mechanisms of endothelial dysfunction Int. J. Mol. Sci.2024251333710.3390/ijms 25241333739769104 PMC 11728141 · doi ↗ · pubmed ↗
- 8Herzog M.J. Müller P. Lechner K. Stiebler M. Arndt P. Kunz M. Ahrens D. Schmeißer A. Schreiber S. Braun-Dullaeus R.C. Arterial stiffness and vascular aging: Mechanisms, prevention, and therapy Signal Transduct. Target. Ther.20251028210.1038/s 41392-025-02346-040887468 PMC 12399776 · doi ↗ · pubmed ↗