Diagnostic Performance of the QIAstat‐Dx Meningitis/Encephalitis Panel: Insights From Seven Clinical Evaluations
Flora Marzia Liotti, Brunella Posteraro, Maurizio Sanguinetti, Giulia De Angelis

TL;DR
The QIAstat-Dx Meningitis/Encephalitis Panel is a rapid diagnostic tool for central nervous system infections, showing strong performance in detecting pathogens from cerebrospinal fluid.
Contribution
The study provides a comprehensive review of the diagnostic performance of QIAstat-Dx across seven evaluations, highlighting its strengths and limitations compared to existing panels.
Findings
The QIAstat-Dx panel demonstrated high positive percent agreement (90.6% to 100%) in detecting pathogens from CSF samples.
Comparisons with the BioFire FilmArray panel showed minimal performance variation, supporting QIAstat-Dx as a robust diagnostic tool.
Limitations include low detection rates for certain targets like Mycoplasma pneumoniae and herpesviruses such as HSV-1.
Abstract
Central nervous system (CNS) infections require prompt and accurate diagnosis to enable timely and targeted antimicrobial therapy. Syndromic PCR‐based assays, such as the QIAstat‐Dx Meningitis/Encephalitis Panel (QIA‐ME), allow rapid detection of key pathogens directly from cerebrospinal fluid (CSF). We conducted a narrative review of seven studies (2023–2025) evaluating the diagnostic performance of QIA‐ME. A total of 1007 clinical CSF samples, ranging from 5 to 585, were retrospectively analyzed, with 8 to 14 targets assessed per study. Positive percent agreement (PPA) ranged from 90.6% to 100%, while negative percent agreement (NPA)—available in only three studies—ranged from 75.0% to 97.7%. In three studies, head‐to‐head comparisons with the BioFire FilmArray Meningitis/Encephalitis Panel (FA‐ME) revealed minimal variation in performance, reinforcing the robustness of QIA‐ME.…
Genes, proteins, chemicals, diseases, species, mutations and cell lines named across the full text — each resolved to its canonical identifier and authoritative record.
Click any figure to enlarge with its caption.
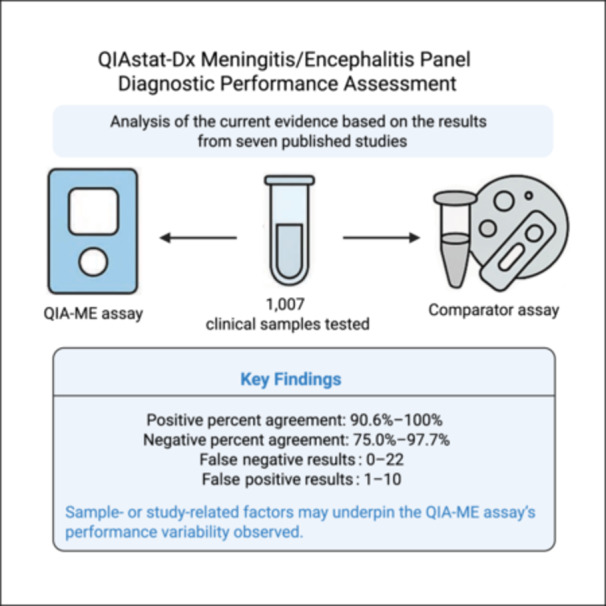 Figure 1
| Author name, year | Country | Type (no.) of samples tested | Targets detected across tested samples | Comparator method used per target type | Parameters used for the assay evaluation | ||||||||
|---|---|---|---|---|---|---|---|---|---|---|---|---|---|
| Positive percent agreement | Negative percent agreement | ||||||||||||
| Bacterial | Viral | Fungal | TP/(TP + FN) | % | 95% CI | TN/(TN + FP) | % | 95% CI | |||||
| Le Bars et al. | France | CSF (5) |
Bacterial: Nme, Spn Viral: HSV‐2, HPeV, VZV | Culture | PCR assays | — | 5/5 | 100 | 56.5–100 | — | — | — | |
| Humisto et al. | Finland | CSF (61) |
Bacterial: Hin, Lmo, Nme, Sag, Spn Viral: EV, HHV‐6, HPeV, HSV‐1, HSV‐2, VZV Fungal: Cne/Cga | Culture | PCR assays | Antigen testing and/or microscopy | 58/61 | 95.1 | 86.5–98.3 | — | — | — | |
| Sundelin et al. | Germany, France, Denmark | CSF (585) |
Bacterial: Eco, Hin, Lmo, Nme, Sag, Spn Viral: EV, HHV‐6, HPeV, HSV‐1, HSV‐2, VZV Fungal: Cne/Cga | PCR assay | PCR assay | PCR assay | 135/146 | 92.5 | 87.0–95.7 | 429/439 | 97.7 | 95.9–99.8 | |
| Boers et al. | The Netherlands | CSF (106) |
Bacterial: Eco, Hin, Lmo, Nme, Sag, Spn, Spy Viral: EV, HHV‐6, HPeV, HSV‐1, HSV‐2, VZV Fungal: Cne/Cga | Culture and/or PCR assays | PCR assays | Antigen testing and/or culture | 98/106 | 92.4 | 85.8–96.1 | — | — | — | |
| Cuesta et al. | Spain | CSF (50) |
Bacterial: Lmo, Nme, Sag, Spn Viral: HHV‐6, HSV‐1, HSV‐2, VZV | Culture and/or antigen testing | PCR assays | — | 27/28 | 96.4 | 82.3–99.4 | 21/22 | 95.4 | 78.2–99.2 | |
| Vizcarra et al. | Bolivia | CSF (30) |
Bacterial: Eco, Hin, Lmo, Nme, Sag, Spn, Spy Fungal: Cne/Cga | Culture and/or antigen testing, and/or PCR assay | — | Antigen testing and/or microscopy | 26/26 | 100 | 86.7–100 | 3/4 | 75.0 | 28.8–96.1 | |
| Gabrielli et al. | Italy | CSF (170) |
Bacterial: Hin, Lmo, Nme, Sag, Spn, Spy Viral: EV, HHV‐6, HPeV, HSV‐1, HSV‐2, VZV Fungal: Cne/Cga | Culture and/or antigen testing | PCR assays | Antigen testing and/or microscopy | 154/170 | 90.6 | 85.3–94.1 | — | — | — | |
| Type of pathogen (acronym) | No. of true positives/(true positives + false negatives) | ||||||
|---|---|---|---|---|---|---|---|
| Le Bars, 2023 | Humisto, 2023 | Sundelin, 2023 | Boers, 2024 | Cuesta, 2024 | Vizcarra, 2025 | Gabrielli, 2025 | |
|
| |||||||
|
| — | — | 1/1 | 1/1 | — | 3/3 | — |
|
| — | 2/2 |
| 7/7 | — | 2/2 | 1/1 |
|
| — | 5/5 | 1/1 |
| 3/3 | 5/5 | 2/2 |
|
| 1/1 | 1/1 | 1/1 | 10/10 | 1/1 | 5/5 | 3/3 |
|
| 6/6 | 3/3 | 1/1 | 2/2 | 1/1 | 2/2 | |
|
| 1/1 | 6/6 |
|
| 5/5 | 7/7 | 9/9 |
|
| — | — | — | 3/3 | — | 1/1 | 1/1 |
|
| |||||||
| Enterovirus (EV) | — | 6/6 |
| 24/24 | 1/1 | — |
|
| Human herpesvirus 6 (HHV‐6) | — |
|
| 3/3 | 2/2 | — |
|
| Human parechovirus (HPeV) | 1/1 | 4/4 | — | 5/5 | — | — | 2/2 |
| Herpes simplex virus 1 (HSV‐1) | — |
| 20/20 | 6/6 |
| — |
|
| Herpes simplex virus 2 (HSV‐2) | 1/1 |
|
| 4/4 | 4/4 | — | 15/15 |
| Varicella‐zoster virus (VZV) | 1/1 | 6/6 |
| 11/11 | 3/3 | — |
|
|
| |||||||
|
| — | 1/1 | 1/1 |
| — | 2/2 | 2/2 |
| Total pathogens tested | 5/5 | 58/61 | 135/146 | 98/106 | 27/28 | 26/26 | 156/178 |
| Type of pathogen (acronym) | No. of true positives/(true positives + false negatives) | |||||
|---|---|---|---|---|---|---|
| Le Bars, 2023 | Humisto, 2023 | Cuesta, 2024 | ||||
| QIA‐ME | FA‐ME | QIA‐ME | FA‐ME | QIA‐ME | FA‐ME | |
|
| ||||||
|
| — | — | — | — | — | — |
|
| — | — | 2/2 | 3/3 | — | — |
|
| — | — | 5/5 | 5/5 | 3/3 | 3/3 |
|
| 1/1 | 1/1 | 1/1 | 1/1 | 1/1 | 1/1 |
|
| 6/6 | 6/6 | 2/2 | 2/2 | ||
|
| 1/1 | 1/1 | 6/6 |
| 5/5 |
|
|
| ||||||
| Enterovirus (EV) | — | — | 6/6 | 6/6 | 1/1 | 1/1 |
| Human herpesvirus 6 (HHV‐6) | — | — |
|
| 2/2 | 2/2 |
| Human parechovirus (HPeV) | 1/1 | 1/1 | 4/4 | 4/4 | — | — |
| Herpes simplex virus 1 (HSV‐1) | — | — |
|
|
|
|
| Herpes simplex virus 2 (HSV‐2) | 1/1 | 1/1 |
|
| 4/4 | 4/4 |
| Varicella‐zoster virus (VZV) | 1/1 | 1/1 | 6/6 | 6/6 | 3/3 | 3/3 |
|
| ||||||
|
| — | — | 1/1 | 1/1 | — | — |
| Total pathogens tested | 5/5 | 5/5 | 58/61 | 58/62 | 27/28 | 23/27 |
- —The authors received no specific funding for this work.
Peer Reviews
No public reviews on file for this paper yet. If you reviewed it on a platform where reviews are public (OpenReview, ICLR, NeurIPS, ICML), you can paste yours below so the community can read it here.
Videos
No videos yet. Explain this paper in a talk, walkthrough, or lecture? Add one.
Taxonomy
TopicsBacterial Infections and Vaccines · Multiple Sclerosis Research Studies · Sinusitis and nasal conditions
Introduction
1
Infectious meningitis and encephalitis are life‐threatening neurological syndromes requiring prompt diagnosis and targeted treatment (Thy et al. 2022; Granerod et al. 2023). A wide range of bacterial, viral, and fungal pathogens may be involved, often with overlapping clinical features. To overcome the limitations of traditional diagnostic workflows (Vetter et al. 2020), syndromic molecular panels have emerged, enabling the simultaneous detection of multiple central nervous system (CNS) pathogens in a single, rapid assay (Couturier and Bard 2019; Dien Bard and McElvania 2020; Olie et al. 2024).
Since its FDA clearance in 2015, the BioFire® FilmArray® Meningitis/Encephalitis Panel (bioMérieux, Marcy l’Étoile, France)—hereafter referred to as FA‐ME—has become widely used in clinical settings. It targets 14 pathogens: six bacteria (Escherichia coli K1, Haemophilus influenzae, Listeria monocytogenes, Neisseria meningitidis, Streptococcus agalactiae, and Streptococcus pneumoniae), seven viruses (cytomegalovirus, enterovirus, herpes simplex virus 1 and 2, human herpesvirus 6, human parechovirus, and varicella‐zoster virus), and one fungus (Cryptococcus neoformans/Cryptococcus gattii).
In 2022, a second assay—the QIAstat‐Dx Meningitis/Encephalitis Panel (QIAGEN GmbH, Hilden, Germany), hereafter referred to as QIA‐ME—entered the European market. The assay is CE‐IVD marked for in vitro diagnostic use in Europe. This 15‐target assay includes eight bacteria (the same six as FA‐ME, plus Mycoplasma pneumoniae and Streptococcus pyogenes), six viruses (excluding cytomegalovirus), and C. neoformans/C. gattii. A key differentiating feature is that QIA‐ME provides semiquantitative data, including amplification curves and threshold cycle (Ct) values. The QIA‐ME assay subsequently received FDA clearance in November 2024, marking its approval for clinical use in the United States, although limited to only nine microbial targets (https://www.accessdata.fda.gov/cdrh_docs/reviews/K242256.pdf).
While both assays aim to improve early diagnosis of CNS infections, uncertainties remain regarding their optimal use in clinical practice (Diallo et al. 2021; Vaugon et al. 2022). Limitations in analytical performance, risks of false positives, and challenges in interpreting certain viral detection results have raised questions about their actual impact (Vetter et al. 2020; Subedi et al. 2025). Compared to FA‐ME, QIA‐ME has been less extensively studied, particularly in real‐world settings.
This review aims to provide a comprehensive assessment of current evidence on the QIA‐ME assay, including study designs, comparator methods, and diagnostic performance metrics, and to explore its emerging role alongside the earlier FA‐ME assay in the diagnostic laboratory.
Methods
2
A literature search was conducted to identify relevant studies evaluating the diagnostic performance of the QIAstat‐Dx Meningitis/Encephalitis (QIA‐ME) Panel assay. The following search string was used across Scopus and PubMed databases: (“QIAstat‐Dx” OR “QIAstat Dx” OR “QIAstat”) AND (“Meningitis” OR “Encephalitis”) AND (“Panel” OR “Syndromic test” OR “Molecular diagnostic”). No date restrictions were applied. Only articles published in English and reporting original data on the use of the QIA‐ME assay were included. Conference abstracts, case reports, and review articles were excluded.
This was not a systematic review. Rather, we adopted a narrative approach to allow flexibility in analyzing a heterogeneous body of literature on QIA‐ME performance. Although the initial search strategy employed structured queries in Scopus and PubMed, no formal protocol was preregistered, and PRISMA guidelines were not followed. Studies were selected based on their relevance to the topic and manually screened for eligibility. Full texts were reviewed to extract information on study design, patient populations, comparator methods, and diagnostic performance metrics. The choice of a narrative format reflects the variability across available studies in terms of patient sample number, comparator methods, and pathogen coverage. While this approach facilitates a broader contextual analysis, it may introduce selection bias and limits the reproducibility of the review process. These methodological aspects should be considered when interpreting the findings and the generalizability of the conclusions.
The Scopus search (years 2022–2025) yielded 46 records. Of these, nine articles were considered potentially eligible, along with two related commentaries on the study by Cuesta et al. (2024), one of the articles included in our review. These comprise a published comment and the authors' subsequent reply, both of which will be discussed below. Two articles were excluded: Kyaw et al. (2024) and Şahin et al. (2025). Although both reported results of the QIA‐ME assay on CSF samples analyzed prospectively (Kyaw et al. 2024) or retrospectively (Şahin et al. 2025) to identify infectious causes of suspected meningitis or encephalitis, neither study included a comparative evaluation. Therefore, they were excluded. The PubMed search (years 2022–2025) identified eight records. Of these, 8 were considered potentially eligible. One article—Kyaw et al. (2024), also retrieved in Scopus—was excluded for the same reason as above. Finally, seven articles retrieved from both searches were included in the study.
When not explicitly reported, positive percent agreement (PPA) and negative percent agreement (NPA) were calculated from available data on true positives (TP), false negatives (FN), true negatives (TN), and false positives (FP). Results from the QIA‐ME and/or the FA‐ME assay were considered TP or TN when concordance was observed with the comparator method. Conversely, results from the QIA‐ME and/or FA‐ME assay were classified as FN or FP in cases of discordance, depending on whether the assay yielded a negative or positive result, respectively, that was not confirmed by the comparator method. For consistency, confidence intervals (CIs) for PPA and NPA were calculated using the Wilson score method (SPSS Statistics version 24.0, IBM Corp.). In articles reporting only concordance rates or incomplete data, agreement values were recalculated or estimated based on the available information, as specified in the Table 1 footnotes and described in Section 3.
While concordance generally refers to the overall agreement between two methods, PPA and NPA provide a more granular assessment of assay performance, specifically in positive and negative cases. In this review, PPA and NPA were prioritized to ensure a standardized and clinically meaningful summary of assay performance. However, in two of the articles included in this review (Cuesta et al. 2024; Vizcarra et al. 2025), concordance was also formally assessed using Cohen's kappa coefficient, which adjusts for agreement expected by chance. In contrast, our comparative analysis focused on recalculated PPA and NPA values wherever possible, to ensure consistent interpretability across studies.
Results
3
Studies Evaluating the QIA‐ME Assay: Design and Comparators
3.1
The literature search identified seven studies published between 2023 and 2025 (Le Bars et al. 2023; Humisto et al. 2023; Sundelin et al. 2023; Boers et al. 2024; Cuesta et al. 2024; Vizcarra et al. 2025; Gabrielli et al. 2025), following the introduction of the QIA‐ME assay into the European market. These studies, all reporting original data on the use of the QIA‐ME assay, are summarized in Table 1 and listed according to their chronological publication dates: March 2023, April 2023, September 2023, January 2024, April 2024, January 2025, and April 2025, respectively.
All included studies retrospectively evaluated archived CSF samples that had been previously aliquoted and stored frozen until QIA‐ME testing. These samples were collected from patients with clinical suspicion of meningitis or encephalitis and had already undergone diagnostic workup using routine laboratory methods. Accordingly, most samples had been classified as positive—or, in some studies, negative—based on laboratory‐developed tests, commercial molecular assays (e.g., PCR‐based assays), or conventional microbiological methods (e.g., antigen testing)—together defined as standard of care (SoC)—used as reference methods. In certain studies, the comparator method consisted solely of the FA‐ME panel, while others employed a combination of FA‐ME with culture and/or other molecular assays (see footnotes to Table 1 for details).
When a direct head‐to‐head comparison between QIA‐ME and FA‐ME was made, the results are reported separately in Section 3.4. This distinction clarifies the QIA‐ME assay's diagnostic performance relative to the SoC and identifies studies with formal comparative evaluations.
Diagnostic Performance of the QIA‐ME Assay Across All Pathogens Evaluated
3.2
A total of 1007 clinical CSF samples were analyzed across the seven studies included in this review. The number of samples tested per study ranged from 5 in the pilot evaluation by Le Bars et al. (2023) to 585 in the multicenter study by Sundelin et al. (2023), which currently represents the most extensive assessment of the QIA‐ME assay.
The number of pathogen targets evaluated varied across studies, depending on the availability of positive samples for each target. Between 8 and 14 targets were assessed per study, typically covering common bacterial and viral pathogens, with five studies also including fungal pathogens.
PPA values were reported in all studies, ranging from 90.6% to 100%, depending on the pathogens and comparator methods employed. These methods included culture, antigen testing, microscopy, and PCR‐based assays, either alone or in combination. In contrast, NPA values were available in only three studies, ranging from 75.0% to 97.7%.
FP results were reported in four of the seven studies. Sundelin et al. (2023), comparing QIA‐ME to FA‐ME, identified 10 FP results: 2 each for H. influenzae (Hin), human herpesvirus 6 (HHV‐6), herpes simplex virus 2 (HSV‐2), and varicella‐zoster virus (VZV), plus 1 each for human enterovirus (EV) and S. pneumoniae (Spn). However, using SoC results, 5 of these 10 cases were reclassified as TP results: 2 HSV‐2, 1 HHV‐6, 1 EV, and 1 Spn. Boers et al. (2024), using SoC as comparator, reported 1 FP result for VZV in a sample that was TP for S. pyogenes (Spy), with corresponding Ct values of 35.9 (VZV) and 20.9 (Spy). Similarly, Cuesta et al. (2024) found 1 FP result involving VZV (Ct 38.5), consistent with a prior diagnosis of VZV encephalitis made 15 days earlier. A single FP result was also reported in the study by Vizcarra et al. (2025), where Hin was detected by QIA‐ME (Ct 30.6 in a 1:3 diluted CSF sample), but not by culture or FA‐ME. Notably, Hin was isolated from blood cultures collected around the same time, and the patient responded to ceftriaxone‐targeted therapy. This case suggests that QIA‐ME may have detected a true CNS infection not captured by the comparator methods.
Table 1 summarizes the sample sizes, pathogens tested, comparator methods, and diagnostic performance metrics of the QIA‐ME assay across all studies included.
Diagnostic Performance of the QIA‐ME Assay by Single Pathogens Evaluated
3.3
FN results were reported in five of the seven studies included. No FN results were observed in the studies by Le Bars et al. (2023) and Vizcarra et al. (2025).
Among bacterial pathogens, S. pneumoniae (Spn) was not detected in 2 of 17 positive samples (11.8%) in the study by Sundelin et al. (2023), and in 1 of 11 positive samples (9.1%) in the study by Boers et al. (2024). Additional FN results were reported for H. influenzae (Hin) and L. monocytogenes (Lmo): 1 of 5 positive samples (20.0%) for Hin in Sundelin et al. (2023), and 1 of 7 positive samples (14.3%) for Lmo in Boers et al. (2024).
Among viral pathogens, FN results were mainly observed in the studies by Humisto et al. (2023), Sundelin et al. (2023), and Gabrielli et al. (2025), with only one FN result reported by Cuesta et al. (2024). Human herpesvirus 6 (HHV‐6) and herpes simplex virus 1 (HSV‐1) showed the highest number of FN results, with 9 each: 1 in Humisto et al. (2023), 1 in Sundelin et al. (2023), and 7 in Gabrielli et al. (2025) for HHV‐6; and 1 in Humisto et al. (2023), 1 in Cuesta et al. (2024), and 7 in Gabrielli et al. (2025) for HSV‐1. These were followed by varicella‐zoster virus (VZV) with 7 FN results—3 in Sundelin et al. (2023) and 4 in Gabrielli et al. (2025); human enterovirus (EV) with 6 FN results—2 in Sundelin et al. (2023) and 4 in Gabrielli et al. (2025); and herpes simplex virus 2 (HSV‐2) with 3 FN results—1 in Humisto et al. (2023) and 2 in Sundelin et al. (2023). In the study by Sundelin et al. (2023), using SoC results, 4 of the 11 FN results were reclassified as TN results: 2 Spn, 1 Hin, and 1 EV.
Regarding C. neoformans/C. gattii (Cne/Cga), FN results were reported only by Boers et al. (2024), with six cases.
A detailed summary of FN results by pathogen and study is provided in Table 2.
QIA‐ME Versus FA‐ME: A Head‐to‐Head Comparison Analysis
3.4
In three of the seven studies included in this review, QIA‐ME and FA‐ME assays were directly compared by testing the same set of CSF samples, which had been pre‐classified as positive for specific pathogens based on reference methods independently defined in each study. Overall, a substantial concordance was observed between the two assays across all evaluated targets. While no difference was reported in the study by Le Bars et al. (2023), in the study by Humisto et al. (2023), one S. pneumoniae (Spn) false‐negative (FN) result occurred with the FA‐ME assay, whereas QIA‐ME correctly detected the pathogen. Similarly, in the study by Cuesta et al. (2024), FA‐ME failed to detect Spn in one sample that tested positive with QIA‐ME and showed three FN results for herpes simplex virus 1 (HSV‐1), while QIA‐ME reported only one FN result for the same target, which occurred in the same sample as one of the FA‐ME FN results.
While Table 3 summarizes the number of TP and FN results for each assay in these head‐to‐head comparisons, a detailed analysis of results from the study by Cuesta et al. (2024) revealed additional targets detected by the FA‐ME assay in several samples that were not captured by QIA‐ME. This occurred in three samples that tested concordantly positive with both assays, in which FA‐ME additionally detected the following pathogens: (i) HSV‐1, herpes simplex virus 2 (HSV‐2), H. influenzae (Hin), and Spn in one sample that was positive for S. agalactiae (Sag); (ii) Sag in one sample that was positive for HSV‐2; and (iii) HSV‐1 in one sample that was positive for varicella‐zoster virus (VZV).
In addition, nine samples yielded FP results with FA‐ME: seven were positive for HSV‐1, while two showed multiple pathogens. Specifically, one of these two samples was positive for Hin, Spn, and cytomegalovirus, and the other for E. coli K1 and Sag.
Discussion
4
Diagnostic Performance of the QIA‐ME Assay and Inter‐Study Variability
4.1
Our analysis of the available literature on the diagnostic performance of the QIA‐ME panel—a newer syndromic molecular assay compared to the earlier FA‐ME—highlights key findings that may inform its role in the meningitis/encephalitis diagnostic workflow. The QIA‐ME panel includes 15 microbial targets (excluding cytomegalovirus) and generally showed PPA and NPA values above 90%, indicating excellent performance. An exception was the study by Vizcarra et al. (2025), where NPA was substantially lower. The number of false‐negative (FN) and false‐positive (FP) results varied considerably across studies, ranging from 0 to 22 FNs and 1 to 10 FPs. Gabrielli et al. (2025) and Sundelin et al. (2023) reported the highest FN and FP counts, respectively. Notably, Boers et al. (2024) reported FN results for fungal pathogens (6 out of 13 positives), and this was the only study with a sufficiently large sample size for C. neoformans. These findings suggest that study‐specific or sample‐related factors may contribute to the variability in QIA‐ME performance.
A possible explanation for the difference in performance metrics across studies lies in the heterogeneity of study sample sizes. For instance, Vizcarra et al. (2025) reported an NPA of 75.0% based on only three TNs out of four total negative CSF samples, which is clearly a limited data set. In contrast, Sundelin et al. (2023) reported a much higher NPA of 97.7%, calculated from 439 CSF samples including 10 FPs. This comparison highlights how small sample sizes can skew performance estimates, reinforcing the need to interpret PPA and NPA values in the context of the data set's scale.
Importantly, the QIA‐ME assay received FDA 510(k) clearance following a multicenter evaluation that included both United States and European sites. It is plausible that the European component of this evaluation corresponded to the centers included in Sundelin et al. (2023). Further supporting the robustness of that study, Sundelin et al. also performed a discordant result analysis that led to the reclassification of nearly half of the initial FP and FN results, thereby improving the reliability of their estimates.
Another source of inter‐study variability is the type of comparator method used. For example, Gabrielli et al. (2025) reported as many as 22 FNs for viral targets. That study excluded CSF samples that tested negative for all pathogens and relied on singleplex PCR assays rather than multiplex PCR assays as the reference standard. Such differences in comparator assay format and analytical sensitivity may have influenced the number of FN results observed.
Head‐to‐Head Comparisons of QIA‐ME With the FA‐ME Assay
4.2
Additional support for the diagnostic reliability of the QIA‐ME assay comes from studies that conducted head‐to‐head comparisons with the FA‐ME assay, in which both assays were applied to the same set of CSF samples and evaluated against a common reference method. The limited variation in performance metrics between the two assays across these studies reinforces the reliability of QIA‐ME. For this reason, we focused on the subset of studies (n = 3; see Table 3, Section 3.4 of the Results) that included such comparisons (Le Bars et al. 2023; Humisto et al. 2023; Cuesta et al. 2024). Among them, the study by Cuesta et al. (2024) was further discussed in a commentary by Paranhos‐Baccalà et al. (2024), who advocated for the continued relevance of the FA‐ME assay. Interestingly, their argument drew on data from Sundelin et al. (2023), one of the most comprehensive QIA‐ME/FA‐ME performance evaluations to date, which actually demonstrated strong overall agreement between QIA‐ME and FA‐ME. This observation, rather than weakening the role of QIA‐ME, highlights its diagnostic reliability and consistency across different settings and comparators. It thus supports its adoption as a reliable alternative to the FA‐ME assay in routine clinical practice.
A closer look at pathogen‐specific performance highlights how certain viral targets, such as HHV‐6 or HSV‐1, were more frequently associated with false‐negative (FN) results. HSV‐1 yielded FNs in three of the included studies: Humisto et al. (2023), Cuesta et al. (2024), and Gabrielli et al. (2025). In Humisto and Cuesta—both of which conducted head‐to‐head comparisons—FN results for HSV‐1 showed complete concordance between assays, with 9/10 FNs shared in Humisto and 6/7 versus 4/7 missed by QIA‐ME and FA‐ME, respectively, in Cuesta. These findings suggest that HSV‐1 detection may be a shared diagnostic challenge. By contrast, Sundelin et al. (2023) reported perfect detection of HSV‐1 (20/20 cases), further highlighting inter‐study variability and the possible influence of sample characteristics or methodological differences.
As noted in the commentary by Paranhos‐Baccalà et al. (2024), the higher HSV‐1 positivity rate observed with the QIA‐ME assay compared to the FA‐ME assay in the study by Cuesta et al. (2024) may reflect a nonrepresentative cohort—characterized by a large proportion of immunosuppressed patients, frequent CSF samples with normal or minimally altered biochemistry, and possible HSV‐1 reactivation or contamination from traumatic lumbar punctures—all factors that may increase the risk of false‐positive results. In their reply, Cuesta et al. (2024a) speculated that the ability to visualize the amplification curve and its corresponding Ct value with the QIA‐ME assay might help mitigate this risk and improve result interpretation, particularly in borderline cases. They emphasized that this visualization goes beyond the Ct value alone and includes the shape of the amplification curve, which can provide important clues to the reliability of signal detection.
While the commentary by Paranhos‐Baccalà et al. (2024) noted that a similar functionality is now available for the FA‐ME assay through the newly introduced BioFire FIREWORKS application, the broader discussion underscores how the integration of semi‐quantitative or kinetic amplification data may enhance the clinical contextualization of molecular results (Candel et al. 2024). In particular, access to C t values and amplification curves allows clinical microbiologists to differentiate between true infections and potential contamination or latent viral shedding, especially when interpreting low‐level positive results. This added granularity may be especially helpful in immunocompromised patients or in cases where pathogens such as HHV‐6 are detected, for which clinical significance can be ambiguous (Vetter et al. 2020; Smit et al. 2025). Integrating such data into the clinical workflow supports more informed diagnostic decisions and could mitigate the risks of overtreatment or misinterpretation, particularly in the context of low‐prevalence targets or unexpected findings (Candel et al. 2024; Subedi et al. 2025).
Clinical Relevance of Low‐Prevalence Targets in the QIA‐ME Assay
4.3
The clinical utility of any multiplex PCR assay depends largely on the epidemiological relevance of its targets. From this perspective, the decision to remove cytomegalovirus (CMV) from the QIA‐ME assay and introduce M. pneumoniae (Mpn) and S. pyogenes (Spy) deserves careful consideration (Thomson and Bertram 2001; Razonable et al. 2020). Ideally, such modifications should be guided by real‐world diagnostic needs rather than by marketing‐driven differentiation from competing assays. Notably, through the clinical studies reviewed, none reported positive detections for Mpn (see Tables 1 and 2). Sundelin et al. (2023) attempted to address this by including a large number of contrived samples (data not shown) to assess the QIA‐ME assay's analytical performance for low‐prevalence targets. As for Spy, it was detected in only three studies—Boers et al. (3/3 positives), Vizcarra et al. and Gabrielli et al. (1/1 positive each)—within study cohorts of 106, 30, and 170 CSF samples, respectively.
These findings raise important questions about the value of including low‐prevalence pathogens in routine syndromic testing. While Mpn and Spy may be relevant in specific settings—such as pediatric populations or during outbreaks—their inclusion in broad‐range panels requires strong justification. In this regard, Humisto et al. (2023) acknowledged that although their study did not test for Mpn or Spy, broader use of rapid molecular assays might help uncover pathogens in otherwise undiagnosed cases. However, this comes with potential risks, particularly the possibility of increased false‐positive results.
Cross‐reactivity is a known issue that can reduce specificity. For example, Cutibacterium acnes or Mycoplasma genitalium might yield false‐positive Mpn signals, while Haemophilus haemolyticus could mimic Haemophilus influenzae. Additionally, the detection of certain viruses (e.g., HHV‐6) may reflect latent or noncausal infections rather than active disease. As noted by Humisto et al. (2023), these issues highlight the importance of cautious, context‐aware interpretation of results—especially for rare targets with uncertain clinical significance. A prospective, real‐world evaluation of QIA‐ME performance in both general and high‐risk populations (e.g., patients with HIV or transplant recipients) would be valuable to better define the diagnostic impact of these uncommon targets and guide their integration into clinical workflows.
Clinical Interpretability and Potential Impact of the QIA‐ME Assay
4.4
The included studies were highly heterogeneous in terms of patient sample size, comparator methods, and pathogen coverage. This heterogeneity limits comparability across studies and affects the generalizability of the findings. Despite these limitations, some shared elements support a reasoned reflection on the potential clinical implications of implementing the QIA‐ME assay.
The multiplex format may particularly benefit patients at high risk for rapid clinical deterioration or with broad differential diagnoses, such as neonates, immunocompromised individuals, or patients in intensive care settings (Candel et al. 2024; Smit et al. 2025). In these populations, a fast and broad diagnostic approach may support earlier pathogen detection and inform prompt treatment decisions.
However, the risk of false‐negative or false‐positive results must be carefully weighed. Missed diagnoses may lead to delayed or inappropriate treatment, whereas unexpected detections—especially of low‐prevalence or low‐pathogenicity targets—can result in unnecessary therapies. The interpretation of such findings should be contextualized by clinical microbiologists, considering amplification curve characteristics, local epidemiology, and clinical plausibility.
In this context, the availability of Ct values and amplification curves, as provided by the QIA‐ME assay, may offer a key advantage for experienced laboratories. These data allow more nuanced interpretation of borderline or clinically ambiguous results, potentially supporting antimicrobial stewardship efforts (Subedi et al. 2025).
While the added value of a negative result is clear for common pathogens—helping to rule out treatable infections and avoid unnecessary antibiotics—its clinical interpretation becomes more uncertain when negative findings lead to treatment de‐escalation in the absence of other supporting data (Vetter et al. 2020; Smit et al. 2025). Many pathogens that can cause CNS infections are not currently covered by multiplex assays (Olie et al. 2024), which further limits their standalone use.
Therefore, the real‐world clinical utility of QIA‐ME should be assessed through prospective studies in specific care settings such as emergency departments, intensive care units, and resource‐limited environments (Candel et al. 2024; Milburn et al. 2024). In these contexts, rapid and user‐friendly assays may facilitate early diagnosis, although the actual impact on antimicrobial use or clinical outcomes may be limited. For instance, over 20 prospective studies have evaluated the clinical utility of FA‐ME, often demonstrating benefits like faster time to targeted therapy or shorter stay in the intensive care unit—but these advantages were mostly linked to positive results (Smit et al. 2025). As noted by Vetter et al. (2020), current evidence does not support multiplex PCR assays (e.g., FA‐ME) as standalone tools for routine clinical care. Accordingly, the clinical value of QIA‐ME—including its potential to reduce inappropriate treatment or unnecessary hospitalization—remains to be demonstrated through similar prospective studies.
Concluding Remarks
4.5
This narrative review has intrinsic limitations. We reanalyzed the testing results study by study, focusing exclusively on clinical CSF samples, which were used in all included studies. However, differences in study design, inclusion criteria, and comparator methods limit the direct comparability of the findings. In some studies, only SoC‐positive samples were tested using multiplex PCR assays (QIA‐ME, FA‐ME, or others), introducing potential selection bias. Additionally, the definitions of true and false results varied, with reference methods ranging from singleplex to other multiplex PCR assays or even clinical adjudication. Nonetheless, we aimed to highlight consistent trends by prioritizing data from head‐to‐head comparisons and studies with clearly reported results from clinical samples.
Despite the limited number of available studies, our analysis of clinical CSF samples supports the use of the QIA‐ME assay as a diagnostic tool for meningitis/encephalitis. Its performance appears comparable to that of the FA‐ME assay, although target‐specific limitations persist. Further real‐world data are warranted to guide optimal assay selection and the clinical interpretation of results.
Author Contributions
Flora Marzia Liotti: conceptualization (lead), writing – original draft (supporting), formal analysis (lead), writing – review and editing (equal). Brunella Posteraro: conceptualization (lead), writing – original draft (lead), formal analysis (supporting), writing – review and editing (equal). Maurizio Sanguinetti: conceptualization (supporting), writing – review and editing (equal). Giulia De Angelis: conceptualization (supporting), writing – original draft (supporting), formal analysis (supporting), writing – review and editing (equal).
Ethics Statement
The authors have nothing to report.
Conflicts of Interest
Some authors have received honoraria from bioMérieux (BioFire Diagnostics). The authors declare no conflicts of interest.
The reference list from the paper itself. Each links out to its DOI / PubMed record.
- 1Le Bars, H. , N. Madany , C. Lamoureux , et al. 2023. “Evaluation of the Performance Characteristics of a New POC Multiplex PCR Assay for the Diagnosis of Viral and Bacterial Neuromeningeal Infections.” Diagnostics 13, no. 6: 1110. 10.3390/diagnostics 13061110.36980418 PMC 10047878 · doi ↗ · pubmed ↗
- 2Boers, S. A. , R. van Houdt , N. M. van Sorge , et al. 2024. “A Multicenter Evaluation of the QI Astat‐Dx Meningitis‐Encephalitis Syndromic Test Kit as Compared to the Conventional Diagnostic Microbiology Workflow.” European Journal of Clinical Microbiology & Infectious Diseases 43, no. 3: 511–516. 10.1007/s 10096-024-04751-9.38206519 PMC 10917839 · doi ↗ · pubmed ↗
- 3Candel, F. J. , M. Salavert , R. Cantón , et al. 2024. “The Role of Rapid Multiplex Molecular Syndromic Panels in the Clinical Management of Infections in Critically Ill Patients: An Experts‐Opinion Document.” Critical Care 28, no. 1: 440. 10.1186/s 13054-024-05224-3.39736683 PMC 11687037 · doi ↗ · pubmed ↗
- 4Couturier, M. R. , and J. D. Bard . 2019. “Direct‐From‐Specimen Pathogen Identification.” Clinics in Laboratory Medicine 39, no. 3: 433–451. 10.1016/j.cll.2019.05.005.31383267 PMC 7131637 · doi ↗ · pubmed ↗
- 5Cuesta, G. , P. Puerta‐Alcalde , A. Vergara , et al. 2024 a. “Reply to Paranhos‐Baccalà et al. Comment on ‘Cuesta et al. An Assessment of a New Rapid Multiplex PCR Assay for the Diagnosis of Meningoencephalitis. Diagnostics 2024, 14, 802.’” Diagnostics 14, no. 17: 1885. 10.3390/diagnostics 14171885.39272670 PMC 11394559 · doi ↗ · pubmed ↗
- 6Cuesta, G. , P. Puerta‐Alcalde , A. Vergara , et al. 2024. “An Assessment of a New Rapid Multiplex PCR Assay for the Diagnosis of Meningoencephalitis.” Diagnostics 14, no. 8: 802. 10.3390/diagnostics 14080802.38667448 PMC 11048994 · doi ↗ · pubmed ↗
- 7Diallo, K. , V. F. Feteh , L. Ibe , et al. 2021. “Molecular Diagnostic Assays for the Detection of Common Bacterial Meningitis Pathogens: A Narrative Review.” E Bio Medicine 65: 103274. 10.1016/j.ebiom.2021.103274.33721818 PMC 7957090 · doi ↗ · pubmed ↗
- 8Dien Bard, J. , and E. Mc Elvania . 2020. “Panels and Syndromic Testing in Clinical Microbiology.” Clinics in Laboratory Medicine 40, no. 4: 393–420. 10.1016/j.cll.2020.08.001.33121611 PMC 7528880 · doi ↗ · pubmed ↗