GC–MS-based metabolome classification of sturgeon caviar and fish roe samples reveals unique caviar signatures, interspecies and gender variabilities
Nehal Ibrahim, Amira R. Khattab, Ashraf S. Mohammad, Montasser A. Al-Hammady, Iriny M. Ayoub, Mohamed A. Farag

TL;DR
This study uses GC–MS to analyze the metabolite profiles of caviar and fish roe from various species, revealing unique chemical signatures and gender-based differences.
Contribution
The first extensive GC–MS metabolite profiling of caviar and roe from 10 species, identifying 139 metabolites and gender-specific metabolic patterns.
Findings
Sturgeon caviar is distinguished by palmitic acid and cholesterol, while salmon roe is marked by serine and urea.
Male Charybdis natator roe is enriched in amino acids, whereas females have higher fatty metabolites.
S. officinalis roe is rich in γ-tocopherol and has a favorable n-3/n-6 ratio, suggesting functional food potential.
Abstract
Caviar/roe, widely valued in modern cuisine, is little characterized regarding its complete metabolite composition. Existing studies focused primarily on specific classes e.g., lipids and proteins. This study represents the first extensive GC–MS metabolite profiling of 48 caviar/roe samples from 10 commercially important taxa, including male and female aquatic animals. One hundred thirty-nine primary and secondary metabolites were identified and quantified belonging to fatty, amino, and organic acids, sugars, nitrogenous compounds, and steroids/terpenoids. Multivariate data analysis further uncovered clear interspecies and gender-specific metabolic differences. OPLS-DA highlighted palmitic acid and cholesterol as discriminative markers for sturgeon caviar, while serine and urea distinguished salmon roe. Gender differences were evident in Charybdis natator roe, with males enriched in…
Genes, proteins, chemicals, diseases, species, mutations and cell lines named across the full text — each resolved to its canonical identifier and authoritative record.
Click any figure to enlarge with its caption.
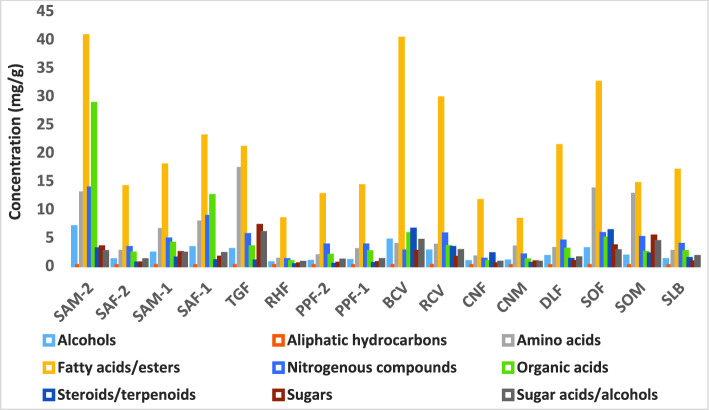 Figure 1
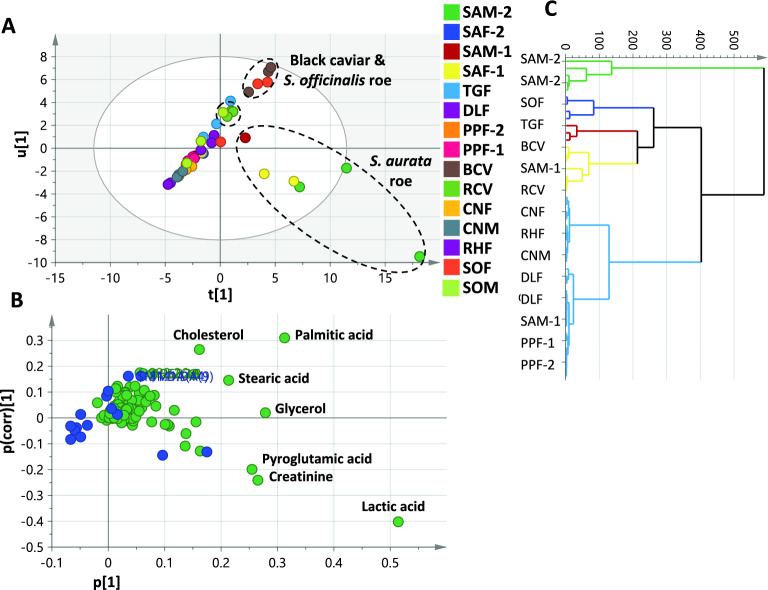 Figure 2
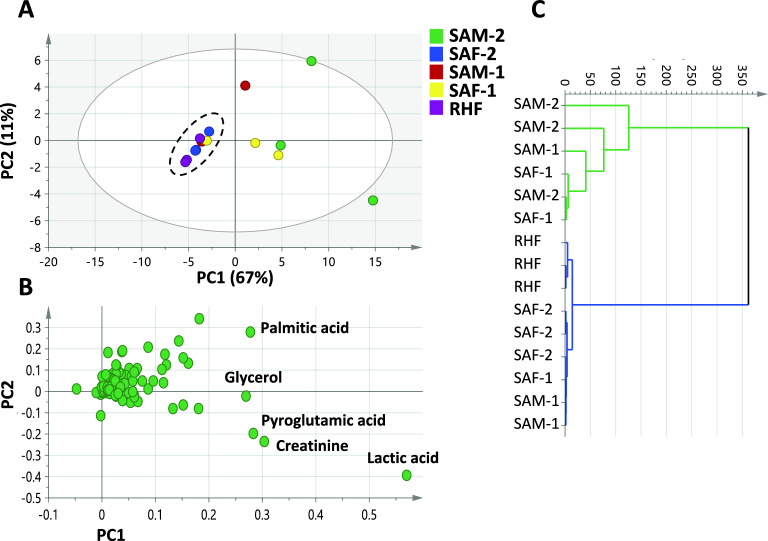 Figure 3
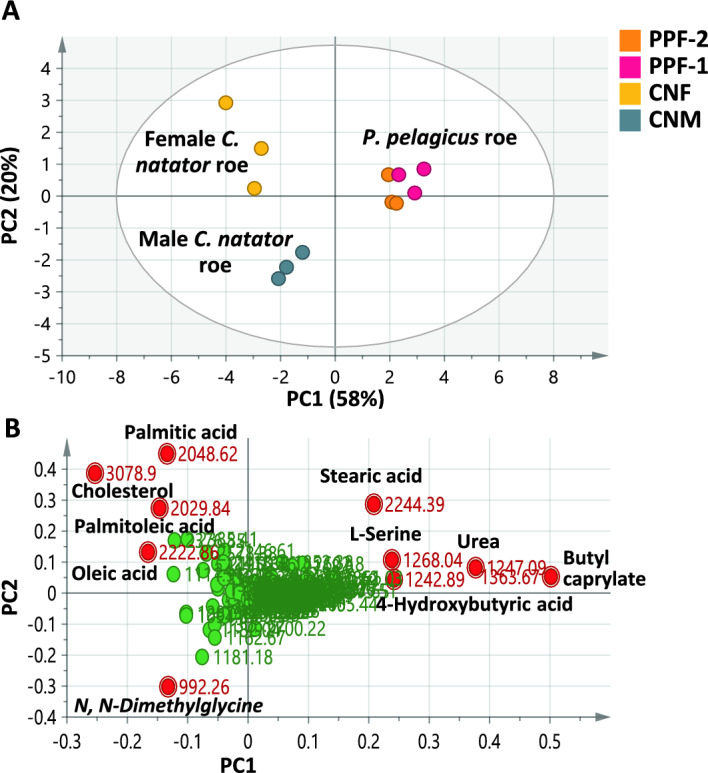 Figure 4
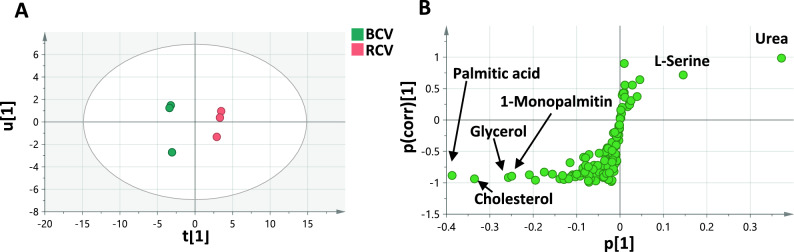 Figure 5
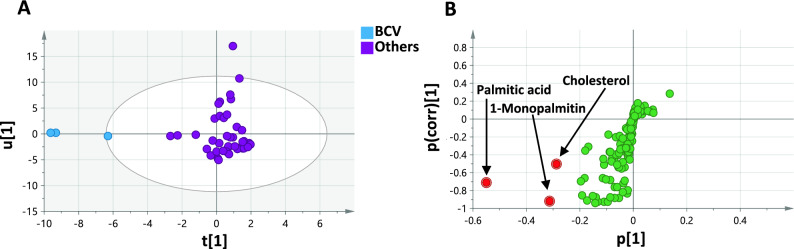 Figure 6
- —Ain Shams University
Peer Reviews
No public reviews on file for this paper yet. If you reviewed it on a platform where reviews are public (OpenReview, ICLR, NeurIPS, ICML), you can paste yours below so the community can read it here.
Videos
No videos yet. Explain this paper in a talk, walkthrough, or lecture? Add one.
Taxonomy
TopicsAquaculture Nutrition and Growth · Meat and Animal Product Quality · Metabolomics and Mass Spectrometry Studies
Introduction
Caviar is one of the finest seafood delicacies due to its sensory, socio-cultural, and nutritional properties. Genuine black caviar is the salt-cured roe of over 20 sturgeon fish species e.g., Huso huso, Acipenser gueldenstaedtii, A. stellatus, and A. baeri found primarily in the Black and Caspian seas. In contrast, inferior types include acipenseriformes paddlefish species Polyodon spathula^1,2^. The overexploitation of sturgeons for caviar production led to a dramatic decline in the wild sturgeon population, with almost all sturgeon species currently critically endangered^3^. Consequently, caviar supply was shifted from wild to farmed sturgeons to support the supply chain. Furthermore, roe from non-sturgeon species is widely used as a less costly caviar substitute and is preferentially named roe rather than caviar^1^.
A wide range of roe can be obtained from non-sturgeon species such as salmon roe referred to as red caviar which is the most popular caviar substitute, as well as trout, cod, and mullet roes^2^. Other aquatic animals are regarded as less common sources of roe including cephalopods as squid and cuttlefish, echinoderms as sea urchins, and crustaceans as shrimp and crab. Although black caviar is the most valued roe, the global consumption of roe from other aquatic species is higher considering the globalization of sushi culture. Of the 60,000 tons of fish roes produced annually, black caviar represents only 1%^4^.
Asides from its unique sensory traits triggered by its umami taste and desirable texture, caviar/roe is endowed with nutritive properties due to its high-quality protein rich in essential amino acids. Different amino acid profiles were reported in various roe types, with key amino acids as glycine, alanine, aspartic acid, and glutamic acid, with glutamic acid as a chief contributor to caviar/roe taste^5^. Despite the variable fatty acid profile in different roe types, there is generally a significant content of polyunsaturated fatty acids (PUFA), e.g. eicosapentaenoic and docosahexaenoic acids, which play a role in oxidative homeostasis and cardiometabolic health^1,6^. As a seafood, roe presents a favored source of n-3/n-6 PUFA ratio, which is a potential indicator of fat quality and can reach 20 in herring roe^7^. Meanwhile, several factors can affect the chemical makeup of roe, hence its bio-functional value and sensory characteristics, such as fish species, habitat, processing methods, and roe stage of maturity^1^.
Over the last decades, fish consumption increased worldwide at a significant rate that outpaced the population growth^8^. For many of the aquatic species consumed for their meat, roe is discarded or at best utilized as fish feed^9^. Considering that roe can reach up to 30% of the fish’s whole body mass, exploitation in the human diet capitalizes on fish resources, reduces waste and ecological burden, and identifies novel nutritious food^8^. Comprehensive biochemical profiling of roe is a prerequisite for prioritizing valuable roe sources of potential benefits or health hazards, if any.
The holistic mapping of food metabolome using large-scale analytical platforms represented by hyphenated mass spectrometry techniques, GC–MS or LC–MS, results in the generation of complex data matrices which are best harnessed by chemometric tools to reduce dimensionality, visualize differences, generate classification models, and discriminate between different groups^10,11^. Despite the potential impact of caviar/roe products on the modern international food market, few studies have described the variability of biochemical makeup among different types of fish roe employing single class analysis, namely lipids or proteins rather than the full metabolomic mapping in the analysis of fish roe^12,13^. Scarce reports have employed multivariate data analysis (MVA) mostly represented by principal component analysis (PCA) in fish roe classification, and relying on fatty acids class^14–16^, with less information on other nutrient classes potential in fish roe classification. A recent study implemented LC–MS with MVA tools to evaluate the impact of processing conditions on sturgeon caviar metabolome^17^. However, this study did not analyze non-sturgeon fish roe in comparison to sturgeon caviar.
The present study aimed to provide comprehensive GC–MS-based qualitative and quantitative metabolites profiling of caviar and roe from different marine organisms. Forty-eight roe samples were analyzed originating from different genotypes and genders belonging to 5 fishes, namely Oncorhynchus keta/O. gorbuscha, Huso/Acipenser species, Rhabdosargus haffara, Sparus aurata, and Dicentrarchus labrax, and five aquatic animals; Charybdis natator, Portunus pelagicus, Tripneustes gratilla, Sepia officinalis and Sepioteuthis lessoniana (Table 1). The study was designed to cover roe from various marine organisms of economic importance (food fish caught in large quantities) in comparison with genuine black caviar (BCV) and salmon roe (RCV). Family Sparidae (porgies) which holds notable commercial importance is represented here by one haffara seabream (R. haffara) roe sample originating from the Red Sea (RHF) and 4 gilt-head bream (S. aurata) roe samples obtained from the Mediterranean Sea and reflecting both male (SAM-1, SAM-2) and female fish (SAF-1, SAF-2). In addition, one European seabass (D. labrax) roe sample (DLF) was included to represent the temperate basses (Moronidae). European seabass is the most important commercial fish extensively cultured in the Mediterranean region. Crustaceans’ roe is exemplified by crab roe of family Portunidae including male and female ridged swimming crab; C. natator from the Red Sea (CNM, CNF) and the commercially popular blue swimming crab; P. pelagicus from the Mediterranean Sea (PPF-1, PPF-2). Among cephalopods, the common cuttlefish; S. officinalis and the bigfin reef squid; S. lessoniana are popular food items and a target of large-scale Mediterranean fisheries. Gender diversity in cephalopods roe was reflected by male and female S. officinalis specimens (SOM, SOF) and S. lessoniana roe (SLB). A roe sample from the collector urchin T. gratilla (TGF) represents echinoderms (Table 1). To provide insight into caviar/roe metabolome heterogeneity in the context of interspecies, gender-related, and infraspecific variability, different models of unsupervised and supervised chemometric tools were employed, exemplified by principal component analysis (PCA), hierarchical cluster analysis (HCA), and orthogonal partial least squares discriminant analysis (OPLS-DA). The implementation of GC–MS-based metabolomics to classify roe accessions in context to taxa and gender type originating from the Mediterranean and Red Sea, in comparison to black sturgeon caviar, is presented for the first time.Table 1. Roe samples for GC–MS-based metabolome analysis.Sample codeNameFamilySexSourceRCVOncorhynchus keta/O. gorbuscha (Salmon)SalmonidaeFemaleCommercialBCVHuso/Acipenser sp (Sturgeon)AcipenseridaeFemaleCommercialRHFRhabdosargus haffara (Haffara seabream)Sparidae (Porgies)FemaleRed SeaSAM-1Sparus aurata (Gilt-head bream)Sparidae (Porgies)MaleMediterranean SeaSAF-1FemaleSAM-2MaleSAF-2FemaleCNMCharybdis natator (Ridged swimming crab)PortunidaeMaleRed SeaCNFFemalePPF-1Portunus pelagicus (Blue swimming crab)FemaleMediterranean SeaPPF-2FemaleTGFTripneustes gratilla (Collector urchin)ToxopneustidaeFemaleRed SeaDLFDicentrarchus labrax (European seabass)Moronidae (Temperate basses)FemaleMediterranean SeaSOFSepia officinalis (Common cuttlefish)SepiidaeFemaleMediterranean SeaSOMMaleSLBSepioteuthis lessoniana (Bigfin reef squid)LoliginidaeMale and FemaleRed Sea
Materials and methods
Caviar and roe samples
Experiments were conducted under approval of the Ethics Committee for the use of animal subjects, Faculty of Pharmacy, Ain Shams University, Cairo, Egypt (approval number REC 413). Roe samples were collected from the fish landing sites in Alexandria, Mediterranean Sea; site 1 (Yacht and Boat Marina, Anfoshy, Alexandria, 31°12′37.41"N, 29°52′58.87"E) and Hurghada, Red Sea; site 2 (El-Saqala fishing area, Hurghada, 27°13′43.25"N, 33°50′33.16"E), Egypt. The collection sites are depicted in the Supplementary Fig. S1.
Two different fishing trawlers were used at the current study; one trawler was specific for fishing in the Red Sea and another one was approved for sailing and fishing in the Mediterranean Sea. These trawlers are owned by local fishermen, licensed by local authorities and are subject to inspection, health and occupational safety procedures. To ensure the application of fish handling ethics during fishing operations, whether in the Red Sea or the Mediterranean Sea, fishing methods were reviewed by the authors Ashraf S. Mohammad and Montasser A. Al-Hammady to ensure they were appropriate. The study was conducted in compliance with national guidelines (Law No.146 of 2021 for the Protection and Development of Lakes and Fisheries). Samples were caught at sunrise, the most suitable time for marine organisms to feed, from the designated fishing areas. After the capture, the organisms were left free on the vessel allowing them to calm down and acclimate to the outside environment. After using the anesthetic agent tricaine methanesulfonate (MS-222), in dose of 90–110 µg/mL^18^, they died in complete silence, as marine organisms are not handled or opened alive. The collected organisms were stored in a cool environment (refrigerator, ice). Sterile and suitable dissection tools were used to collect samples, and a researcher specialized in marine fisheries was used. Fish roes from different animals were lyophilized to complete dryness overnight and kept in air-tight glass vessels at −20 °C till further analysis.
Chemicals
N-Methyl-N- (trimethylsilyl)trifluoroacetamide (MSTFA) and xylitol were purchased from Sigma Aldrich (St. Louis, MO, U.S.A.). Alkane standard (C8-C40) and all other standards were purchased from Sigma Aldrich (St. Louis, MO, U.S.A.)
Sample preparation for GC–MS analysis
Primary metabolites were analyzed as described in^17,19^. Briefly, freeze-dried and finely powdered caviar and roe samples (100 mg) were extracted with 1 ml 100% methanol spiked with xylitol as an internal standard at 10 µg/ml with sonication for a 5 min period, then centrifuged at 12,000 rpm for 10 min to eliminate the debris. 100 µl were aliquoted from the methanol extract, evaporated to dryness under a stream of nitrogen gas till complete dryness. Derivatization was carried out using 150 μL of MSTFA at 60 °C for 45 min, followed by equilibration at 28 °C before GC–MS analysis.
GC–MS analysis
Samples were analyzed in triplicate under the same conditions. A Shimadzu QP-2010 gas chromatograph coupled to a mass spectrometer fitted with an Rtx-5MS column (30 m length, 0.25 μm film thickness, and 0.25 mm internal diameter) was used. A split mode with a 1:10 split ratio was used for injections under the following conditions: injector temperature set to 280 °C, column oven temperature was held at 70 °C for 3 min, then increased to 315 °C at a rate of 10 °C/min, and kept at 315 °C for 6 min. Helium was used as a carrier gas with a flow rate 1.24 mL/min. Interface and ion source temperatures were set to 280 °C and 180 °C, respectively. Electron ionization mode (EI, 70 eV) was employed with a scan range of m/z 35–500. Validation of GC–MS method has been previously reported^20^. Representative raw GC–MS data files are available through this shared drive link: https://drive.google.com/drive/folders/1eYqcipVWeQcniET_gh9UjKZaz079BBDv?usp=drive_link
Metabolites identification and absolute quantification
For identification, peaks were initially deconvoluted using AMDIS software (www.amdis.net). Silylated metabolites were then tentatively identified by comparing their retention indices (RI) with those of an n-alkane series (C8–C40), and matching their mass spectra to NIST and Wiley library databases following the procedure previously described^21^. Only annotations showing a matching score above 800 are considered. Peak abundance was obtained using MS-DIAL software with previously described parameters^20^. Fatty acids, organic acids, free amino acids, alcohols, and soluble sugars were quantified using standard curves for stearic acid, lactic acid, glycine, glycerol, and glucose, expressed as mg/g. Standard curves were constructed using four serial dilutions (10–600 µg/mL). Calibration curves for stearic acid, glycine, and glucose displayed a correlation coefficient of approximately 0.994821 following the same protocol described in^20^.
Multivariate data analysis
Multivariate data analysis was performed using unsupervised principal component analysis (PCA) and hierarchical cluster analysis (HCA), as well as supervised orthogonal partial least squares-discriminant analysis (OPLS-DA) with SIMCA 14.1 (Umetrics, Umea, Sweden). All variables were scaled and mean-centered to Pareto Variance. Unsupervised PCA was conducted to provide a comprehensive overview of metabolite variance among the different caviar specimens, meanwhile, supervised OPLS-DA was applied to validate PCA results and to obtain detailed insights into differences in metabolites composition among the studied samples. Chemometric models were evaluated employing R^2^ and Q^2^ parameters, with the number of permutations set at 200. R^2^ assessed the model’s goodness of fit, while Q^2^ indicated its predictability. Outliers were identified using DModx (distance to the model), and strong outliers in the OPLS-DA plot were detected via Hotelling’s T^2^. An iterative permutation test was performed to eliminate the non-random separation among groups.
Statistical analysis
All data were expressed as mean ± S.D. from three biological replicates per group. Two-way analysis of variance (ANOVA) followed by Tukey’s Post-Hoc test was performed using GraphPad Prism 9 for multiple comparisons among marker metabolites and metabolite classes at a significance level less than 0.05.
Ethics statement
The experimental design was approved by the Ethics Committee for the use of animal subjects, at Ain Shams University, Cairo, Egypt (approval number REC 413). All experiments were performed in accordance with relevant guidelines and regulations and were reported in compliance with ARRIVE guidelines.
Results and discussion
GC–MS metabolome identification in caviar and roe samples
GC–MS analysis was employed for profiling primary metabolites in all caviar and roe samples (see Table 1 for detailed samples’ information and codes) to include 139 peaks belonging to different classes i.e. fatty acids/esters (37 peaks), alcohols (12), aliphatic hydrocarbons (2), amino acids (27), nitrogenous compounds (14), organic acids (21), sugars (12), sugar alcohols/acids (9) as well as secondary metabolites exemplified by steroids/terpenoids (5) (Table 2). The level of major metabolite classes identified in caviar/roe specimens is illustrated in Fig. 1. GC–MS chromatograms of red caviar (salmon roe), genuine black caviar, as well as roe samples of the ridged swimming crab Charybdis natator, the collector urchin Tripneustes gratilla, the common cuttlefish Sepia officinalis, and the gilt-head bream Sparus aurata are depicted in Supplementary Fig. S2. GC–MS peak list is provided in Supplementary datasheet S1. The biological variance within each caviar or roe specimen was assessed by analyzing three independent biological replicates as detailed for each class in the next subsections.Table 2. Concentration of silylated primary and secondary metabolites in caviar and roe samples analyzed via GC–MS, n = 3, and expressed as mean ± standard deviation (mg/g). For code explanation, refer to Table 1. Annotations followed by an asterisk indicate those confirmed with standards.Peak noRt (min)RIAnnotation^#^SAM-2SAF-2SAM-1SAF-1TGFRHFPPF-2PPF-125.37989Ethylene glycol 2TMS0.31 ± 0.060.25 ± 0.020.34 ± 0.010.34 ± 0.020.33 ± 0.020.13 ± 0.070.25 ± 0.020.30 ± 045.701012Ethylene glycol 2TMS isomertrtrtrtrtrtrtrtr86.6610641,3 Propanediol 2TMS0.06 ± 0.010.05 ± 00.06 ± 00.06 ± 0.010.06 ± 00.03 ± 0.010.05 ± 00.06 ± 0106.8110721,3 Propanediol 2TMS isomer0.06 ± 0.030.01 ± 0.010.01 ± 0.010.03 ± 0.02trtr0.01 ± 0.01tr237.9811371,2-Butanediol 2TMS isomer0.03 ± 0.010.01 ± 0.010.01 ± 0.010.02 ± 0.010.01 ± 0tr0.01 ± 00.01 ± 0.01308.5911712-Octanol TMS0.04 ± 0.010.02 ± 0.010.02 ± 00.03 ± 0.010.03 ± 0.010.03 ± 0.010.02 ± 0.010.03 ± 0.01369.0811981-Octanol TMS0.03 ± 0.010.03 ± 0.010.03 ± 0.010.03 ± 00.03 ± 0.010.03 ± 0.020.01 ± 0.010.03 ± 0439.911253Diethylene glycol 2TMS0.21 ± 0.030.15 ± 0.020.19 ± 0.010.22 ± 0.020.20 ± 0.020.07 ± 0.020.15 ± 00.18 ± 0.014710.441288Glycerol 3TMS6.09 ± 2.470.49 ± 0.391.51 ± 1.942.41 ± 1.912.15 ± 0.930.19 ± 0.080.23 ± 0.060.27 ± 0.049818.0918862-Ethyl-1-dodecanoltrtrtrtrtrtrtrtr12020.822156Octadecanol TMS0.03 ± 0.010.02 ± 0.010.02 ± 00.02 ± 00.03 ± 0tr0.02 ± 00.02 ± 012422.102295Oleyl alcohol TMS0.01 ± 0.010.01 ± 00.01 ± 00.02 ± 0.010.01 ± 00.01 ± 00.01 ± 00.01 ± 0TOTAL ALCOHOLS6.89 ± 2.511.05 ± 0.462.22 ± 1.983.19 ± 1.982.85 ± 0.960.51 ± 0.200.75 ± 0.070.92 ± 0.068315.9216951-Heptadecene0.01 ± 00.01 ± 00.01 ± 00.01 ± 0.010.01 ± 00.02 ± 0.010.01 ± 00.01 ± 012722.76236911-TricosenetrtrtrtrtrtrtrtrTOTAL ALIPHATIC HYDROCARBONS0.01 ± 00.01 ± 00.01 ± 00.01 ± 0.010.01 ± 00.02 ± 0.010.01 ± 00.01 ± 0.0115.10966Alanine TMS0.02 ± 0.010.02 ± 0.010.01 ± 00.02 ± 0.010.01 ± 0.010.04 ± 0.020.02 ± 0.020.02 ± 0.0135.40992N, N-Dimethylglycine TMS0.75 ± 0.530.09 ± 0.030.37 ± 0.390.50 ± 0.410.12 ± 0.010.37 ± 0.500.08 ± 0.050.08 ± 0.01137.231095Valine TMS0.14 ± 0.080.04 ± 0.050.31 ± 0.510.07 ± 0.050.23 ± 0.110.01 ± 0tr0.01 ± 0167.441106Valine TMS isomer0.02 ± 0.010.02 ± 0.010.02 ± 0.010.01 ± 0.010.02 ± 0.010.01 ± 0.010.01 ± 00.01 ± 0.01177.541112Sarcosine 2TMS1.32 ± 1.000.03 ± 0.050.19 ± 0.320.60 ± 0.550.87 ± 0.570.01 ± 0trtr197.711122Alanine 2TMS0.01 ± 00.01 ± 00.01 ± 00.01 ± 00.02 ± 0.010.01 ± 00.01 ± 00.01 ± 0217.821128Glycine 2TMS0.21 ± 0.280.01 ± 0.010.06 ± 0.090.10 ± 0.120.32 ± 0.23tr0.01 ± 00.01 ± 0227.971136Glycine 2TMS isomertr0.01 ± 0tr0.01 ± 0tr0.01 ± 0trtr298.571170Leucine TMS0.01 ± 00.01 ± 00.01 ± 0tr0.01 ± 0tr0.01 ± 00.01 ± 0.01338.771181Isoleucine TMS0.10 ± 0.070.01 ± 00.22 ± 0.360.05 ± 0.060.10 ± 0.080.01 ± 00.01 ± 0.010.01 ± 0348.791182Norleucine0.08 ± 0.050.02 ± 0.030.17 ± 0.270.05 ± 0.040.12 ± 0.060.01 ± 0tr0.01 ± 0399.461224Valine-2TMS0.11 ± 0.090.03 ± 0.040.08 ± 0.120.03 ± 0.030.09 ± 0.050.01 ± 00.01 ± 00.01 ± 04510.141268L-Serine 2TMS0.22 ± 0.101.09 ± 0.050.86 ± 0.180.52 ± 0.440.30 ± 0.190.17 ± 0.040.63 ± 0.541.51 ± 0.234910.731307Threonine 2TMS0.71 ± 0.450.03 ± 0.040.34 ± 0.560.15 ± 0.140.23 ± 0.130.03 ± 0.030.02 ± 00.01 ± 0.015110.901318Glycine 3TMS1.05 ± 0.440.09 ± 0.011.12 ± 1.771.01 ± 0.8712.82 ± 7.720.03 ± 0.010.11 ± 0.020.11 ± 0.016011.741373Serine 3TMS0.08 ± 0.030.02 ± 0.020.03 ± 0.040.05 ± 0.030.08 ± 0.04tr0.01 ± 00.01 ± 06112.121399Threonine 3TMS0.28 ± 0.080.04 ± 0.040.07 ± 0.080.07 ± 0.030.10 ± 0.060.05 ± 0.070.02 ± 0.010.01 ± 06412.641438β-Alanine 4TMS0.41 ± 0.030.31 ± 0.020.41 ± 0.100.36 ± 0.010.40 ± 0.020.10 ± 0.030.30 ± 0.020.34 ± 0.016613.301487Aminomalonic acid 3TMS0.01 ± 00.01 ± 00.01 ± 0.010.01 ± 0.010.01 ± 0trtr0.01 ± 06713.321489Aspartic acid 3TMS0.14 ± 0.020.01 ± 0.010.03 ± 0.040.07 ± 0.050.12 ± 0.07tr0.01 ± 00.01 ± 07013.941535Aspartic acid 3TMS0.09 ± 0.030.03 ± 0.010.21 ± 0.310.14 ± 0.120.12 ± 0.050.02 ± 0.010.03 ± 0.030.06 ± 0.027113.991539Pyroglutamic acid 2TMS0.21 ± 0.080.07 ± 0.060.26 ± 0.350.25 ± 0.230.24 ± 0.080.01 ± 00.03 ± 00.06 ± 0.047214.0315433-Hydroxyproline 3TMS0.12 ± 0.050.03 ± 0.020.29 ± 0.480.07 ± 0.060.14 ± 0.080.01 ± 0.010.01 ± 00.01 ± 07614.471576Pyroglutamic acid 2TMS isomer6.44 ± 4.360.46 ± 0.10^a^*0.93 ± 0.723.35 ± 2.370.45 ± 0.04^a^*0.21 ± 0.09^a^*0.39 ± 0^a^*0.50 ± 0.07^a^*7915.181632Glutamic acid 3TMS0.16 ± 0.050.03 ± 0.040.24 ± 0.390.08 ± 0.070.18 ± 0.09tr0.01 ± 00.01 ± 08015.311643Phenylalanine 2TMS0.07 ± 0.020.02 ± 0.020.05 ± 0.080.04 ± 0.020.03 ± 0.01trtr0.01 ± 09918.281905Tyrosine 2TMS0.08 ± 0.010.01 ± 0.010.09 ± 0.140.05 ± 0.040.04 ± 0.02tr0.01 ± 00.01 ± 0.01TOTAL AMINO ACIDS12.85 ± 6.722.53 ± 0.60^b^***6.38 ± 6.97^b^***7.69 ± 4.44^b^***17.16 ± 9.571.13 ± 0.68^b^***1.74 ± 0.52^b^***2.82 ± 0.33^b^**127.121089Caproic acid TMS0.13 ± 0.020.11 ± 0.010.16 ± 0.010.15 ± 0.020.15 ± 0.030.08 ± 0.020.12 ± 0.010.14 ± 0.01157.3811032-Ethylhexanoic acid TMS0.36 ± 0.070.27 ± 0.010.36 ± 0.020.37 ± 0.020.34 ± 0.030.16 ± 0.060.26 ± 00.32 ± 0.015711.591364Butyl caprylate6.53 ± 0.545.54 ± 0.306.57 ± 0.216.77 ± 0.336.49 ± 0.171.89 ± 0.755.39 ± 0.115.98 ± 0.095811.611365Nonanoic acid, TMS0.07 ± 0.010.04 ± 00.06 ± 00.07 ± 0.010.06 ± 0.010.03 ± 0.020.05 ± 0.010.06 ± 0.017814.901609Pimelic acid 2TMS0.15 ± 0.010.14 ± 0.090.15 ± 0.020.11 ± 0.100.04 ± 0.010.06 ± 0.030.05 ± 0.030.10 ± 0.058416.061707Suberic acid 2TMS0.12 ± 0.010.12 ± 0.010.14 ± 0.010.13 ± 0.010.11 ± 0.030.09 ± 0.010.09 ± 0.010.11 ± 0.029017.201802Azelaic acid 2TMS0.29 ± 0.030.17 ± 0.100.22 ± 0.080.44 ± 0.390.13 ± 00.16 ± 0.080.11 ± 0.010.16 ± 0.059617.721852Myristic acid TMS0.45 ± 0.090.23 ± 0.080.34 ± 0.070.48 ± 0.101.18 ± 0.570.11 ± 0.070.22 ± 0.020.27 ± 0.0410418.771950Pentadecanoic acid TMS0.21 ± 0.030.08 ± 0.020.11 ± 0.040.14 ± 0.030.12 ± 0.040.05 ± 0.040.07 ± 00.07 ± 0.0110919.592030Palmitoleic acid TMS0.65 ± 0.180.19 ± 0.130.30 ± 0.120.42 ± 0.130.60 ± 0.340.06 ± 0.050.15 ± 0.030.16 ± 0.0411019.772049Palmitic acid TMS9.40 ± 3.182.22 ± 1.10^c^***2.93 ± 1.52^c^***5.21 ± 1.93^c^***3.65 ± 1.26^c^***2.00 ± 2.12^c^***1.56 ± 0.30^c^***1.73 ± 0.29^c^**11119.812053Myristic acid TMS0.02 ± 0.020.01 ± 00.01 ± 00.01 ± 00.01 ± 00.01 ± 00.01 ± 00.01 ± 011320.372110Margaric acid TMS0.13 ± 0.040.04 ± 0.020.05 ± 0.030.08 ± 0.010.04 ± 0.020.02 ± 0.010.03 ± 00.04 ± 011820.732147Margaric acid TMS isomer0.44 ± 0.250.12 ± 0.020.20 ± 0.080.22 ± 0.060.14 ± 0.020.06 ± 0.040.12 ± 0.010.13 ± 0.0111920.802154Sarcosine ester0.06 ± 0.050.02 ± 00.02 ± 0.010.03 ± 0.010.03 ± 00.01 ± 0.010.01 ± 00.02 ± 0.0112121.392216Linoleic acid TMS0.30 ± 0.190.03 ± 0.020.04 ± 0.030.08 ± 0.040.07 ± 00.02 ± 0.010.01 ± 00.03 ± 0.0212221.452223Oleic acid TMS2.47 ± 1.760.67 ± 0.460.74 ± 0.070.58 ± 0.130.71 ± 0.180.70 ± 0.660.51 ± 0.230.56 ± 0.1512321.652244Stearic acid TMS5.81 ± 2.772.17 ± 0.442.79 ± 0.593.35 ± 0.612.69 ± 0.180.99 ± 0.812.07 ± 0.182.24 ± 0.1712522.412330Glyceryl-glycoside TMS0.01 ± 00.01 ± 0.010.01 ± 00.02 ± 0.010.18 ± 0.090.01 ± 00.01 ± 00.01 ± 012622.532342Nonadecanoic acid TMS0.12 ± 0.070.04 ± 00.07 ± 0.030.06 ± 0.020.05 ± 0.030.04 ± 0.030.05 ± 0.010.05 ± 0.0112822.842377Arachidonic acid TMS1.43 ± 0.640.06 ± 0.030.11 ± 0.120.19 ± 0.120.63 ± 0.390.02 ± 0.010.02 ± 0.010.04 ± 0.0112922.912385Eicosapentaenoic acid TMS0.89 ± 0.320.07 ± 0.060.06 ± 0.070.33 ± 0.260.38 ± 0.210.02 ± 00.04 ± 0.010.05 ± 0.0413023.0724031-Monomyristin 2TMS0.26 ± 0.080.17 ± 0.040.27 ± 0.200.31 ± 0.100.25 ± 0.160.05 ± 0.030.15 ± 0.050.16 ± 0.0613123.182418Eicosenoic acid TMS0.69 ± 0.860.17 ± 0.030.22 ± 0.070.25 ± 0.030.77 ± 0.380.38 ± 0.350.18 ± 0.110.22 ± 0.0313223.382443Arachidic acid TMS0.80 ± 1.090.08 ± 0.020.14 ± 0.020.19 ± 0.040.18 ± 0.030.47 ± 0.450.13 ± 0.100.10 ± 0.0213323.7824941-O-hexadecylglycerol 2TMS0.41 ± 0.050.23 ± 0.060.34 ± 0.040.44 ± 0.050.33 ± 0.050.05 ± 0.020.21 ± 0.050.27 ± 0.0213424.3625682-Monopalmitoylglycerol TMS0.11 ± 0.070.04 ± 00.05 ± 0.010.06 ± 0.010.06 ± 0.010.01 ± 0.010.03 ± 00.03 ± 013524.442578Docosahexaenoic acid TMS2.96 ± 1.160.11 ± 0.110.18 ± 0.230.28 ± 0.210.09 ± 0.060.02 ± 0.010.05 ± 0.010.10 ± 0.0613624.6326031-Monopalmitin TMS0.63 ± 0.270.28 ± 0.100.29 ± 0.070.44 ± 0.160.46 ± 0.150.06 ± 0.020.22 ± 0.040.29 ± 0.0413824.812626Docosenoic acid TMS3.32 ± 0.840.08 ± 0.030.18 ± 0.030.88 ± 1.180.21 ± 0.040.28 ± 0.220.13 ± 0.090.12 ± 0.0214025.8427572-Monostearin TMS0.04 ± 0.010.02 ± 00.02 ± 0.010.03 ± 0.020.02 ± 00.01 ± 00.02 ± 00.01 ± 0.0114125.9627721-Monooleoylglycerol TMS0.20 ± 0.160.04 ± 0.040.08 ± 0.050.11 ± 0.060.10 ± 0.030.01 ± 00.03 ± 00.03 ± 0.01226.112791Monostearin 2TMS isomer0.44 ± 0.150.17 ± 0.020.21 ± 0.050.31 ± 0.090.25 ± 0.010.04 ± 0.030.19 ± 0.030.23 ± 0.0414426.322814Tetracosenoic acid TMS0.33 ± 0.160.14 ± 0.030.25 ± 0.010.22 ± 0.030.24 ± 0.030.09 ± 0.020.16 ± 0.010.18 ± 0.0314526.472827Lignoceric acid TMS0.31 ± 0.390.04 ± 00.07 ± 0.010.09 ± 0.010.06 ± 0.010.14 ± 0.090.06 ± 0.020.06 ± 0.0114827.882958Hexacosanoic acid TMS0.04 ± 0.030.02 ± 00.03 ± 0.020.02 ± 00.02 ± 0.010.02 ± 0.010.02 ± 0.010.01 ± 011720.6621403-Octadecanone0.01 ± 0.010.02 ± 0.010.01 ± 00.02 ± 0.010.02 ± 0.010.02 ± 00.02 ± 0.010.01 ± 0.01TOTAL FATTY ACIDS/ESTERS40.61 ± 12.35^d^13.95 ± 3.22^c^^,d^17.77 ± 3.58^c^^,d^22.89 ± 5.44^c^^,d^20.88 ± 3.80^c^^,d^8.26 ± 6.06^c^^,d^12.54 ± 1.07^c^^,d^14.10 ± 1.09^c^^,d^**187.631117Pipecolic acid TMS0.08 ± 0.030.01 ± 0.010.01 ± 0.010.02 ± 0.010.01 ± 00.01 ± 00.01 ± 0.010.01 ± 0248.121145Unknown0.20 ± 0.020.12 ± 00.17 ± 0.030.20 ± 0.020.16 ± 0.020.07 ± 0.020.12 ± 0.010.12 ± 0.01268.431163Unknown0.13 ± 0.020.08 ± 0.010.15 ± 0.080.12 ± 0.010.13 ± 0.030.07 ± 0.020.07 ± 0.010.08 ± 0.01278.4411632-Amino-4-methylpentanamide0.19 ± 0.070.09 ± 0.040.36 ± 0.490.13 ± 0.050.20 ± 0.080.03 ± 0.010.06 ± 0.010.07 ± 0.01318.631173Ethyl pipecolinate0.40 ± 0.310.01 ± 0.010.08 ± 0.100.08 ± 0.060.04 ± 0.010.01 ± 0.010.01 ± 00.01 ± 0409.591232Methyl 1,2-dimethyl-5-oxo-2-pyrrolidinecarboxylate0.02 ± 0.010.01 ± 00.01 ± 0.010.02 ± 0.010.01 ± 00.01 ± 00.01 ± 0.010.01 ± 0429.801247Urea 2TMS1.67 ± 0.822.13 ± 1.202.45 ± 1.682.33 ± 1.383.39 ± 0.150.52 ± 0.812.77 ± 0.112.53 ± 1.504610.331280Nicotinic acid TMS0.03 ± 00.03 ± 00.04 ± 0.010.05 ± 00.03 ± 00.01 ± 00.03 ± 00.03 ± 0.015311.151335Picolinic acid isomer TMS0.01 ± 0.010.01 ± 00.01 ± 0.010.03 ± 0.020.02 ± 0.020.01 ± 0trtr5511.411352Uracil 2TMS0.03 ± 0.010.02 ± 0.020.03 ± 0.040.02 ± 00.04 ± 0.01tr0.01 ± 00.01 ± 06212.211405Cadaverine 4TMS1.68 ± 0.160.56 ± 0.310.66 ± 0.311.19 ± 0.301.21 ± 0.230.22 ± 0.140.47 ± 0.010.63 ± 0.237514.431572Creatinine 3TMS7 ± 5.280.03 ± 0.02^a^**0.54 ± 0.87^a^*3.56 ± 2.850.04 ± 0.01^a^**0.02 ± 0^a^**0.01 ± 0.01^a^**0.02 ± 0.02^a^**13724.732615Inosine 4TMS2.15 ± 0.580.11 ± 0.040.11 ± 0.160.86 ± 0.720.07 ± 0.030.06 ± 0.030.05 ± 00.11 ± 0.0714326.222804Lauryl amide0.12 ± 0.030.01 ± 0.010.10 ± 0.010.09 ± 0.030.15 ± 0.010.02 ± 00.02 ± 0.030.02 ± 0.03TOTAL NITROGENOUS COMPOUNDS13.70 ± 7.063.22 ± 0.82^a^***4.72 ± 0.40^a^***8.69 ± 2.815.50 ± 0.53^a^***1.06 ± 1.03^a^***3.64 ± 0.07^a^***3.67 ± 1.52^a^**56.0610312-Ketobutyric acid0.01 ± 00.02 ± 00.02 ± 0.020.01 ± 0.010.03 ± 00.01 ± 0.010.02 ± 00.03 ± 066.481054Pyruvic acid 2TMS0.06 ± 0.020.04 ± 00.05 ± 00.05 ± 0.010.04 ± 00.03 ± 0.010.04 ± 00.04 ± 096.791071Lactic acid 2TMS25.98 ± 15.45^e^0.55 ± 0.43^a^^,e^1.77 ± 2.13^a^^,e^***10.01 ± 8.52^a^0.44 ± 0.13^a^^,e^0.15 ± 0.03^a^^,e^0.23 ± 0.13^a^^,e^0.50 ± 0.28^a^^,e^***117.051085Glycolic acid 2TMS0.05 ± 0.010.05 ± 0.020.07 ± 0.020.08 ± 0.020.06 ± 0.010.02 ± 00.04 ± 00.05 ± 0.01147.261097Oxalic acid isomer 2TMS0.03 ± 0.010.02 ± 0.010.03 ± 0.010.04 ± 0.020.22 ± 0.100.02 ± 0.010.02 ± 0.010.02 ± 0.01207.721122Oxalic acid 2TMS0.01 ± 0.010.01 ± 00.01 ± 00.01 ± 00.02 ± 0.010.01 ± 00.01 ± 00.01 ± 0.01258.251152β-Lactic acid 2TMS0.03 ± 0.020.03 ± 0.010.04 ± 00.04 ± 0.010.04 ± 00.02 ± 00.02 ± 00.03 ± 0288.531168β-Hydroxybutyric acid 2TMS0.04 ± 00.02 ± 00.03 ± 0.020.05 ± 0.040.03 ± 0.010.01 ± 0.010.01 ± 0.010.02 ± 0328.721178Heptanoic acid TMStrtrtrtrtrtrtrtr358.8311842-Ketobutyric acid TMS0.02 ± 0.010.01 ± 0.010.02 ± 0.010.02 ± 00.03 ± 00.02 ± 0.010.01 ± 00.01 ± 0379.311213Acetoacetic acid 2TMS0.04 ± 0.020.01 ± 00.01 ± 00.01 ± 00.04 ± 0.02tr0.01 ± 00.01 ± 0389.3412152-Ketobutyric acid, enol 2TMS0.04 ± 0.010.01 ± 00.02 ± 0.010.02 ± 0.010.56 ± 0.280.01 ± 0.010.01 ± 00.01 ± 0419.7612434-Hydroxybutyric acid 2TMS1.38 ± 0.091.12 ± 0.021.34 ± 0.031.42 ± 0.081.34 ± 0.070.33 ± 0.191.10 ± 0.051.31 ± 0.095210.971323Succinic acid 2TMS0.41 ± 0.240.15 ± 0.030.25 ± 0.160.31 ± 0.130.19 ± 00.03 ± 0.010.13 ± 0.010.15 ± 05411.301345Glyceric acid 3TMS0.02 ± 0.010.01 ± 0.010.01 ± 00.05 ± 0.040.01 ± 0trtr0.01 ± 05611.441354Fumaric acid 2TMS0.02 ± 0.010.01 ± 00.02 ± 0.010.01 ± 00.01 ± 0tr0.01 ± 00.01 ± 05911.661368Maleic acid 2TMS0.09 ± 0.070.05 ± 0.070.11 ± 0.090.06 ± 0.080.09 ± 0.040.01 ± 0.020.09 ± 0.070.13 ± 06312.311413Glutaric acid 2TMS0.06 ± 0.010.05 ± 00.09 ± 0.030.08 ± 0.010.06 ± 0.010.02 ± 0.020.06 ± 00.07 ± 0.016813.511503Malic acid 3TMS0.33 ± 0.090.03 ± 0.010.05 ± 0.040.07 ± 0.040.05 ± 00.01 ± 00.03 ± 00.03 ± 0.017714.6215862-Hydroxyglutaric acid 3TMS0.01 ± 00.01 ± 00.01 ± 0.010.01 ± 0.010.02 ± 0tr0.01 ± 00.01 ± 09417.591840Citric acid 4TMS0.02 ± 00.01 ± 0.010.03 ± 0.030.03 ± 0.020.04 ± 0.010.01 ± 0tr0.01 ± 0TOTAL ORGANIC ACIDS28.65 ± 15.84^e^2.21 ± 0.60^a^^,e^3.96 ± 2.44^a^^,e^*12.38 ± 8.78^a^3.33 ± 0.6^a^^,e^0.74 ± 0.28^a^^,e^1.85 ± 0.23^a^^,e^2.46 ± 0.29^a^^,e^**14727.802951γ-Tocopherol TMS0.05 ± 0.050.01 ± 00.01 ± 00.02 ± 00.01 ± 00.01 ± 00.01 ± 0.010.01 ± 014928.883048Stigmastan-3,5-diene0.30 ± 0.380.05 ± 0.030.09 ± 0.020.10 ± 0.010.07 ± 0.020.10 ± 0.030.08 ± 0.070.05 ± 0.0115029.233079Cholesterol TMS2.59 ± 0.270.39 ± 0.491.20 ± 1.350.71 ± 0.660.73 ± 0.270.04 ± 0.030.10 ± 0.020.29 ± 0.1815129.993145Unknown0.02 ± 0.020.01 ± 00.02 ± 0.010.02 ± 0.010.01 ± 00.01 ± 00.01 ± 00.01 ± 015232.2533435-Cholesten-3β-ol-7-one TMS0.01 ± 0.010.01 ± 00.02 ± 0.020.02 ± 00.01 ± 00.01 ± 00.01 ± 00.01 ± 0.01TOTAL STEROIDS/TERPENOIDS2.98 ± 0.640.47 ± 0.511.34 ± 1.400.88 ± 0.660.82 ± 0.280.17 ± 0.020.21 ± 0.060.37 ± 0.199217.491831Arabinose 4TMS0.07 ± 0.050.04 ± 0.010.06 ± 0.060.06 ± 0.020.12 ± 0.030.02 ± 0.010.03 ± 00.03 ± 0.019317.571838Fructofuranose 5TMS0.03 ± 0.010.01 ± 0.010.03 ± 0.030.04 ± 0.020.07 ± 0.010.01 ± 00.01 ± 00.01 ± 0.019517.671847Sorbopyranose 5TMS0.02 ± 00.02 ± 0.010.04 ± 0.040.04 ± 0.020.05 ± 0.010.01 ± 00.01 ± 00.02 ± 0.0110018.451921Glucose 5TMS0.05 ± 0.020.03 ± 0.020.06 ± 0.060.15 ± 0.111.70 ± 0.780.01 ± 00.03 ± 0.010.05 ± 0.0110118.481924Talopyranose 5TMS0.04 ± 00.03 ± 0.010.04 ± 0.010.06 ± 0.020.18 ± 0.060.03 ± 0.020.03 ± 0.010.04 ± 010318.591934Mannose 5TMS0.09 ± 0.090.02 ± 0.010.07 ± 0.060.14 ± 0.110.20 ± 0.100.03 ± 0.010.02 ± 00.01 ± 010519.101981Galactopyranose 5TMS2.61 ± 1.390.06 ± 0.050.49 ± 0.780.46 ± 0.360.03 ± 00.01 ± 00.03 ± 0.010.03 ± 0.0110619.261996Unknown sugar0.09 ± 0.050.01 ± 0.010.02 ± 0.010.04 ± 0.040.03 ± 0.010.01 ± 00.01 ± 00.01 ± 010719.352006Glucopyranose 5TMS0.06 ± 0.030.04 ± 0.030.09 ± 0.090.26 ± 0.192.33 ± 1.010.03 ± 0.010.05 ± 0.010.07 ± 0.0111620.622135N-Acetyl-D-glucosamine 4TMS0.10 ± 0.010.07 ± 0.010.10 ± 0.010.10 ± 0.010.10 ± 0.010.03 ± 0.010.07 ± 00.08 ± 013925.392700Sucrose 8TMS0.12 ± 00.10 ± 0.121.10 ± 1.780.10 ± 0.062.01 ± 3.330.07 ± 0.040.10 ± 0.060.13 ± 0.1214626.652844Trehalose 8TMS0.05 ± 0.020.04 ± 0.010.20 ± 0.230.05 ± 0.020.30 ± 0.410.07 ± 0.030.03 ± 0.010.06 ± 0.02TOTAL SUGARS3.33 ± 1.470.47 ± 0.272.30 ± 3.141.49 ± 0.837.11 ± 2.310.31 ± 0.130.43 ± 0.110.54 ± 0.117414.311563L-Threonic acid 4TMS0.09 ± 0.030.01 ± 0.010.10 ± 0.150.04 ± 0.030.05 ± 0.040.01 ± 00.01 ± 00.01 ± 09117.241807Ribonic acid 5TMS0.30 ± 0.030.17 ± 0.100.24 ± 0.100.45 ± 0.390.85 ± 0.380.17 ± 0.080.12 ± 0.010.16 ± 0.0510218.511926Gluconic acid lactone 4TMS0.09 ± 0.010.07 ± 0.040.11 ± 0.080.21 ± 0.162.13 ± 0.860.10 ± 0.050.06 ± 0.060.09 ± 0.05TOTAL SUGAR ACIDS0.48 ± 0.050.25 ± 0.140.45 ± 0.330.70 ± 0.573.03 ± 1.280.27 ± 0.130.19 ± 0.050.26 ± 0.048616.361732Arabinitol 5TMS0.08 ± 0.020.03 ± 0.040.03 ± 0.020.20 ± 0.210.06 ± 0.010.01 ± 0.010.03 ± 0.030.05 ± 0.059717.811861D-Pinitol 5TMS0.34 ± 0.230.31 ± 0.090.07 ± 0.090.36 ± 0.151.20 ± 0.550.02 ± 0.020.30 ± 0.030.32 ± 0.0510819.462017Myo-inositol 6TMS0.09 ± 0.040.02 ± 00.03 ± 0.030.03 ± 0.020.10 ± 0.050.01 ± 00.01 ± 00.01 ± 011219.892061Scyllo-Inositol 6TMS0.04 ± 00.03 ± 0.010.21 ± 0.330.03 ± 0.010.26 ± 0.110.02 ± 0.010.02 ± 0.010.02 ± 0.0111420.462119Myoinositol TMS0.75 ± 0.180.21 ± 0.070.70 ± 0.750.44 ± 0.070.61 ± 0.240.12 ± 0.050.21 ± 0.080.21 ± 0.0511520.512125Myo-inositol 6TMS isomer0.69 ± 0.200.21 ± 0.070.70 ± 0.750.41 ± 0.100.58 ± 0.260.14 ± 0.070.21 ± 0.080.21 ± 0.04TOTAL SUGAR ALCOHOLS2.00 ± 0.620.80 ± 0.251.74 ± 1.961.46 ± 0.182.81 ± 1.180.32 ± 0.120.78 ± 0.210.81 ± 0.03Peak noRt (min)RIAnnotation^#^BCVRCVCNFCNMDLFSOFSOMSLB25.37989Ethylene glycol 2TMS0.37 ± 0.020.33 ± 0.040.13 ± 0.020.15 ± 0.010.39 ± 0.030.35 ± 0.010.20 ± 0.030.30 ± 0.0245.701012Ethylene glycol 2TMS isomertrtrtrtrtrtrtrtr86.6610641,3 Propanediol 2TMS0.07 ± 0.010.07 ± 00.02 ± 00.03 ± 00.07 ± 00.06 ± 0.010.04 ± 0.010.07 ± 0.01106.8110721,3 Propanediol 2TMS isomer0.01 ± 0trtrtr0.01 ± 00.01 ± 0.01trtr237.9811371,2-Butanediol 2TMS isomer0.09 ± 0.020.05 ± 0.010.01 ± 00.01 ± 00.01 ± 00.02 ± 00.01 ± 00.01 ± 0308.5911712-Octanol TMS0.04 ± 0.020.03 ± 00.03 ± 0.010.02 ± 0.010.03 ± 0.010.03 ± 00.03 ± 0.010.02 ± 0.01369.0811981-Octanol TMS0.05 ± 0.010.05 ± 00.02 ± 00.02 ± 00.04 ± 0.010.06 ± 0.020.05 ± 00.03 ± 0439.911253Diethylene glycol 2TMS0.31 ± 0.030.22 ± 0.020.07 ± 0.010.09 ± 0.010.22 ± 0.020.21 ± 0.010.13 ± 0.020.18 ± 0.014710.441288Glycerol 3TMS3.46 ± 0.681.79 ± 0.030.41 ± 0.080.48 ± 0.120.81 ± 0.082.21 ± 1.681.19 ± 0.670.43 ± 0.099818.0918862-Ethyl-1-dodecanol0.02 ± 00.01 ± 0trtrtr0.01 ± 0.01trtr12020.822156Octadecanol TMS0.06 ± 00.04 ± 00.01 ± 00.01 ± 00.03 ± 0.010.03 ± 00.01 ± 00.02 ± 012422.102295Oleyl alcohol TMS0.01 ± 00.01 ± 00.01 ± 00.01 ± 00.01 ± 00.01 ± 00.01 ± 00.01 ± 0TOTAL ALCOHOLS4.50 ± 0.732.61 ± 0.020.72 ± 0.120.82 ± 0.151.63 ± 0.122.99 ± 1.701.68 ± 0.671.06 ± 0.078315.9216951-Heptadecene0.01 ± 00.01 ± 00.01 ± 00.01 ± 00.01 ± 0.010.01 ± 0.010.01 ± 0.010.01 ± 012722.76236911-Tricosene0.02 ± 00.01 ± 0trtrtr0.01 ± 0.01trtrTOTAL ALIPHATIC HYDROCARBONS0.02 ± 00.02 ± 0.010.02 ± 00.01 ± 00.01 ± 00.02 ± 0.010.01 ± 0.010.01 ± 0.0115.10966Alanine TMS0.02 ± 0.010.03 ± 00.02 ± 0.010.02 ± 0.010.02 ± 0.010.01 ± 0.010.03 ± 0.040.02 ± 0.0135.40992N, N-Dimethylglycine TMS0.08 ± 0.060.15 ± 0.050.25 ± 0.121.03 ± 0.430.09 ± 0.057.38 ± 6.456.54 ± 4.200.10 ± 0.02137.231095Valine TMS0.07 ± 0.060.03 ± 0.010.16 ± 0.060.22 ± 0.120.02 ± 00.58 ± 0.500.63 ± 0.460.02 ± 0.02167.441106Valine TMS isomer0.02 ± 0.010.02 ± 0.010.01 ± 0.010.01 ± 00.01 ± 00.04 ± 0.030.01 ± 00.01 ± 0.01177.541112Sarcosine 2TMS0.03 ± 0.020.01 ± 00.28 ± 0.110.14 ± 0.070.01 ± 00.52 ± 0.470.85 ± 0.670.02 ± 0.03197.711122Alanine 2TMS0.01 ± 00.01 ± 00.01 ± 00.01 ± 00.01 ± 00.01 ± 0.010.01 ± 00.01 ± 0.01217.821128Glycine 2TMStrtr0.05 ± 0.020.03 ± 0.02tr0.03 ± 0.020.06 ± 0.040.01 ± 0227.971136Glycine 2TMS isomer0.01 ± 0tr0.01 ± 00.01 ± 0trtrtr0.01 ± 0298.571170Leucine TMS0.01 ± 00.01 ± 00.01 ± 00.01 ± 00.01 ± 00.01 ± 0.010.01 ± 00.01 ± 0338.771181Isoleucine TMS0.01 ± 00.01 ± 00.06 ± 0.030.43 ± 0.360.01 ± 00.59 ± 0.531.08 ± 0.880.01 ± 0348.791182Norleucine0.06 ± 0.040.02 ± 0.010.06 ± 0.010.18 ± 0.100.01 ± 00.38 ± 0.320.47 ± 0.340.01 ± 0.01399.461224Valine-2TMS0.02 ± 0.010.01 ± 00.06 ± 0.020.08 ± 0.040.01 ± 00.15 ± 0.130.16 ± 0.130.01 ± 0.014510.141268L-Serine 2TMS0.71 ± 0.481.41 ± 0.290.10 ± 0.070.18 ± 0.021.49 ± 0.060.80 ± 0.450.39 ± 0.121.16 ± 0.154910.731307Threonine 2TMS0.09 ± 0.060.04 ± 0.030.05 ± 0.030.15 ± 0.080.03 ± 0.020.33 ± 0.260.43 ± 0.340.01 ± 05110.901318Glycine 3TMS0.10 ± 00.11 ± 0.010.04 ± 0.010.08 ± 0.010.12 ± 00.24 ± 0.160.12 ± 0.040.10 ± 0.016011.741373Serine 3TMS0.01 ± 0.010.01 ± 00.01 ± 00.02 ± 0.010.01 ± 00.02 ± 0.010.02 ± 0.010.01 ± 06112.121399Threonine 3TMS0.02 ± 0.010.03 ± 00.03 ± 00.06 ± 0.020.02 ± 00.05 ± 0.030.08 ± 0.060.02 ± 06412.641438β-Alanine 4TMS0.52 ± 0.050.45 ± 0.010.10 ± 0.020.16 ± 0.010.35 ± 0.030.42 ± 0.110.21 ± 0.030.34 ± 06613.301487Aminomalonic acid 3TMS0.31 ± 0.080.20 ± 0.050.01 ± 00.01 ± 00.01 ± 0.010.01 ± 00.01 ± 00.01 ± 06713.321489Aspartic acid 3TMS0.01 ± 00.01 ± 00.01 ± 00.01 ± 0tr0.05 ± 0.040.03 ± 0.020.01 ± 0.017013.941535Aspartic acid 3TMS0.31 ± 0.300.10 ± 0.010.01 ± 0.010.03 ± 0.020.04 ± 0.010.15 ± 0.200.07 ± 0.040.03 ± 0.027113.991539Pyroglutamic acid 2TMS0.48 ± 0.150.16 ± 0.020.02 ± 0.010.08 ± .040.12 ± 0.070.49 ± 0.390.32 ± 0.190.08 ± 0.057214.0315433-Hydroxyproline 3TMS0.04 ± 0.010.01 ± 0.010.01 ± 0.010.04 ± 0.020.01 ± 00.56 ± 0.500.41 ± 0.300.01 ± 0.017614.471576Pyroglutamic acid 2TMS isomer0.69 ± 0.070.73 ± 0.110.16 ± 0.05^a^*0.27 ± 0.06^a^*0.63 ± 0.08^a^*0.55 ± 0.09^a^*0.33 ± 0.04^a^*0.51 ± 0.04^a^*7915.181632Glutamic acid 3TMS0.05 ± 0.030.02 ± 00.01 ± 00.03 ± 0.010.01 ± 0.010.03 ± 0.010.09 ± 0.060.01 ± 0.018015.311643Phenylalanine 2TMS0.02 ± 0.010.01 ± 00.01 ± 00.03 ± 0.010.01 ± 00.01 ± 00.06 ± 0.030.01 ± 0.019918.281905Tyrosine 2TMS0.03 ± 0.020.02 ± 0.010.01 ± 00.01 ± 00.01 ± 00.12 ± 0.100.18 ± 0.170.01 ± 0TOTAL AMINO ACIDS3.73 ± 0.58^b^***3.60 ± 0.24^b^***1.53 ± 0.44^b^***3.31 ± 1.28^b^***3.05 ± 0.26^b^***13.53 ± 9.6412.60 ± 7.952.54 ± 0.33^b^**127.121089Caproic acid TMS0.19 ± 0.020.17 ± 0.010.07 ± 0.010.10 ± 0.010.18 ± 0.030.21 ± 0.030.16 ± 0.030.14 ± 0.02157.3811032-Ethylhexanoic acid TMS0.40 ± 0.010.35 ± 0.030.15 ± 0.030.19 ± 0.010.41 ± 0.040.40 ± 0.020.25 ± 0.020.31 ± 0.025711.591364Butyl caprylate6.99 ± 0.216.56 ± 0.391.79 ± 0.282.71 ± 0.296.93 ± 0.206.96 ± 0.184.10 ± 0.556.04 ± 0.065811.611365Nonanoic acid, TMS0.10 ± 0.020.08 ± 0.020.03 ± 00.03 ± 0.010.06 ± 0.010.07 ± 0.020.05 ± 0.010.06 ± 07814.901609Pimelic acid 2TMS0.17 ± 0.060.17 ± 0.070.05 ± 0.010.09 ± 0.020.18 ± 0.030.18 ± 0.030.13 ± 0.040.12 ± 0.058416.061707Suberic acid 2TMS0.19 ± 0.040.22 ± 0.020.08 ± 0.020.13 ± 0.050.13 ± 0.010.20 ± 0.080.20 ± 0.090.13 ± 0.019017.201802Azelaic acid 2TMS0.38 ± 0.090.35 ± 0.070.11 ± 0.010.16 ± 0.070.27 ± 0.100.60 ± 0.340.33 ± 0.120.23 ± 0.129617.721852Myristic acid TMS1.58 ± 0.151.11 ± 0.050.20 ± 0.020.14 ± 0.020.50 ± 0.191.01 ± 0.440.49 ± 0.250.28 ± 0.0510418.771950Pentadecanoic acid TMS0.37 ± 0.010.25 ± 0.010.14 ± 0.030.06 ± 00.21 ± 0.070.26 ± 0.080.18 ± 0.100.12 ± 0.0510919.592030Palmitoleic acid TMS0.79 ± 0.090.49 ± 0.090.86 ± 0.290.10 ± 0.050.23 ± 0.060.29 ± 0.140.15 ± 0.070.47 ± 0.4811019.772049Palmitic acid TMS13.09 ± 1.379.14 ± 1.122.67 ± 0.74^c^***1.22 ± 0.15^c^***4.21 ± 1.12^c^***7.91 ± 1.473.07 ± 1.43^c^***2.52 ± 1.23^c^**11119.812053Myristic acid TMS0.01 ± 00.01 ± 00.01 ± 0tr0.01 ± 0.010.02 ± 0.010.01 ± 00.01 ± 011320.372110Margaric acid TMS0.20 ± 0.020.14 ± 0.030.12 ± 0.040.03 ± 0.010.06 ± 0.010.05 ± 0.010.03 ± 0.010.06 ± 0.0411820.732147Margaric acid TMS isomer0.42 ± 0.040.32 ± 0.020.22 ± 0.070.08 ± 0.020.24 ± 0.060.51 ± 0.280.15 ± 0.070.19 ± 0.0811920.802154Sarcosine ester0.04 ± 0.010.04 ± 0.010.01 ± 00.01 ± 00.03 ± 0.010.04 ± 0.010.02 ± 0.010.02 ± 0.0112121.392216Linoleic acid TMS0.08 ± 0.010.04 ± 0.010.04 ± 0.010.04 ± 0.020.07 ± 0.060.08 ± 0.060.04 ± 00.06 ± 0.0612221.452223Oleic acid TMS1.34 ± 0.131.02 ± 0.031.18 ± 0.360.85 ± 0.510.95 ± 0.690.97 ± 0.680.60 ± 0.280.94 ± 0.6112321.652244Stearic acid TMS4.85 ± 0.233.94 ± 0.111.44 ± 0.460.99 ± 0.103.38 ± 0.504.71 ± 0.501.44 ± 0.262.48 ± 0.4412522.412330Glyceryl-glycoside TMS0.01 ± 00.01 ± 00.01 ± 00.01 ± 00.01 ± 00.04 ± 0.020.04 ± 0.020.01 ± 0.0112622.532342Nonadecanoic acid TMS0.09 ± 0.030.09 ± 0.010.04 ± 00.03 ± 0.010.06 ± 0.010.08 ± 0.030.03 ± 00.05 ± 0.0312822.842377Arachidonic acid TMS0.23 ± 0.030.14 ± 0.040.41 ± 0.180.07 ± 0.020.07 ± 0.020.25 ± 0.190.20 ± 0.170.15 ± 0.1912922.912385Eicosapentaenoic acid TMS0.17 ± 0.030.12 ± 0.020.35 ± 0.160.04 ± 0.010.06 ± 0.021.19 ± 0.990.53 ± 0.490.12 ± 0.1713023.0724031-Monomyristin 2TMS0.32 ± 0.040.36 ± 0.120.12 ± 0.050.08 ± 0.040.15 ± 0.040.14 ± 0.060.09 ± 0.030.34 ± 0.1213123.182418Eicosenoic acid TMS1.05 ± 0.100.64 ± 0.050.29 ± 0.080.20 ± 0.030.28 ± 0.051.02 ± 0.610.30 ± 0.090.25 ± 0.0313223.382443Arachidic acid TMS0.21 ± 0.020.20 ± 0.010.25 ± 0.030.15 ± 0.010.15 ± 0.030.66 ± 0.560.19 ± 0.040.13 ± 0.0213323.7824941-O-hexadecylglycerol 2TMS0.62 ± 0.030.51 ± 0.100.07 ± 0.020.10 ± 0.010.51 ± 0.120.48 ± 0.040.17 ± 0.030.32 ± 0.0313424.3625682-Monopalmitoylglycerol TMS0.51 ± 0.110.24 ± 0.040.02 ± 00.02 ± 0.020.08 ± 0.020.10 ± 0.030.05 ± 0.020.05 ± 0.0213524.442578Docosahexaenoic acid TMS0.21 ± 0.070.13 ± 0.010.23 ± 0.120.08 ± 0.010.12 ± 0.031.67 ± 1.410.72 ± 0.640.10 ± 0.1013624.6326031-Monopalmitin TMS2.88 ± 0.701.28 ± 0.150.13 ± 0.030.07 ± 0.030.57 ± 0.170.62 ± 0.230.20 ± 0.090.35 ± 0.0713824.812626Docosenoic acid TMS0.22 ± 0.030.20 ± 0.030.17 ± 0.020.13 ± 0.020.20 ± 0.040.55 ± 0.530.18 ± 0.030.14 ± 0.0214025.8427572-Monostearin TMS0.15 ± 0.030.07 ± 0.010.01 ± 00.01 ± 00.04 ± 0.010.06 ± 0.040.01 ± 0.010.02 ± 0.0114125.9627721-Monooleoylglycerol TMS0.60 ± 0.100.26 ± 0.050.03 ± 00.05 ± 0.070.16 ± 0.030.08 ± 0.020.03 ± 00.05 ± 0.03226.112791Monostearin 2TMS isomer1.24 ± 0.350.59 ± 0.060.05 ± 0.010.05 ± 0.020.33 ± 0.070.40 ± 0.120.12 ± 0.040.24 ± 0.0214426.322814Tetracosenoic acid TMS0.32 ± 0.010.24 ± 0.020.07 ± 0.010.07 ± 0.020.24 ± 0.010.26 ± 0.060.11 ± 00.19 ± 0.0114526.472827Lignoceric acid TMS0.09 ± 0.010.08 ± 0.020.07 ± 0.010.06 ± 0.010.07 ± 0.010.21 ± 0.180.08 ± 0.010.08 ± 0.0214827.882958Hexacosanoic acid TMS0.02 ± 0.010.02 ± 0.010.01 ± 00.01 ± 0.010.02 ± 0.010.04 ± 0.010.02 ± 00.02 ± 0.0111720.6621403-Octadecanone0.03 ± 0.020.03 ± 0.010.01 ± 0.010.01 ± 00.02 ± 00.02 ± 0.020.01 ± 00.02 ± 0.01TOTAL FATTY ACIDS/ESTERS40.15 ± 3.6129.61 ± 1.42^c^11.50 ± 2.87^c^^,d^8.18 ± 1.26^c^^,d^21.20 ± 2.91^c^^,d^**32.39 ± 3.30^c^14.49 ± 3.80^c^^,d^16.84 ± 3.71^c^^,d^**187.631117Pipecolic acid TMS0.01 ± 00.01 ± 00.01 ± 00.01 ± 0.010.01 ± 00.01 ± 0.010.02 ± 0.010.01 ± 0248.121145Unknown0.23 ± 0.010.19 ± 0.020.07 ± 00.11 ± 0.040.19 ± 0.020.25 ± 0.040.16 ± 0.030.13 ± 0268.431163Unknown0.14 ± 0.030.14 ± 00.06 ± 0.010.10 ± 0.020.12 ± 0.020.21 ± 0.090.20 ± 0.100.09 ± 0278.4411632-Amino-4-methylpentanamide0.15 ± 0.070.10 ± 0.010.09 ± 0.030.28 ± 0.140.09 ± 0.010.73 ± 0.570.88 ± 0.640.08 ± 0318.631173Ethyl pipecolinate0.02 ± 00.02 ± 00.02 ± 0.010.05 ± 0.010.01 ± 0.010.36 ± 0.310.62 ± 0.390.01 ± 0409.591232Methyl 1,2-dimethyl-5-oxo-2-pyrrolidinecarboxylate0.09 ± 0.080.04 ± 0.010.02 ± 00.01 ± 00.01 ± 00.09 ± 0.080.05 ± 0.030.02 ± 0.03429.801247Urea 2TMS0.58 ± 0.223.88 ± 0.320.40 ± 0.540.61 ± 0.532.83 ± 1.820.44 ± 0.221.40 ± 1.062.65 ± 1.464610.331280Nicotinic acid TMS0.05 ± 00.05 ± 00.02 ± 00.02 ± 00.05 ± 0.010.17 ± 0.120.09 ± 0.050.04 ± 0.015311.151335Picolinic acid isomer TMS0.02 ± 0.010.02 ± 0.010.01 ± 00.01 ± 0.010.01 ± 01.78 ± 1.600.76 ± 0.680.01 ± 05511.411352Uracil 2TMS0.04 ± 0.010.04 ± 00.06 ± 0.010.03 ± 0.010.02 ± 00.03 ± 0.020.03 ± 0.010.01 ± 0.016212.211405Cadaverine 4TMS0.88 ± 0.110.93 ± 0.130.29 ± 0.070.47 ± 0.090.66 ± 0.271.15 ± 0.210.66 ± 0.190.68 ± 0.367514.431572Creatinine 3TMS0.04 ± 0.01^a^**0.04 ± 0^a^**0.02 ± 0^a^**0.11 ± 0.17^a^**0.04 ± 0^a^**0.04 ± 0^a^**0.02 ± 0.01^a^**0.01 ± 0.01^a^**13724.732615Inosine 4TMS0.14 ± 0.040.07 ± 0.010.07 ± 0.060.07 ± 0.060.20 ± 0.090.33 ± 0.400.08 ± 0.060.02 ± 0.0214326.222804Lauryl amide0.20 ± 0.020.09 ± 0.040.02 ± 0.010.01 ± 00.14 ± 0.030.06 ± 0.020.03 ± 0.010.01 ± 0.01TOTAL NITROGENOUS COMPOUNDS2.58 ± 0.53^a^***5.60 ± 0.34^a^***1.14 ± 0.54^a^***1.90 ± 0.36^a^***4.35 ± 1.74^a^**5.65 ± 2.87^a^**4.99 ± 1.14^a^**3.77 ± 1.04^a^56.0610312-Ketobutyric acid0.03 ± 00.02 ± 00.01 ± 00.02 ± 00.03 ± 00.02 ± 0.010.01 ± 00.03 ± 066.481054Pyruvic acid 2TMS0.06 ± 0.010.06 ± 0.010.02 ± 00.02 ± 00.05 ± 0.010.05 ± 00.04 ± 0.010.05 ± 0.0196.791071Lactic acid 2TMS1.50 ± 0.58^a^^,e^0.35 ± 0.05^a^^,e^0.14 ± 0.04^a^^,e^0.15 ± 0.01^a^^,e^0.65 ± 0.13^a^^,e^1.83 ± 1.7^a^^,e^1.01 ± 0.49^a^^,e^0.52 ± 0.4^a^^,e^117.051085Glycolic acid 2TMS0.17 ± 0.040.12 ± 0.010.02 ± 00.04 ± 00.07 ± 0.010.10 ± 0.030.07 ± 0.020.05 ± 0147.261097Oxalic acid isomer 2TMS0.07 ± 0.020.05 ± 0.010.01 ± 00.03 ± 00.03 ± 00.06 ± 0.040.03 ± 0.010.03 ± 0.01207.721122Oxalic acid 2TMS0.02 ± 0.010.03 ± 0.020.01 ± 0tr0.01 ± 0.010.01 ± 0.010.01 ± 00.01 ± 0258.251152β-Lactic acid 2TMS0.07 ± 0.010.05 ± 00.03 ± 00.02 ± 00.04 ± 0.010.05 ± 0.010.03 ± 0.010.03 ± 0288.531168β-Hydroxybutyric acid 2TMS0.03 ± 00.03 ± 0.010.01 ± 00.01 ± 00.03 ± 0.010.03 ± 0.010.02 ± 00.02 ± 0328.721178Heptanoic acid TMStrtrtrtrtrtrtrtr358.8311842-Ketobutyric acid TMS0.06 ± 0.020.04 ± 00.02 ± 00.01 ± 0.010.02 ± 00.02 ± 0.010.02 ± 0.010.02 ± 0379.311213Acetoacetic acid 2TMS0.01 ± 0.010.01 ± 00.01 ± 0.010.03 ± 0.040.01 ± 00.43 ± 0.370.05 ± 0.060.01 ± 0.01389.3412152-Ketobutyric acid, enol 2TMS0.02 ± 0.020.02 ± 0.010.01 ± 00.01 ± 00.02 ± 0.020.06 ± 0.030.02 ± 0.010.02 ± 0.01419.7612434-Hydroxybutyric acid 2TMS1.48 ± 0.041.54 ± 0.120.31 ± 0.090.49 ± 0.061.51 ± 0.091.38 ± 0.050.52 ± 0.381.32 ± 0.115210.971323Succinic acid 2TMS0.65 ± 0.100.44 ± 0.030.03 ± 0.010.06 ± 0.020.21 ± 00.29 ± 0.150.28 ± 0.150.17 ± 0.035411.301345Glyceric acid 3TMS0.02 ± 0.010.01 ± 0tr0.01 ± 00.01 ± 0.010.02 ± 00.01 ± 00.01 ± 05611.441354Fumaric acid 2TMS0.23 ± 0.070.15 ± 0.03trtr0.02 ± 0tr0.01 ± 00.01 ± 05911.661368Maleic acid 2TMS0.06 ± 0.080.01 ± 00.01 ± 0.010.02 ± 0.010.06 ± 0.090.13 ± 0.100.05 ± 0.020.05 ± 0.076312.311413Glutaric acid 2TMS0.06 ± 00.06 ± 00.02 ± 0.010.04 ± 00.08 ± 0.020.09 ± 0.030.06 ± 00.08 ± 0.026813.511503Malic acid 3TMS0.42 ± 0.340.15 ± 0.020.01 ± 00.02 ± 00.03 ± 0.010.03 ± 0.010.07 ± 0.040.03 ± 0.017714.6215862-Hydroxyglutaric acid 3TMS0.02 ± 00.01 ± 0trtr0.01 ± 00.02 ± 0.010.01 ± 0.010.01 ± 0.019417.591840Citric acid 4TMS0.69 ± 0.210.23 ± 0.050.01 ± 00.02 ± 0.020.02 ± 00.26 ± 0.210.05 ± 0.030.01 ± 0.01TOTAL ORGANIC ACIDS5.67 ± 1.06^a^^,e^3.36 ± 0.04^a^^,e^0.71 ± 0.08^a^^,e^1.02 ± 0.13^a^^,e^2.90 ± 0.06^a^^,e^4.87 ± 2.42^a^^,e^2.35 ± 1.19^a^^,e^2.48 ± 0.43^a^^,e^**14727.802951γ-Tocopherol TMS0.01 ± 00.01 ± 00.01 ± 0.010.01 ± 00.02 ± 00.04 ± 0.040.01 ± 00.01 ± 014928.883048Stigmastan-3,5-diene0.26 ± 0.060.24 ± 0.060.11 ± 0.060.08 ± 0.030.10 ± 0.010.23 ± 0.170.12 ± 0.030.11 ± 0.0515029.233079Cholesterol TMS4.93 ± 0.802.16 ± 0.351.97 ± 0.710.29 ± 0.010.93 ± 0.355.86 ± 4.821.90 ± 1.561.12 ± 1.6315129.993145Unknown0.74 ± 0.220.49 ± 0.160.01 ± 00.01 ± 00.03 ± 0.010.03 ± 00.01 ± 0.010.02 ± 0.0115232.2533435-Cholesten-3β-ol-7-one TMS0.51 ± 0.120.30 ± 0.080.01 ± 00.01 ± 00.03 ± 0.010.02 ± 0.010.02 ± 00.01 ± 0TOTAL STEROIDS/TERPENOIDS6.44 ± 1.063.21 ± 0.452.11 ± 0.760.40 ± 0.011.11 ± 0.356.18 ± 4.612.06 ± 1.601.27 ± 1.699217.491831Arabinose 4TMS0.21 ± 0.080.10 ± 0.020.04 ± 00.08 ± 0.030.05 ± 00.85 ± 0.700.57 ± 0.400.04 ± 0.029317.571838Fructofuranose 5TMS0.24 ± 0.070.09 ± 0.010.01 ± 00.03 ± 0.020.03 ± 0.010.04 ± 0.010.08 ± 0.060.02 ± 0.019517.671847Sorbopyranose 5TMS0.08 ± 0.020.04 ± 00.01 ± 0.010.03 ± 0.010.04 ± 0.010.04 ± 0.020.14 ± 0.080.02 ± 0.0210018.451921Glucose 5TMS0.31 ± 0.040.17 ± 0.050.01 ± 00.04 ± 0.020.05 ± 0.010.48 ± 0.371.32 ± 1.040.03 ± 0.0110118.481924Talopyranose 5TMS0.08 ± 0.010.05 ± 0.010.02 ± 00.03 ± 0.010.05 ± 0.010.08 ± 0.010.13 ± 0.090.04 ± 0.0110318.591934Mannose 5TMS0.28 ± 0.020.15 ± 0.020.03 ± 0.010.04 ± 0.010.04 ± 0.030.61 ± 0.480.35 ± 0.240.05 ± 0.0310519.101981Galactopyranose 5TMS0.18 ± 0.040.28 ± 0.200.02 ± 00.03 ± 0.010.10 ± 0.040.20 ± 0.210.04 ± 0.020.04 ± 0.0310619.261996Unknown sugar0.09 ± 0.040.04 ± 0.010.02 ± 00.02 ± 0.010.02 ± 0.010.13 ± 0.100.07 ± 0.050.01 ± 010719.352006Glucopyranose 5TMS0.46 ± 0.090.24 ± 0.090.05 ± 0.020.08 ± 0.040.07 ± 0.030.82 ± 0.632.33 ± 1.820.05 ± 0.0111620.622135N-Acetyl-D-glucosamine 4TMS0.16 ± 0.010.13 ± 00.02 ± 00.04 ± 0.010.11 ± 0.010.11 ± 0.010.11 ± 0.050.09 ± 013925.392700Sucrose 8TMS0.32 ± 0.160.11 ± 0.040.05 ± 00.21 ± 0.150.12 ± 0.030.09 ± 0.030.06 ± 0.030.25 ± 0.2014626.652844Trehalose 8TMS0.11 ± 0.050.07 ± 0.050.03 ± 0.020.04 ± 0.020.06 ± 0.020.04 ± 0.020.03 ± 0.010.04 ± 0.03TOTAL SUGARS2.53 ± 0.571.47 ± 0.070.33 ± 0.050.66 ± 0.270.73 ± 0.103.50 ± 2.495.22 ± 3.870.68 ± 0.307414.311563L-Threonic acid 4TMS0.03 ± 0.010.01 ± 00.03 ± 0.010.08 ± 0.040.01 ± 00.22 ± 0.190.45 ± 0.320.01 ± 09117.241807Ribonic acid 5TMS0.38 ± 0.140.11 ± 0.010.12 ± 0.010.17 ± 0.060.28 ± 0.100.23 ± 0.070.24 ± 0.220.24 ± 0.1210218.511926Gluconic acid lactone 4TMS0.50 ± 0.080.32 ± 0.070.12 ± 0.020.10 ± 0.030.09 ± 0.010.55 ± 0.391.75 ± 1.310.07 ± 0.02TOTAL SUGAR ACIDS0.91 ± 0.210.44 ± 0.070.26 ± 0.010.34 ± 0.110.38 ± 0.101.00 ± 0.522.44 ± 1.550.31 ± 0.118616.361732Arabinitol 5TMS0.21 ± 0.090.11 ± 0.110.02 ± 00.01 ± 0.010.09 ± 0.110.14 ± 0.080.07 ± 0.020.08 ± 0.069717.811861D-Pinitol 5TMS1.62 ± 0.490.77 ± 0.050.02 ± 0.010.03 ± 0.030.41 ± 0.370.08 ± 0.030.06 ± 0.040.35 ± 0.1110819.462017Myo-inositol 6TMS0.04 ± 0.020.03 ± 00.01 ± 00.01 ± 0.010.01 ± 00.05 ± 0.030.03 ± 0.020.01 ± 011219.892061Scyllo-Inositol 6TMS0.05 ± 0.010.04 ± 0.010.01 ± 0.010.02 ± 00.03 ± 00.10 ± 0.070.32 ± 0.240.03 ± 0.0211420.462119Myoinositol TMS0.84 ± 0.140.64 ± 0.070.13 ± 0.010.04 ± 0.010.25 ± 0.080.63 ± 0.460.64 ± 0.570.42 ± 0.1211520.512125Myo-inositol 6TMS isomer0.80 ± 0.090.64 ± 0.080.16 ± 0.050.14 ± 0.040.19 ± 0.040.62 ± 0.400.68 ± 0.520.42 ± 0.12TOTAL SUGAR ALCOHOLS3.57 ± 0.832.22 ± 0.280.35 ± 0.050.26 ± 0.080.99 ± 0.381.63 ± 1.051.81 ± 1.401.31 ± 0.34^#^All metabolites showed a matching score above 800, tr: traces (< 0.01 mg/g), *Annotations confirmed with standards, ^a^significantly different from SAM-2, ^b^significantly different from TGF, ^c^significantly different from BCV, ^d^significantly different from SOF, ^e^significantly different from SAF-1, *p < 0.05, **p < 0.01, ***p < 0.001, Two-way analysis of variance (ANOVA) followed by Tukey’s Post-Hoc test was performed.Fig. 1. The concentration of major metabolite classes in caviar/roe samples expressed in mg/g. For samples codes, refer to Table 1.
Fatty acids/esters
Lipid profile is one of the key indexes of fish roe quality being the main nutrient and energy source among other macronutrients^7^. Consequently, fatty acids/esters accounted for the major metabolite class in all examined caviar and roe samples (Table 2), notably in male Sparus aurata roe (SAM-2) and black caviar (BCV) (approximately 40 mg/g, p < 0.001), followed by female Sepia officinalis roe (SOF) (32.4 mg/g, p < 0.001 compared to other samples except RCV). Likewise, saturated fatty acids were detected at the highest levels in BCV and SAM-2 being rich in palmitic acid (peak 110) at 13.1 and 9.4 mg/g, and stearic acid (peak 123) at 4.9 and 5.8 mg/g, respectively. Palmitic acid plays a major role in lipid metabolism and energy production, serving as a precursor of palmitoyl-coenzyme A^22^. However, it should be noted that several dietary guidelines have focused on reducing saturated fatty acid intake to decrease the risk of obesity-related disorders^23^.
Esters of saturated fatty acids i.e. butyl caprylate (peak 57) found at the highest level in BCV and SOF at 6.9 mg/g, likely to impart antimicrobial properties in these roe types. Butyl caprylate is incorporated in food, pharmaceuticals, and cosmetics owing to its distinctive fruity flavor^24^.
With regards to monounsaturated fatty acids, similarly SAM-2 and BCV were most rich in oleic (peak 122) (1–2 mg/g), eicosenoic (peak 131) (0.7–1 mg/g) and docosenoic acids (peak 138) (3.3 and 0.2 mg/g), with the latter reported to possess antioxidant and anti-inflammatory effects^25^.
Among omega-3 PUFAs in roe samples, eicosapentaenoic acid (peak 129) and docosahexaenoic acid (peak 135) were the most abundant in SAM-2 (0.9 and 2.9 mg/g) and SOF (1.19 and 1.7 mg/g, respectively).
Alcohols
Glycerol (peak 47) represented the major alcohol in all caviar and roe samples, with SAM-2 found richest at 6.1 mg/g followed by BCV and SAF-1 (3.5 and 2.4 mg/g, respectively). In addition to fish roes as a source of glycerol, it is reported that glycerol is added to the packaged sturgeon caviar to impart a glossy look and prevent them from adhering^26^.
Organic acids
Organic acids represented the second major metabolite class in caviar and roe samples, specifically SAM-2 (28.7 mg/g, p < 0.001) and SAF-1 samples (12.4 mg/g, p < 0.001 compared to other samples except BCV and SOF where p < 0.01), represented by lactic acid as major form at 26 and 10 mg/g. The enrichment of lactic acid is consistent with previous reports on other fish roe such as Oncorhynchus keta (salmon), Cyclopterus lumpus (lumpfish), Mallosus villosus (capelin), Oncorynchus mykiss (rainbow trout), Esox lucius (pike), Gadus morhua (cod), Alaska Theragra chalcogramma (pollock)^10^. Lactic acid exerts potential preservative action in raw roe, functioning as an acidulant to lower pH, limit microbial growth, and enhance storage stability, especially in roe types such as pike and Alaska pollock^10^.
Most roe samples demonstrated low levels of 4-hydroxybutyric acid, from 0.31 mg/g in roe of female crab Charybdis natator (CNF) up to 1.5 mg/g in red caviar (RCV). This neuromodulator has a sedative effect, acting as a GABA precursor^27^.
Amino acids
Amino acids were most rich in female collector urchin Tripneustes gratilla roe; TGF at 17.2 mg/g (p < 0.001), especially enriched in glycine (peak 51, 12.8 mg/g) in agreement with Schmidt et al.^7^, followed by SOF and SAM-2 at 13.5 and 12.9 mg/g, respectively. Meanwhile, SOF contained high levels of N, N-dimethylglycine (peak 3) at 7.4 mg/g.
N, N-dimethylglycine is reported to exert an immunostimulant effect and to improve physical and mental performance^28^. Other essential amino acids such as valine, leucine, isoleucine, threonine, and phenylalanine were especially abundant in common cuttlefish samples i.e., SOF and SOM. These amino acids are of nutritional value in roe being critical for protein synthesis^29^ and to improve performance, health, and immunity^30^.
High content of pyroglutamic acid (represented by peaks 71 and 76) was detected in roe of male and female S. aurata (SAM-2 and SAF-1) at 6.65, 3.6 mg/g, respectively, likely produced via enzymatic and non-enzymatic reactions mediating its formation. Pyroglutamic acid contributes to the sensory properties of processed foods, being able to sequester the bitter taste of amino acids such as valine, leucine, and isoleucine, and to elicit the more favored umami taste. Moreover, pyroglutamic acid possesses antimicrobial, antidiabetic and anti-hyperlipidemic properties^31^, suggesting that S. aurata (SAM-2 and SAF-1) presents a good source of that key amino acid with the best umami taste among examined fish roe.
The conditionally essential amino acid glycine (peaks 21, 22, and 51), along with its biosynthetic precursors sarcosine (peak 17) and L-serine (peak 45) were among the major identified amino acids in the examined caviar and roe samples (Table 2). Glycine plays a vital role in the biosynthesis of porphyrins (such as heme) and glutathione, cytoprotection, and neurotransmission^32^. Additionally, β-Alanine (peak 64) was enriched in most samples. This amino acid is of nutraceutical interest being used to improve muscular performance^33^.
Nitrogenous compounds
Likewise in the case of some amino acids accumulation, S. aurata (SAM-2 and SAF-1) samples were found most rich in nitrogenous compounds (13.7 and 8.7 mg/g, respectively) with creatinine (peak 75) as major form in both samples (4–7 mg/g). Next, remarkable levels of urea (peak 42) were detected in all caviar/roe samples (0.4–3.9 mg/g) with red caviar (RCV) being the richest. The anti-nutrient nitrogenous compound cadaverine (peak 62) was found at 1.68 mg/g in SAM-2, which is a biogenic amine produced as a decomposition product resulting from the bacterial decarboxylation of lysine. Hence, its presence is suggestive for fermentation reaction that might have occurred in these samples. The high levels of urea and creatinine are suggestive to more active protein metabolism indicating a higher nutritional quality^34^.
Sugars/sugar alcohols
The collector urchin sample (TGF) and the common cuttlefish sample (SOM) were found richest in total sugars (7.1 and 5.2 mg/g, respectively), with β-D-glucopyranose (peak 107) as the main sugar. Sugars remain the least studied class in caviar/roe, with higher carbohydrate content in sea urchin than cuttlefish^7^. A moderate sugar level was observed in black caviar (BCV) (2.5 mg/g), slightly higher than red caviar (RCV) (1.5 mg/g).
Other detected sugars included β-D-galactose (2.61 mg/g in SAM-2) and sucrose (2.01 mg/g in TGF). With regard to sugar alcohols, myo-inositol was the major form detected at higher levels in black caviar (BCV) (1.7 mg/g) and S. aurata roe (SAM-2) (1.5 mg/g), though at considerably lower levels compared to free sugars.
Steroids/terpenoids
Steroids/terpenoids, secondary metabolite class, were found more prominent in BCV and SOF at 6 mg/g, represented by cholesterol (peak 150) as the most abundant form at 5 mg/g. Fatty fish, e.g., salmon, is known to accumulate high cholesterol levels in roe^7^. On the other hand, except for ridged swimming crab roe (CNF), the other crustacean samples (PPF-1, PPF-2, and CNM) showed less cholesterol levels (0.1, 0.3, and 0.3 mg/g, respectively) than fish roes in line with^7^.
Multivariate data analysis of caviar and roe samples GC–MS datasets
To provide insight into caviar metabolome heterogeneity concerning interspecies and gender-related variability, different models of multivariate data analysis were implemented in an unsupervised i.e., PCA and HCA, and a supervised method, i.e., OPLS-DA.
Relative similarities and variabilities among different roe samples were first unveiled by the unsupervised multivariate analysis tool PCA. This model covered 57% of the total variance embedded in samples. Although some replicates of Sparus aurata segregated in the right lower quadrant of the PCA score plot (Supplementary Fig. S3), no other discrimination or grouping of samples could be achieved. Additionally, this model had unsatisfactory prediction power.
To improve predictability and discrimination among samples, OPLS-DA model was constructed using all roe samples from different families to obtain an initial comprehensive outline of compositional differences among samples, with the model accounting for 56% of the total variance. The OPLS-DA score plot (Fig. 2A) did not provide a clear discrimination among most of the samples except for those obtained from S. aurata represented by 4 samples: SAM-1, SAF-1, SAM-2, and SAF-2. Indeed, three of the 4 S. aurata roe samples segregated towards the right side of the score plot with positive PC1 values (SAM-2, SAF-1, and SAM-1), whereas two specimens (SAM-2 and SAF-1) clustered uniquely negative to PC2. Additionally, black caviar (BCV) and cuttlefish Sepia officinalis roe (SOF) as well as the red caviar sample (RCV) clustered in the right upper quadrant of the score plot (Fig. 2A). Several metabolites from different classes contributed towards the segregation of S. aurata samples, as revealed from loading plot (Fig. 2B), including pyroglutamic acid, creatinine and lactic acid. The highest content of pyroglutamic acid, creatinine and lactic acid was detected in S. aurata, namely SAM-2 (p < 0.05, 0.01, and 0.001, respectively) and SAF-1 roes and accounting for their segregation along PC2 (Fig. 2B). Interestingly, SAM-2 and SAF-1 were the most enriched in nitrogenous compounds and organic acids. It is worth mentioning that palmitic acid may also mediate for the clustering of BCV, SOF, and RCV, positively contributing to PC1 and PC2 (Fig. 2B). Substantial level of palmitic acid was found in these samples with BCV being the richest (p < 0.001 compared to all other samples except SOF, RCV, and SAM-2) and in agreement with quantification results at 13.1 mg/g (Table 2). Other lipids contribute to such clustering, including stearic acid and cholesterol, with the latter being most abundant in the SOF sample (5.9 mg/g). Interestingly, S. officinalis roe (SOF) represents a good fat source considering its high content of omega-3 PUFA (i.e., eicosapentaenoic acid and docosahexaenoic acid) alongside γ-tocopherol, in agreement with previous studies^12^ with a favored n-3/n-6 ratio of 8.6. Meanwhile, the collector urchin roe sample (TGF) presented the least n-3/n-6 ratio of 0.7, and following previously reported data of sea urchin roe^35^.Fig. 2GC–MS-based orthogonal partial least squares discriminant analysis (OPLS-DA) of caviar/roe metabolome explaining 56% of the total variance (n = 3). (A) OPLS-DA score plot. (B) OPLS-DA loading plot with contributing metabolites assigned. (C) OPLS-DA derived dendrogram. For samples codes, refer to Table 1.
The OPLS-DA-derived dendrogram (Fig. 2C) placed SAM-2 distinctly in a separate cluster, indicating its unique composition, whereas BCV, RCV, and SOF were nested in a branch of the other cluster. Aside from that, the model did not succeed in providing good discrimination of the remaining samples. Separate models were thus created for caviar samples from each family to achieve better segregation, higher prediction power and to improve markers identification for each taxon.
Metabolic variability in Sparus aurata and Rhabdosargus haffara roe, Sparidae Family
A separate PCA model was generated for roe samples belonging to the family Sparidae. Sparidae, commonly known as porgies or seabreams, includes many popular food fish of remarkable commercial importance e.g., S. aurata (gilt-head bream)^36^. The rapid development in gilt-head bream production in the Mediterranean Sea led to the saturation of its market emphasizing the need to develop unconventional value-added products^37^. Sparidae is represented by one R. haffara roe sample from the Red Sea; RHF and 4 S. aurata roe samples from the Mediterranean Sea*,* namely SAM-1, SAF-1, SAM-2, and SAF-2 (Table 1). The first two Principal Components (PC-1 and PC-2) explained 78% of the total variance among Sparidae. The model revealed clustering of R. haffara sample (RHF) alongside the female S. aurata sample (SAF-2) with negative score values along PC1, versus the positioning of S. aurata SAM-2 and SAF-1 roe on the other side with positive PC1 values (Fig. 3A). Such clustering pattern was attributed for the rich content of palmitic acid, glycerol, pyroglutamic acid, creatinine and lactic acid in SAM-2 and SAF-1 among all Sparidae accessions (Fig. 3B). In fact, SAM-2 and SAF-1 showed the highest content of amino acids, fatty acids, and organic acids in Sparidae (Table 2). Moreover, enriched levels of nitrogenous compounds represented by creatinine and cadaverine were observed in SAM-2 and SAF-1 among all examined caviar/roe samples, not only Sparidae. Although cadaverine level is still within the acceptable limit, the intake of this biogenic amine should be carefully controlled for consumers’ safety, as it can potentiate the toxic effects of other biogenic amines, leading to nervous and cardiovascular adverse effects^38,39^, and warranting for its monitoring in plant and animal-based food products. Similarly, the HCA dendrogram grouped SAM-2 and SAF-1, while RHF and SAF-2 were positioned in a separate cluster (Fig. 3C). Both RHF and SAF-2 samples displayed the least contents of amino acids, fatty acids, organic acids, sugars, and nitrogenous compounds among Sparidae, suggestive of a less nutritive value. No clear discrimination was observed between R. haffara (RHF) and S. aurata (SAF-2) despite being of different taxa suggesting close metabolite composition in the subfamily Sparinae^40^.Fig. 3GC–MS-based principal component analysis (PCA) and hierarchical cluster analysis (HCA) of Sparidae roe metabolome (n = 3). (A) PCA score plot of PC1 versus PC2 describing 67% and 11% of the total variance, respectively. (B) Loading plot with the most contributing metabolites assigned. (C) HCA derived dendrogram. For samples codes, refer to Table 1.
Metabolome classification of crab roe (Portunus pelagicus and Charybdis natator, Portunidae Family) in context to taxa and gender type
PCA modeling of crab roe samples belonging to family Portunidae represented by P. pelagicus (PPF-1 and PPF-2) from the Mediterranean Sea and C. natator (CNM and CNF) from the Red Sea (Table 1), accounting for 78% of the total variance, clearly separated crab roe of P. pelagicus (PPF-1 and PPF-2) from C. natator (CNM and CNF) alongside PC1 (Fig. 4A). This finding was in agreement with the previously reported DNA barcoding-based phylogeny that placed P. pelagicus distant from C. natator^41^. Interestingly, male and female C. natator roe specimens (CNM and CNF, respectively) were segregated along PC2, revealing gender-based differences in Portunidae samples, which have yet to be confirmed from other taxa for results to be conclusive.Fig. 4GC–MS-based PCA of Portunidae roe metabolome (n = 3). (A) PCA score plot of PC1 versus PC2 describing 58% and 20% of the total variance, respectively. (B) Loading plot with the contributing metabolites assigned. For samples codes, refer to Table 1.
Metabolites accounting for such segregation along PC1 (Fig. 4B) included butyl caprylate, urea, serine, 4-hydroxybutyric acid, and stearic acid, found more abundant in P. pelagicus samples (PPF-1 and PPF-2) among the 4 examined Portunidae samples. On the other hand, oxylipids represented by palmitic, oleic, and palmitoleic acids alongside cholesterol segregated female C. natator (CNF) in the left upper quadrant of the score plot. Specifically, CNF was the richest Portunidae sample in these fatty metabolites. In contrast, N, N-dimethylglycine accounted for the separation of male C. natator (CNM). Indeed, male specimens were the richest in amino acids among all examined Portunidae samples, versus the richness of females in lipids. These findings match the gender-related lipid variation in fish and crab meat and gonads, where females exhibited significantly higher lipid content than males. Female crabs are known to accumulate more fat reserve to provision the developing eggs and in some Asian countries, female crabs are highly prized due to their unique aroma and texture^42–44^. However, more samples are required to strengthen this conclusion.
Gender variability within Charybdis natator, Sparus aurata, and Sepia officinalis roes
Considering the identification of a gender effect on roe composition in C. natator (Fig. 4), it was of interest to identify variation in male and female fish roe within other taxa for results to be conclusive using supervised OPLS-DA. A series of supervised OPLS-DA models were constructed. In the first model (Supplementary Fig. S4), male C. natator roe samples (CNM) were modeled against female (CNF) to identify markers for each gender type. As expected, and in line with the PCA model (Fig. 4), amino acids e.g., N, N-dimethylglycine, and isoleucine appeared enriched in male C. natator roe, compared with cholesterol, palmitic acid, and palmitoleic acid found more abundant in female crab roe (OPLS-DA score plot, Fig. S4). It should be noted that differences between male and female C. natator roe were, though not statistically significant, with a p value of 0.326 necessitating larger-scale study.
Two other OPLS-DA models were generated to classify male (SAM-1 & SAM-2) and female (SAF-1 & SAF-2) S. aurata samples, and between male (SOM) and female (SOF) S. officinalis samples. These models, though, showed weak prediction power with high permutation p values suggesting no significant differences between male and female roe of these taxa.
Metabolome classification of black caviar vs red caviar
Genuine black caviar, the most valued edible roe product, is obtained from sturgeon fish (Huso and Acipenser spp.), whereas its related inferior belongs to acipenseriformes species Polyodon spathula^1^. Fish roe obtained from non-sturgeon origin is used as a caviar substitute, such as salmon roe (commonly known as red caviar)^2^. To assess interspecies variability between black (BCV) and red caviar (RCV) and markers for each taxon, BCV was modeled against RCV in a separate OPLS-DA model. The model showed R2 and Q2 values of 0.99 indicating a good classification performance and validated using permutation test with 20 times and CV-ANOVA which demonstrated that the model is not over fitted (Supplementary Fig. S5). As illustrated in the OPLS-DA score plot (Fig. 5A), BCV and RCV were segregated along PC1 which represents 71% of the total variance. These markers contributing to such segregation are highlighted in the OPLS-DA-derived S-plot (Fig. 5B). The fatty metabolites, namely palmitic acid, cholesterol, and 1-monopalmitin, as well as glycerol, were responsible for the segregation of black caviar negative to PC1. The VIP scores of the most discriminatory variables are shown in Supplementary Fig. S6 and Table S1. In contrast, red caviar segregation to the right side of the score plot was attributed to its richness in urea (3.9 mg/g) and L-serine (1.4 mg/g), indicating active protein metabolism. In terms of total amino acid content in red and black caviar, similar levels were detected at 3.6 and 3.7 mg/g, respectively, and in compliance with previous reports^13,45^. Meanwhile, quantification results of black caviar revealed its richness in palmitic acid (13.1 mg/g) and 1-monopalmitin (2.9 mg/g), and the second richest in cholesterol (4.9 mg/g) and glycerol (3.5 mg/g) among all roe samples. Interestingly, both black and red caviar were found rich in nutrients, especially fatty acids/esters, which can be related to their ecological habitat. Sturgeons and salmon are anadromous fish that spawn in freshwater poor in nourishment and hence lay eggs rich in nutrients to ensure adequate supply to the new generation^10,13^. Black caviar recorded superior amounts of fatty acids/esters (40.2 mg/g) than red caviar (29.6 mg/g) (p < 0.001) in agreement with Mol et al.^45^. In contrast, Bledsoe et al. reported a different profile with higher crude lipid content in salmon caviar than black caviar, concomitant with substantial levels of cholesterol in salmonoid roe^2^. Comparative profiling of crude lipid content in black and red caviar from different origins is required using specific lipid extraction methods for results to be more conclusive.Fig. 5(A) OPLS-DA score plot derived from modelling black caviar (BCV) against red caviar (RCV) explaining 87% of the total variance (n = 3). (B) S-plot shows the covariance p[1] against the correlation p(corr) [1] of the discriminating component variables. Selected assigned variables are highlighted in the S-plot (validation metrics provided in Fig. S5 and VIP scores in Fig. S6 and Table S1).
Classification of genuine black caviar from non-sturgeon roe substitutes
Considering the high value of black caviar, it was of interest to use models to discriminate between genuine black caviar obtained from sturgeons and other roe samples of non-sturgeon origin. BCV was modeled against other roe samples to visualize differences and identify markers unique to BCV from other common roe products. The model showed a good fitness and predictive power as implied by R2 and Q2 (0.78 and 0.67) and validated using permutation test with 20 times and CV-ANOVA (Supplementary Fig. S7). The model successfully discriminated BCV as an outlier from the remaining samples as illustrated in the OPLS-DA score plot (Fig. 6A), reflecting a quite divergent chemical composition. Variables that most influenced such segregation included palmitic acid (p < 0.001 compared to all non-sturgeon roe, except SOF, RCV, and SAM-2), 1-monopalmitin ester, and cholesterol as highlighted in the S-plot (Fig. 6B) in compliance with the previous model (Fig. 5) with their VIP scores depicted in Supplementary Fig. S8 and Table S2.Fig. 6(A) OPLS-DA score plot derived from modelling black caviar (BCV) against other roe samples describing 47% of the total variance (n = 3). (B) S-plot shows the covariance p[1] against the correlation p(corr) [1] of the discriminating component variables. Contributing markers are highlighted (validation metrics provided in Fig. S7 and VIP scores in Fig. S8 and Table S2).
In all models employed to differentiate between various caviar/roe types, lipid profile, especially the saturated fatty acid palmitic acid and cholesterol, played a major role in discrimination, posing them as discriminatory markers in QC of caviar/roe products^1,45,46,47^. Variability in fatty acids among different caviar/roe samples was mainly quantitative rather than qualitative, in agreement with earlier reports^45^. With regards to gender influence, no significant differences were found between male and female roe samples in the examined taxa with no gender-specific metabolite markers.
However, the findings of the present study should be considered in light of some limitations. The relatively small sample size may undermine the statistical power and restrict generalizability. Future research will require large-scale studies with larger sample sizes spanning several collection sites to strengthen statistical comparisons and place the study in a broader context. Meanwhile, environmental influences of water temperature, salinity, and diet can compromise the metabolomic data by introducing variables which cannot be controlled^17^. Larger standardized studies are warranted to validate and extend the present findings.
Conclusion
The study provided detailed metabolite profiling of different caviar and roe samples obtained from 10 commercially important taxa representing both male and female fish, and aquatic animal specimens, highlighting their functional potential and metabolic heterogeneity. A total of 139 metabolites were identified and quantified, including fatty acids/esters, alcohols, amino acids, organic acids, sugars, nitrogenous compounds, and steroids/terpenoids. The most prevalent metabolite class among examined caviar and roe samples was fatty acids/esters. The relative high levels of omega-3 polyunsaturated fatty acids exemplified by eicosapentaenoic acid and docosahexaenoic acid detected in roe of male gilt-head bream Sparus aurata and female common cuttlefish Sepia officinalis suggest their potential relevance for nutritional or functional food applications. Moreover, S. officinalis roe presented rich γ-tocopherol content, with best n-3/n-6 ratio up to 8.6, posing it as good fat source among all examined caviar and roe samples. Another metabolite class detected in caviar and roe samples was alcohol likely derived from fat hydrolysis. Amino acids, critical for protein synthesis, were abundant in the collector urchin Tripneustes gratilla exemplified by glycine and N, N-dimethylglycine as major forms. The rich content of pyroglutamic acid in gilt-head bream roe may contribute to its characteristic sensory attributes, though this requires confirmation through sensory analysis. Interspecies and gender-related variability was further explored via multivariate modeling of GC–MS dataset, where lipids especially palmitic acid/ester and cholesterol, were the main contributors in the discrimination of caviar from non-sturgeon roe samples. Such extensive metabolite profiling accentuates heterogeneity in chemical profile between various caviar and roe types facilitating the quality control, authenticity assessment, and nutritional labeling of caviar and roe products. This study opens the door for further investigations on potential health benefits of caviar and fish roe as functional ingredients and targeted breeding programs to improve selected traits such as omega-3 content and umami taste.
Supplementary Information
Supplementary Information 1 Supplementary Information 2
The reference list from the paper itself. Each links out to its DOI / PubMed record.
- 1Holeček, M. Glycine as a conditionally essential amino acid and its relationship to l-serine. Metabolism, 156330 (2025).10.1016/j.metabol.2025.15633040527450 · doi ↗ · pubmed ↗
- 2T Abo-Hashesh, A., F Madkour, F., S Sallam, W., M Hanora, A. & K Ashour, H. Phylogenetic analysis and identification of Charybdis natator (Herbst, 1794) from the Egyptian Coast of the Red Sea. Egypt. J. Aquatic Biol. Fish.24, 417–426 (2020).
- 3Islam, T. et al. Nutritional properties of wild and fattening mud crab (Scylla serrata) in the south-eastern district of Bangladesh. Heliyon 8 (2022).10.1016/j.heliyon.2022.e 09696 PMC 919832235721687 · doi ↗ · pubmed ↗