Macronutrient intakes and associations with psoriasis severity: a cross-sectional analysis of the asking people with psoriasis about lifestyle and eating (APPLE) study
Sylvia Zanesco, Thiviyani Maruthappu, Christopher E. M. Griffiths, Ruotong Zhang, Kathryn V. Dalrymple, Rachel Gibson, Wendy L. Hall

TL;DR
This study found that people with psoriasis in the UK consume too much sugar and not enough fiber, and that high sugar intake from drinks is linked to more severe psoriasis.
Contribution
The study provides new insights into macronutrient intakes and their associations with psoriasis severity in the UK population.
Findings
Participants with psoriasis overconsume free sugars and underconsume fiber compared to dietary guidelines.
Higher sugar intake from beverages is associated with increased psoriasis severity, though BMI partially explains this link.
Plant-based protein sources are inversely associated with psoriasis severity, while meat-based protein is positively associated.
Abstract
Nutrition in psoriasis management is an area of active research interest, but estimates of macronutrient intakes are lacking. The present study aimed to assess macronutrient intakes of people living with psoriasis in the UK and explore the relationship between their dietary sources and psoriasis severity. This was an online cross-sectional study collecting diet and psoriasis severity information from adults with psoriasis. Responses to a Food Frequency Questionnaire and the self-assessed Simplified Psoriasis Index were used to determine nutrient intakes and psoriasis severity. Relative to Dietary Reference Values, participants with psoriasis (n = 257) reported an overconsumption of % energy from free sugars (median 11.2%, IQR 2.6–37.6) and an underconsumption of fibre (20.2 g/day, IQR 5.9–44.0). Compared to participants in the lowest quartile of intake, those in the highest quartile…
Genes, proteins, chemicals, diseases, species, mutations and cell lines named across the full text — each resolved to its canonical identifier and authoritative record.
Click any figure to enlarge with its caption.
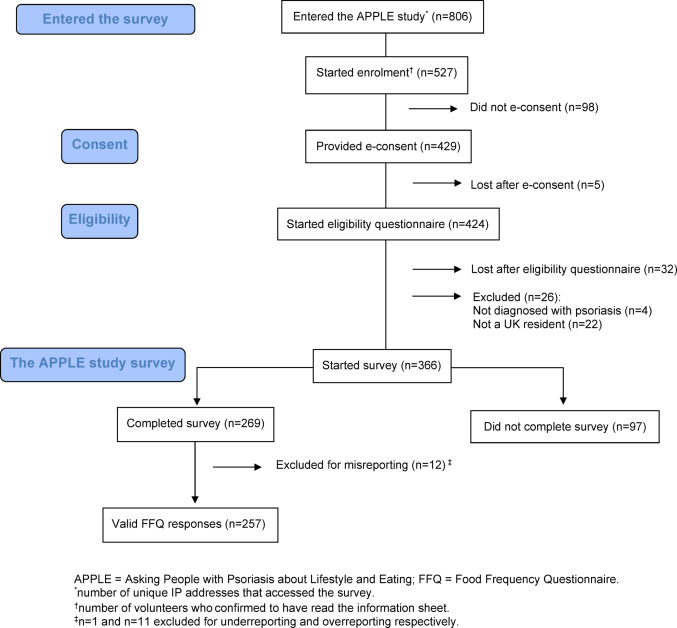 Figure 1
- —http://dx.doi.org/10.13039/100013126Psoriasis Association
Peer Reviews
No public reviews on file for this paper yet. If you reviewed it on a platform where reviews are public (OpenReview, ICLR, NeurIPS, ICML), you can paste yours below so the community can read it here.
Videos
No videos yet. Explain this paper in a talk, walkthrough, or lecture? Add one.
Taxonomy
TopicsPsoriasis: Treatment and Pathogenesis · Dermatology and Skin Diseases · Skin Protection and Aging
Introduction
Psoriasis is a chronic inflammatory skin condition affecting 2% of the population in the United Kingdom (UK) [1]. People with psoriasis have an increased susceptibility to developing comorbid diseases such as obesity, type 2 diabetes (T2D), metabolic syndrome, and cardiovascular disease (CVD) [2], whose onset can potentially be influenced by dietary habits [3].
In the UK, unlike clinical guidelines for conditions such as CVD and T2D [4, 5], psoriasis management lacks dietary recommendations as an adjunct to medical treatment. However, dietary management is of importance to those living with the condition, where understanding the role of diet in managing psoriasis is the top research priority of the Psoriasis Priority Settings Partnership of the UK Psoriasis Association [6]. A recent Cochrane review highlighted the lack of high-quality, robust evidence from trials assessing the impact of diets on psoriasis symptoms [7]. In the absence of evidence-based dietary recommendations, psoriasis continues to be managed pharmacologically, with no authoritative nutrition advice, except for weight loss recommendations in adults with overweight or obesity [8].
There is limited knowledge regarding optimal macronutrient intakes in people with psoriasis, although several studies have characterised the nutritional intakes of those living with the condition. For instance, a retrospective analysis of the National Health and Nutrition Examination Survey (United States) revealed that individuals living with psoriasis (n = 156) reported significantly lower sugar intakes compared to those without psoriasis [9]. In contrast, a Japanese case–control study (n = 70) reported higher sugar consumption among individuals with psoriasis and psoriatic arthritis compared to matched healthy controls, with no significant differences observed in total fat, protein, or fibre intake [10]. Findings from an Italian case–control study of males with psoriasis (n = 41 cases) revealed higher intakes of total fat, total and simple carbohydrates, and lower intakes of fibre and protein compared to matched controls [11]. These findings are consistent with an Iranian case–control study (n = 45 cases), although this study included both males and females with psoriasis [12].
Prior to deriving nutrition recommendations, characterising diet and understanding areas of adequacy and improvement are paramount. To our knowledge, no study has examined the macronutrient intakes of people living with psoriasis in the UK, and we therefore aimed to:
- Describe macronutrient intakes of people with psoriasis for comparison with those of a nationally representative sample, and to compare with Dietary Reference Values (DRVs)
- Evaluate associations between sources of macronutrient intakes and disease severity
Methods
Study design
Diet, lifestyle, and psoriasis information were cross-sectionally collected from UK adult volunteers with psoriasis responding to an open web-based survey [13] as part of the Asking People with Psoriasis about Lifestyle and Eating (APPLE) study (NCT05448352) [14]. The APPLE study was approved by the King’s College London (KCL) Research Ethics Committee (REC) (LRS/DP-21/22-29257) and the London—Westminster National Health Service REC (23/LO/0536). This manuscript was written according to the Strengthening the Reporting of Observational Studies in Epidemiology—Nutrition (STROBE-NUT) [15] and the Checklist for Reporting Results of Internet E Surveys (STROBE-CHERRIES) [16] (Supplementary Tables 1–2). Appendix 1 describes the survey design, development, and metrics.
Recruitment
Participants were recruited by convenience sampling between June 2022 and January 2024. The study was accessible on the study-specific landing page and was publicised on social media [17] and within the KCL fortnightly recruitment newsletter distributed to staff and students. No initial contact was made with potential participants. The UK Psoriasis Association (funding organisation) assisted with recruitment by inviting members of their research network, a member community interested in psoriasis research, to participate in the study and by advertising the study on their social media platforms.
Psoriasis severity
Participants self-reported their psoriasis severity using the self-assessed Simplified Psoriasis Index (sa-SPI) integrated into the survey. The sa-SPI is a validated scoring measure generating a psoriasis severity score between 0 and 70 points based on severity, psychosocial impact, and intervention history components [18]. Scores between 0 and 9 points were considered mild psoriasis, 10 – 19 points as moderate psoriasis, and 20 – 70 points as severe psoriasis.
Demographic and lifestyle variables
Age, sex, weight, height, and smoking status were self-reported. Weight and height were used to calculate Body Mass Index (BMI). Participants were considered to have a psychological morbidity if “Yes” was selected for “Depression” or “Anxiety” concerning the question “Have you ever been medically diagnosed with any of the following conditions?”. The Alcohol Use Disorders Identification Test Consumption (AUDIT-C) evaluated alcohol use by scoring the frequency, units, and over-consumption of alcohol using a 5-point Likert scale for a maximum of 12 points [19].
Dietary assessment
Total energy intakes (kcal/day) were determined from participant responses to a modified European Prospective Investigation into Cancer and Nutrition (EPIC) Food Frequency Questionnaire (FFQ), considering intakes over the past 12 months. Intakes of < 500 or > 3500 kcal/day for females and < 800 or > 4200 kcal/day for males were omitted from the analysis [20]. Modifications to the original 131-item EPIC FFQ [21] included omitting 4 food items and introducing 20 items for a total of 147 items [22]. Frequency responses were converted to portion fractions and were multiplied by standard portion sizes to calculate the weight of food per day (g/day) for each food item. The energy content (kilocalories) and macronutrient composition (protein, total metabolisable carbohydrate (excluding fibre), total sugars, free sugars, total fat and fractions of dietary fat, and fibre (Association of Official Analytical Chemists (AOAC)) of each food item was obtained using the Composition of Food Integrated Dataset (CoFID) [23] and where data was missing the FoodCentral database was used instead [24]. Free sugars were calculated for each food item using the Scientific Advisory Committee on Nutrition (SACN) definition of “monosaccharides and disaccharides added to foods by the manufacturer, cook or consumer, plus sugars naturally present in honey, syrups, and unsweetened fruit juices. Under this definition, lactose, when naturally present in milk and milk products, is excluded” [25]. If unavailable, the cis-monounsaturated fatty acids (MUFAs) per 100g of food were determined by subtracting trans-MUFAs from the total MUFA content per 100g of the given food.
Quantifying macronutrient intakes
Intakes of protein, carbohydrates, starch, total sugars, free sugars, total fat, saturated fat (SFA), total MUFAs, cis- and trans-MUFAs, total polyunsaturated fatty acids (PUFAs), n-6 and n-3 PUFAs, were expressed in contribution to energy as percentages of total energy intake. AOAC fibre was reported as an absolute value in g/day and converted into g/1000 kcal for statistical analyses, where the total daily fibre intake (g/day) is multiplied by 1000 kcal and divided by the total energy intake kcal/day.
Comparisons with UK government guidelines
Macronutrient intakes of the study population were compared with UK government recommendations. For carbohydrates and fats, UK guidelines are reported as DRVs, expressed as a percentage of total energy intake per day. Percentage of total energy intakes of total fat, SFA, MUFAs, n-3 and n-6 PUFAs, free sugars and g/day of fibre were dichotomised into intakes above or below the adult DRVs and expressed as the frequency (n) and proportion (%) of participants meeting, or not meeting, the set DRVs [25, 26].
Comparisons with the UK population
Macronutrients reported as median (95% Confidence Intervals (CI)) per day, were compared with the intakes (from food sources only) of the general UK population using data from the National Diet and Nutrition Survey (NDNS); a rolling programme (RP) and cross-sectional study in the UK that collects representative information on the nutritional intakes of the UK population [27]. The diet assessment methodology of the NDNS is based on a series of 4-day food diaries. Intakes of the APPLE study population were compared to the NDNS RP Adult participants (between 19 and 64 years old) from Years 9–11.
Macronutrient sources
Since the quality and source of dietary macronutrients may determine their relationships with health outcomes, macronutrient intakes found to be significantly correlated with psoriasis severity were further categorised into the proportions derived from food groups (Appendix 2). The sources of macronutrient intakes were expressed as a percentage contribution of the food group towards the total intake of that macronutrient. For example, % protein from red meat was calculated as the sum of protein from red meat sources (g/day) / total protein (g/day) × 100. Protein intakes from total meat, red meat, processed meat, poultry, fish, high-fat dairy, low-fat dairy, legumes, nuts, and eggs were calculated [28]. Fibre intakes were calculated from fruits, vegetables, potato products, wholegrain cereals, and non-wholegrain cereals as defined in a previous UK population study [29], with the addition of fibre from tree nuts. Free sugars were calculated from desserts and puddings, beverages, added sugars and condiments, and breakfast cereal. Intakes of n-6 PUFAs were calculated from nuts, fat-based spreads, red meat, processed meat, poultry, and eggs.
Statistical analysis
Data was visually examined for normality using Q-Q plots and histograms. Information on demographic, anthropometric, and lifestyle characteristics was tabulated into descriptive statistics reporting the median (interquartile range [IQR]) for continuous variables, and frequency (n) and proportion (%) for categorical variables. The consumption (in g/day) of food groups was reported per tertile of psoriasis severity as mean (standard deviation [SD]). Macronutrient intakes were dichotomised to report the frequency (n) and proportion (%) of participants whose dietary intakes align with the adult DRVs.
Macronutrients were reported as the median (95% CI) to compare with NDNS data. Variables from the NDNS Year 9–11 RP were corrected using weights to adjust for socioeconomic status and non-responsiveness to reduce selection and non-response bias [30]. The weight factor used was wti_Y911 (Weight for individual and diary-all ages, combined Y9-11) to analyse macronutrient intakes of the NDNS population. Supplementary Table 3 provides the demographic characteristics of the representative UK population sample from the NDNS (n = 1392).
To obtain parametric distributions, non-parametric variables were fractionally ranked and transformed using the Inverse Distribution Function (IDF). Correlations between food groups and macronutrients with psoriasis severity were examined with Pearson’s correlation coefficient. Associations between macronutrient source and psoriasis severity were reported as the Odds Ratio (OR) and 95% CI, obtained from multinomial logistic regressions with P for trend analyses. Macronutrient intakes (by food group source) were evaluated in quartiles, with the lowest intake category (Q_1_) as the reference, and Q_4_ as the highest category. Models were adjusted in an additive sequence of covariates. Model I included age (years, continuous), sex (male or female), and smoking status (active smoker or non-smoker). Model II included model I plus the AUDIT-C score (continuous). Model III included model II plus psychological morbidity (yes or no). Model IV included model III and BMI (continuous). P < 0.05 was considered statistically significant. Analyses were performed with IBM SPSS Statistics (version 29.0.0.0) and R software (version 4.43) (for the trend analyses).
Results
Survey responses
Figure 1 illustrates the CONSORT flow diagram for the APPLE study. There were 806 unique site visitors, of which 429 provided consent, and 366 participants started the APPLE study survey. This translates into a view rate (the number who started enrolment out of unique site visitors) of 65% and a participation rate (the number who e-consented out of those who started enrolment) of 81%. Ninety-seven participant responses (27%) were excluded as their survey response was terminated partway through and therefore did not complete the FFQ. A further twelve entries (4%) were excluded from the nutrition analyses for misreporting energy intakes [20]. Data was analysed from the remaining 257 participants with complete survey responses, for a completion rate of 60% (number completed out of total number consented).Fig. 1CONSORT flow chart
Demographic characteristics
The demographic characteristics of participants with valid survey responses are presented in Table 1. Participants were predominantly non-smoking (82%), females (83%), of white-British ethnicity (85%), with a median (IQR) psoriasis severity score of 15 (12). The median (IQR) age was 40 (20) years, and BMI was 25 (8) kg/m^2^, with 51% categorised as having overweight or obesity. Approximately two-thirds (60%) of participants were at a low risk of alcohol over-consumption. The most prevalent comorbidities were anxiety (41%), depression (25%), and psoriatic arthritis (21%) (Supplementary Table 4).Table 1. The demographic characteristics of APPLE study participants with valid survey responses (n = 257)Age, years (median, IQR)40 (20)Sex (n, %) Male45 (17.5) Female212 (82.5)BMI (median, IQR)25 (8)Body Mass Index (BMI) classification (n, %) Underweight7 (2.8) Healthy weight118 (46.5) Overweight67 (26.4) Obesity62 (24.3)Ethnicity (n, %) White-British218 (84.8) White (Other)16 (6.3) Mixed10 (3.8) South Asian9 (3.5) Asian (Other)3 (1.2) East Asian1 (0.4)Smoking status (n, %) Non-smoking211 (82.1) Actively smoking45 (17.5) Preferred not to say1 (0.4)Alcohol overconsumption (n, %) Low risk of dependency154 (59.9) Increasing risk of dependency80 (31.1) Higher risk of dependency20 (7.8) Possible dependence3 (1.2)Family history of psoriasis (n, %) Yes137 (53.3) No120 (46.7)Psoriasis severity (median, IQR)15 (12)Psoriasis severity (n, %) Mild62 (24.1) Moderate115 (44.7) Severe80 (31.2)n = 3 missing values for BMI due to lack of completenessUnderweight BMI < 18.50 kg/m^2^; normal weight BMI ≥ 18.50 kg/m^2^ and ≤ 24.99 kg/m^2^; overweight BMI ≥ 25.00 kg/m^2^ and ≤ 29.99 kg/m^2^; obesity BMI ≥ 30.00 kg/m^2^Risk of alcohol overconsumption was determined using the Alcohol Use Disorders Identification Test Consumption: low risk of dependency, 0–4 points; increasing risk of dependency, 5–7 points; higher risk of dependency, 8–10 points; possible dependence, 11–12 pointsPsoriasis severity was evaluated using the self-assessed Simplified Psoriasis Index; mild psoriasis, 0.00–9.99 points; moderate psoriasis, 10.00–19.99 points; severe psoriasis, > 20.00 points
Comparisons of macronutrient intakes with dietary reference values and with the UK population per the NDNS
As shown in Table 2, median intakes (% energy) for total fat, SFA, and total, cis and trans-MUFAs were similar in both the APPLE study and UK populations. Approximately two-thirds of the APPLE study population (70%) and the general UK population (64%) exceed the upper recommended intake for SFA (% energy). Intakes of fatty acid subtypes generally aligned with DRVs in both populations, including trans-MUFAs (100% below the upper recommended intake as % energy in both populations), total n-3 PUFAs (96% vs 100% met the DRV), and total n-6 PUFAs (99% vs 100% met the DRV). Most of the APPLE study population (78%) and a greater proportion of the UK population (93%) do not meet the DRV for daily fibre intake, with median intakes across both population groups approximating 19–20 g/day. Median percentage energy intakes of free sugars are twice the UK recommendations (≤ 5% energy), with the APPLE study population reporting 11% of total energy and 10% reported for the UK population. Only 12% and 15% of the APPLE study population and the UK population, respectively, were within the UK upper recommended limit for free sugar intakes. Supplementary Table 5 compares food group intakes between the NDNS and the APPLE study populations.Table 2. Median macronutrient intakes of study participants and proportions of participants that met Dietary Reference Values, with comparison to a nationally representative population of adults aged 19–64 years from the National Diet and Nutrition Survey, Years 9–11MacronutrientDRV^^APPLE (n = 257)^†^ NDNS (n = 1392)DRV metn (%)DRV not metn (%)Median(2.5th, 97.5th percentile)DRV metn (%)DRV not metn (%)Median(2.5th, 97.5th percentile)Energy, kcal/day–––1666.2(743.8, 3035.7)––1764.0(876.6, 3061.5)Protein, % energy–––15.8(10.2, 24.9)––16.3(10.6, 26.7)Total fat, % energy ≤ 35%136 (52.9)121 (47.1)34.5(22.1, 51.2)776 (55.7)616 (44.3)34.1(20.3, 46.6)Saturated fat, % energy ≤ 10%77 (30.0)180 (70.0)11.8(6.0, 20.3)500 (35.9)892 (64.1)12.6(6.0, 19.9)Total MUFAs, % energy ≥ 13%160 (62.3)97 (37.7)13.9(8.5, 21.6)598 (42.9)794 (57.1)^‡^12.6(7.2, 18.4)trans-MUFAs, % energy ≤ 2%257 (100.0)0 (0.0)0.41(0.13, 1.06)1392 (100.0)0 (0.0)0.45(0.12, 0.96)Total n-3 PUFAs, % energy ≥ 0.2%244 (96.1)13 (3.9)0.50(0.17, 1.40)1392 (100.0)0 (0.0)^§^0.94(0.43, 2.34)Total n-6 PUFAs, % energy ≥ 1%254 (98.8)3 (1.2)2.64(1.11, 8.97)1392 (100.0)0 (0.0)^‖^4.74(2.47, 8.91)Fibre, g ≥ 3056 (21.8)201 (78.2)^¶^20.2(5.9, 44.0)102 (7.3)1290 (92.7)^¶^18.5(7.3, 39.8)Total carbohydrate, % energy–––49.0(29.9, 68.8)––48.4(31.4, 64.6)Free sugars, % energy ≤ 5%30 (11.7)227 (88.3)11.2(2.6, 37.6)214 (15.4)1178 (84.6)9.7(2.2, 24.6)Median (2.5th and 97.5th percentiles) expressed as a % of total energyDRV = Dietary Reference Value; APPLE = Asking People with Psoriasis about Lifestyle and Eating; NDNS = National Diet and Nutrition Survey; MUFAs = Monounsaturated Fatty Acids; PUFAs = Polyunsaturated Fatty Acids^^ Intakes estimated using a FFQ; † Intakes estimated using 4-day food diaries; ‡ cis-MUFAs; § *cis n-*3 PUFAs; ‖ cis n-6 PUFAs; ¶ Fibre reported as Association of Official Analytical Chemists (AOAC) fibre
Macronutrient intakes by psoriasis severity
The mean (SD) macronutrient intakes (as % energy) by tertiles of psoriasis severity with Pearson’s correlation coefficients are tabulated in Table 3. Free sugars were positively correlated with psoriasis severity (r = 0.161, P = 0.010). Fibre (r = − 0.183, P = 0.003), n-6 PUFAs (r = − 0.152, P = 0.015), and total PUFAs (r = − 0.132, P = 0.036) were negatively correlated with psoriasis severity. There were no further correlations with the other macronutrients assessed.Table 3. Mean (SD) macronutrient intakes (as % energy) and Pearson's correlation coefficients with psoriasis severity (self-assessed Simplified Psoriasis Index)Macronutrient (% energy)Psoriasis severityCorrelationsT_1_6.3 (4.8)T_2_16.7 (2.4)T_3_27.2 (5.0)Allr**PProtein15.8 (3.3)16.4 (3.6)16.6 (4.4)16.0 (3.5)0.1130.071Total carbohydrate49.7 (10.0)49.2 (8.6)49.1 (10.5)50.3 (9.0)-0.0480.443Total sugars23.5 (8.1)23.8 (7.8)23.7 (8.6)24.0 (8.3)0.0150.812Free sugars11.5 (8.6)13.9 (8.0)14.2 (8.5)13.9 (8.3)0.1610.010Total fat35.0 (7.5)35.5 (6.5)34.5 (7.7)34.5 (6.9)0.0080.894Saturated fatty acids11.7 (3.4)12.0 (3.5)12.1 (3.4)12.0 (3.5)0.0920.144Total MUFAs14.1 (3.4)14.5 (2.8)13.7 (3.4)13.9 (3.1)0.0080.895cis- MUFAs13.6 (3.4)14.0 (2.8)13.2 (3.3)13.4 (3.0)0.0060.925trans-MUFAs0.4 (0.2)0.4 (0.2)0.5 (0.2)0.4 (0.2)0.1550.013Total PUFAs6.2 (2.1)6.0 (2.1)5.6 (2.1)5.8 (2.0)− 0.1320.036n-6 PUFAs3.4 (1.8)3.3 (1.7)2.8 (1.7)3.0 (1.7)− 0.1520.015n-3 PUFAs0.6 (0.2)0.6 (0.3)0.6 (0.2)0.6 (0.2)0.0400.547Fibre^*^23.6 (10.5)22.9 (10.6)20.3 (10.4)23.0 (10.5)− 0.1830.003The mean (standard deviation) of the macronutrients is expressed as a % of the energy intake (transformed using the Inverse Distribution Function) by tertiles of psoriasis severity. *P < 0.05 was considered statistically significant.Psoriasis severity was determined using the self-assessed Simplified Psoriasis IndexMUFAs = Monounsaturated Fatty Acids; PUFAs = Polyunsaturated Fatty Acids; n = omega^^Association of Official Analytical Chemists (AOAC) fibre reported in g/day
Food group sources of macronutrients by psoriasis severity
Supplementary Table 6 presents the mean (SD) contribution of macronutrients from food groups as a percentage of the total intake for a given macronutrient, with Pearson correlation coefficients for the relationship between percentage macronutrient intake (from food groups) and psoriasis severity. Positive correlations with psoriasis severity emerged for % protein from total, processed, red, and poultry meats, % n-6 PUFAs from processed meat and poultry, % fibre from potato products and non-wholegrain cereals, and % free sugars from beverages (r between 0.122 and 0.228, P < 0.05). Negative correlations were revealed for % protein from plant-based sources and nuts, % fibre from legumes and nuts, % n-6 PUFAs from nuts, and % free sugars from desserts and puddings (r between − 0.222 and − 0.123, P < 0.05).
Table 4 reports the OR (95% CIs) of reporting a high psoriasis severity (T_3_ of sa-SPI score) across quartiles of % macronutrient intakes from food groups adjusted for covariate models III and IV. Unadjusted and adjusted OR (95% CIs) for models I-II are tabulated in Supplementary Table 7. Supplementary Table 8 shows the unadjusted and adjusted OR (95% CIs) of reporting an increasing psoriasis severity (T_2_ of sa-SPI score) across quartiles of % macronutrient intakes from food groups for unadjusted and adjusted models (I-IV).Table 4. Adjusted Odds Ratios (95% Confidence Intervals) of reporting high severity (T_3_, n = 88) compared to low psoriasis (T_1_, n = 83) severity by quartiles (Q_1_-Q_4_) of protein, fibre, and free sugar intakes from food groups (models III-IV)Mean (SD) and upper and lower limits of the percentage weight of macronutrient intakes derived from food groups (quartiles)Q_1_Q_2_Q_3_Q_4_P trend% protein from total meat4 (9)0–1521 (4)15–2733 (4)27–3950 (9)39–76 Number with high psoriasis severity out of the total number per quartile of intake18/6414/6328/6428/64 Model IIIRef0.89(0.361 – 2.196)3.20(1.310 – 7.803)2.94(1.216 – 7.116)0.002 Model IVRef0.75(0.298 – 1.888)2.47(0.984 – 6.196)2.01(0.785 – 5.136)0.028% protein from red meat0 (3)0–36 (2)3–1013 (2)10–1622 (5)16–37 Number with high psoriasis severity out of the total number per quartile of intake20/6514/6326/6328/64 Model IIIRef0.65(0.266 – 1.574)2.11(0.871 – 5.088)2.56(1.051 – 6.234)0.006 Model IVRef0.55(0.223 – 1.374)1.56(0.623 – 3.909)1.81(0.711 – 4.625)0.069% protein from PBS0 (2)0–25 (2)2–811 (2)8–1520 (4)15–34 Number with high psoriasis severity out of the total number per quartile of intake29/6422/6419/6317/64 Model IIIRef0.45(0.176 – 1.163)0.32(0.129 – 0.813)0.29(0.112 – 0.727)0.007 Model IVRef0.47(0.181 – 1.245)0.36(0.140 – 0.915)0.39(0.147 – 1.026)0.050% protein from nuts0 (1)0–13 (1)1–46 (1)4–811 (3)8–19 Number with high psoriasis severity out of the total number per quartile of intake28/6323/6425/6412/64 Model IIIRef0.51(0.207 – 1.250)0.84(0.332 – 2.097)0.18(0.072 – 0.478)0.002 Model IVRef0.51(0.205 – 1.287)0.98(0.380 – 2.505)0.24(0.092 – 0.651)0.019% fibre from potatoes0 (4)0–58 (2)5–1013 (2)10–1621 (4)16–33 Number with high psoriasis severity out of the total number per quartile of intake14/6422/6430/6422/63 Model IIIRef1.20(0.495 – 2.926)3.13(1.243 – 7.902)1.91(0.742 – 4.916)0.058* Model IVRef1.12(0.455 – 2.769)2.53(0.979 – 6.524)1.43(0.535 – 3.803)0.257% fibre from NWG cereals1 (3)0–47 (1)4–911 (1)9–1317 (3)13–26 Number with high psoriasis severity out of the total number per quartile of intake17/6424/6221/6526/64 Model IIIRef1.52(0.642 – 3.616)2.29(0.908 – 5.751)2.83(1.089 – 7.333)0.021 Model IVRef1.36(0.564 – 3.300)1.81(0.703 – 4.664)2.28(0.856 – 6.058)0.082% fibre from nuts0 (1)0–12 (1)1–45 (1)4–710 (2)7–16 Number with high psoriasis severity out of the total number per quartile of intake26/6223/6525/6514/63 Model IIIRef0.53(0.218 – 1.311)0.89(0.368 – 2.153)0.31(0.123 – 0.780)0.043 Model IVRef0.58(0.232 – 1.462)0.93(0.378 – 2.311)0.37(0.143 – 0.942)0.095% free sugars from beverages0 (12)0–1524 (5)15–3241 (5)32–4964 (12)49–100 Number with high psoriasis severity out of the total number per quartile of intake14/6428/6416/6430/63 Model IIIRef3.70(1.495 – 9.171)1.42(0.560 – 3.594)3.85(1.507 – 9.831)0.040 Model IVRef2.98(1.178 – 7.544)1.04(0.397 – 2.724)2.96(1.127 – 7.780)0.163PBS = Plant-based sources; NWG = non-wholegrainQ_1_ = lowest intake [referent quartile (Ref.)]. Q_4_ = highest intakePercentage macronutrient intake from food groups is expressed as the mean (SD) for each quartile of intake calculated as a proportion of the total intake for that specific macronutrient, e.g. % protein from red meat was calculated as the sum of protein from red meat sources (g/day) / total protein (g/day) × 100Multinomial logistic regression determined the Odds Ratios (95% Confidence Intervals) of reporting high psoriasis severity with P for trend to detect significant linear relationships with intakes. P < 0.05 was considered statistically significant.Confounder adjustment models:Model I = age (continuous), sex (male or female), and smoking (yes or no)Model II = Model I + Alcohol Use Disorders Identification Test Consumption score (continuous)Model III = Model II + psychological morbidity (yes or no)Model IV = Model III + Body Mass Index (continuous)^*^ % fibre from potatoes was statistically significant until adjustment for Model III, which included psychological morbidity
Protein
Compared to participants in the lowest quartile of intake (Q_1_) for % protein from red meat, those in the highest quartile (Q_4,_ mean 22% of total protein intake from red meat) were more likely to report high psoriasis severity (OR = 2.56, 95% CI 1.051 – 6.234, P for trend = 0.006), although adjustment for BMI attenuated this association. After adjusting for all potential confounders inclusive of BMI (Model IV), participants in Q_3_ for % protein from total meat (mean 33% of total protein intake from meat sources), were twice as likely to report high psoriasis severity (OR = 2.47, 95% CI 0.984 – 6.196, P for trend = 0.028), whilst those in Q_3_ for % protein from plant-based sources (mean 11% of total protein intake from plant sources) were less likely to report high psoriasis severity (OR = 0.36, 95% CI 0.140 – 0.915). Participants in the highest quartile (Q_4_) for % protein from nuts (mean 11% of total protein intake from nut sources) were associated with a lower likelihood of reporting high psoriasis severity (OR = 0.24, 95% CI 0.092 – 0.651), all P values for trend were ≤ 0.05.
Fibre
When comparing the highest (Q_4_) versus the lowest quartiles (Q_1_) of % fibre intakes, an increased likelihood of reporting a high psoriasis severity was revealed in those who obtained a greater proportion of their dietary fibre from refined cereals (mean 17% of total fibre intake from non-wholegrain cereals) (OR = 2.83, 95% CI 1.089 – 7.333, P for trend = 0.021) with adjustments for age, sex, smoking, alcohol, and psychological morbidity (Model III). Conversely, participants in the highest quartile (Q_4_) of % fibre from nuts (mean 10% of total fibre intake from nut sources) were associated with 69% reduced odds of reporting high psoriasis severity (OR = 0.31, 95% CI 0.123 – 0.780, P for trend = 0.043). Both associations were no longer significant upon adjustment for BMI.
Free sugars
Compared to those in the lowest quartile (Q_1_), participants in the highest quartile of intake (Q_4_) for % free sugars from beverages (mean 64% of total free sugar intake from beverage sources) were more likely to report a high psoriasis severity (OR = 3.85, 95% CI 1.507–9.831, P for trend = 0.040), when adjusted for age, sex, smoking, alcohol consumption, and psychological morbidity (Model III).
Omega-6
As observed with % protein intakes, the directions of associations with psoriasis severity for % intakes of n-6 PUFAs differed according to animal and plant-based sources (refer to Supplementary Tables 9–10).
When adjusting for age, sex, smoking, alcohol consumption, and psychological morbidity (Model III), participants who obtained a greater proportion of n-6 from processed meat (Q_4_, mean 10% of total n-6 intake) were three-fold more likely to report high psoriasis severity (OR = 3.01, 95% CI 1.236–7.329, P for trend = 0.004) compared to those in the lowest quartile (Q_1_). On the other hand, participants obtaining greater proportions of n-6 PUFAs from nuts (Q_4_, mean 67% of n-6 intake) were less likely to report high psoriasis severity (OR = 0.27, CI 0.104–0.677, P for trend = 0.021).
The unadjusted ORs (95% CIs) of reporting a high psoriasis severity (T_3_ of sa-SPI score) and increasing psoriasis severity (T_2_ of sa-SPI score) across quartiles of % macronutrient intakes from food groups that did not exhibit statistically significant associations are reported in Supplementary Tables 11–14.
Discussion
This study aimed to describe the macronutrient intakes of people living with psoriasis and explore associations with psoriasis severity. Overall, the intakes of the APPLE study population did not markedly differ from a nationally representative UK sample. Consumption of free sugars in this study population exceeded dietary guidelines [25] and was higher than that of the UK population (by approximately 2%). Intakes of dietary fibre aligned with the UK population intake (~ 20g/day), which is below the recommended intake (≥ 30g/day). Associations between proportions of macronutrients consumed from different food groups and psoriasis severity were dependent on the source, with plant-based sources of nutrients (protein, n-6 PUFAs, and fibre) observed to be generally associated with lower likelihoods of reporting higher psoriasis severity.
Higher proportions of free sugars from beverages (but not from breakfast cereals, desserts, or added sugars and condiments) was associated with a greater likelihood of reporting disease severity. This association disappeared after adjusting for BMI, suggesting that sugar-sweetened beverages could be a key target for dietary intervention in people who are overweight and living with psoriasis. Higher proportions of fibre from potato products and non-wholegrain cereals were associated with an increased likelihood of reporting higher psoriasis severity. This finding should be treated with caution, given the ‘potato product’ variable compounded intakes of jacket potatoes with crisps and chips, which differ in fibre content [23], whereby fibre from non-wholegrain foods is likely indicative of a poor diet, where a greater proportion of fibre is sourced from low-fibre foods. On the other hand, higher proportions of fibre from tree nut sources were associated with 69% reduced odds of reporting high psoriasis severity, another relationship appearing to be BMI-dependent.
In view of the case–control evidence presenting an elevated consumption of soft drinks and sugars [10, 31], and lower nut and total fibre intakes in psoriasis populations [11, 32], our findings reinforce the need for recommendations in this population group to address sugar excess and promote fibre intake. The consumption of dietary fibres can target appetite, which is suggested to be dysregulated in people with elevated BMIs [33], by promoting the secretion of satiety hormones [34]. Furthermore, the microbial fermentation of fibres sourced in nuts, fruits, and vegetables generates favourable immunomodulatory metabolites, e.g. short-chain fatty acids, polyamines, and tryptophan [35–37] whose role in psoriasis-related pathways has not been elucidated. Case–control evidence, however, has suggested a reduced abundance of Bacteroidetes, a fibre-degrading phylum [38], in people with psoriasis [39–42], where a diet low in fibre may hinder Bacteroidetes growth [43–45], with the host therefore failing to benefit from its metabolites [46].
Gut microbial metabolism of animal-sourced foods may also be a mediating factor accounting for the associations observed between greater proportions of protein and n-6 PUFAs derived from red and total meat and high psoriasis severity. Branched-chain amino acids (BCAAs) and Trimethylamine N-oxide (TMAO) are gut metabolites linked to systemic diseases such as T2D [47] and CVD [48] as well as inflammation [49], potentially explaining the opposing direction of associations between meat- or plant-derived protein, and n-6 PUFA intakes, with psoriasis severity. Males with psoriasis reportedly consume more red meat compared to healthy controls, according to results of an Italian case–control analysis [11], and red meat consumption has been linked to psoriasis severity in a mixed-sex Thai population (n = 100) [31]. Although both case–control analyses adopted the Psoriasis Area Severity Index as the disease severity measure, which, compared to the self-reported sa-SPI adopted in this study, is more objective as it is conducted by a clinician [50], the small sample sizes preclude the broader representation of these findings across psoriasis populations.
Studies have reported elevated concentrations of microbial metabolites such as serum TMAO [51–53] and serum BCAAs [54], as well as advanced glycation end products (AGEs) in the skin of people with severe psoriasis [55]. This evidence, however, is observational and lacks dietary assessment, making it challenging to establish causal links between higher consumption of animal-derived foods, greater TMAO, BCAA, and AGE concentrations, and greater psoriasis severity. Research has generally been gravitating towards the gut microbiome as a mediating factor for psoriasis onset and severity [56, 57]. Considering the lower microbial diversity and dysbiosis, characterised by higher Firmicutes and lower Bacteroidetes abundances, in people living with psoriasis, as systematically reviewed by Gao et al*.* [58], future psoriasis research must consider potential gut-skin axis interactions and their modulation by diet [59, 60].
Strengths and limitations
To our knowledge, this is the first cross-sectional study profiling the macronutrient and food group intakes of a study population with psoriasis in the UK using a validated questionnaire measure for psoriasis severity. Limitations include incomplete survey responses, reducing the overall sample size available for analysis and the nature of participant convenience sampling, meaning that the findings may not be representative of the wider psoriasis population. Diet and psoriasis severity were self-reported, subject to recall, intake, and person-specific bias [61, 62]. Dietary intakes of the APPLE study population were based on FFQ data capturing semi-quantitative intakes across a multitude of food groups over a previous 12-month period. On the other hand, the NDNS intakes in Y9-11 are derived from 4-day food diaries, reflecting short-term day-to-day quantitative intakes of specific foods and meals, but potentially missing intakes of less frequently consumed foods [63]. Although the models accounted for BMI, adjustment for comorbidities was limited to psychological morbidity (self-reported depression and/or anxiety). Future cross-sectional studies should consider examining the relationship between diet and psoriasis severity in population subsets with cardiometabolic disease, as such comorbidities may influence psoriasis severity and dietary choices [64]. Additionally, insufficient data quality for exercise levels precluded adjustment for physical activity as a covariate. With a cross-sectional study design, cause-and-effect relationships cannot be established. Longitudinal studies may provide better insight into whether diet influences the disease course of psoriasis over time, while intervention trials incorporating dietary assessment and quantitative nutritional biomarker analyses are required to investigate causal relationships.
Conclusion
These observations generate a plausible hypothesis that deriving a greater proportion of nutrients from plant sources may play a role in the management of psoriasis symptoms. The potential benefits of plant-based diets for people living with psoriasis remain an open question for future randomised controlled trials. Proportions of macronutrients from food sources may act as surrogate markers of other components in these foods that may be mechanistically implicated in the amelioration or worsening of psoriasis symptoms.
Supplementary Information
Below is the link to the electronic supplementary material.
Supplementary Material 1
Supplementary Material 2
Supplementary Material 3
The reference list from the paper itself. Each links out to its DOI / PubMed record.
- 1National Institute for Health and Care Excellence [NICE] (2023) Cardiovascular disease: risk assessment and reduction, including lipid modification [NG 238] [Internet]. 2023 [cited 2024 Jun 18]. Available from: https://www.nice.org.uk/guidance/ng 238/resources/cardiovascular-disease-risk-assessment-and-reduction-including-lipid-modification-pdf-66143902851781
- 2National Institute for Health and Care Excellence [NICE] (2023) Type 2 diabetes in adults: management [NG 28] [Internet]. [cited 2024 Jun 18]. Available from: https://www.nice.org.uk/guidance/ng 28/resources/type-2-diabetes-in-adults-management-pdf-2830067254213
- 3National Institute for Health and Care Excellence [NICE] (2017) Psoriasis: assessment and management [Internet]. [cited 2024 Jan 5]. Available from: https://www.nice.org.uk/guidance/cg 153/resources/psoriasis-assessment-and-management-pdf-35109629621701
- 4Zanesco S (2024) The APPLE study survey. Internet. [cited 2025 May 28] pp. 1–61. Available from: https://osf.io/c 59n 4
- 5Zanesco S (2025) The APPLE study flyer. Internet. 2025 [cited 2025 May 28]. Available from: https://osf.io/pgc 84
- 6Zanesco S (2025) The APPLE study EPIC FFQ. Internet. pp 1–8 [cited 2025 Jun 1]. Available from: https://osf.io/ptcuw/files/osfstorage/67dec 4451188 f 123255226 ad
- 7Public Health England (2021) Mc Cance and Widdowson’s The Composition of Foods Integrated Dataset 2021 [Internet]. [Cited 2024 Jan 5]. Available from: https://www.gov.uk/government/publications/composition-of-foods-integrated-dataset-cofid
- 8U.S. Department of Agriculture ARSBHNR Center (2025) Internet. [cited 2025 Jun 1]. Food Data Central. Available from: https://fdc.nal.usda.gov/