Anthropometry and diagnostic aware deep learning for exercise assessment
Karla Miriam Reyes Leiva, Pavla Nikelova, Martin Cerny

TL;DR
This paper introduces ADA, a deep learning framework that uses sensor data and personal features to assess exercise technique and predict injury risk.
Contribution
ADA combines IMU kinematics with anthropometric and diagnostic data using attention-based fusion for improved movement assessment.
Findings
ADA achieved 94.8% sequence-level accuracy in movement quality classification.
Binary risk prediction reached 97.8% accuracy with diagnostic context.
Personalized fine-tuning improved accuracy by 3%–5% depending on window length.
Abstract
Correct technique during strength exercises such as squats and Romanian deadlifts (RDLs) is fundamental for performance and injury prevention. We introduce ADA (Anthropometry and Diagnostic Aware), a multimodal deep-learning framework that integrates IMU kinematics with anthropometric and diagnostic features to classify movement quality and predict movement related risk. Seventeen-sensor IMU data were collected from 15 healthy subjects performing correct and incorrect squat and RDL trials. A CNN-LSTM branch processed kinematic sequences and a fully connected branch processed static anthropometric/diagnostic inputs; feature fusion used attention weighting. Incorporating anthropometry and diagnostic context increased sequence-level accuracy from 86.5% (kinematics only) to 94.8% (ADA) and enabled binary risk prediction at 97.8%. Personalized (transfer learning) fine tuning further…
Genes, proteins, chemicals, diseases, species, mutations and cell lines named across the full text — each resolved to its canonical identifier and authoritative record.
Click any figure to enlarge with its caption.
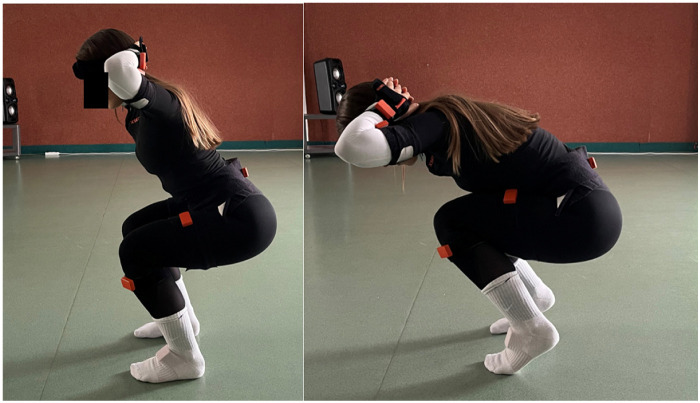 Figure 1
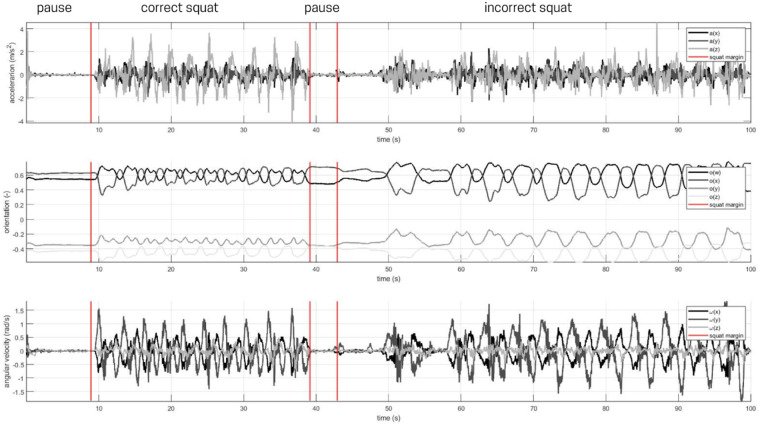 Figure 2
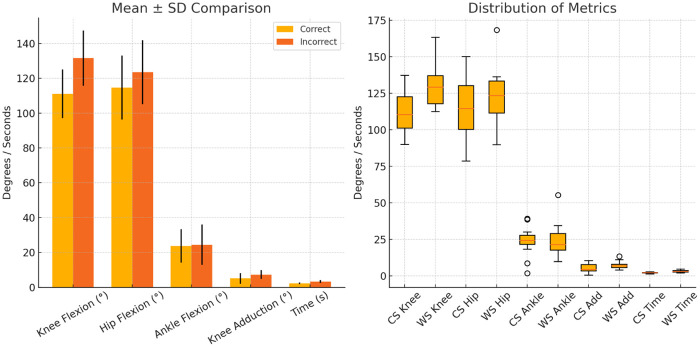 Figure 3
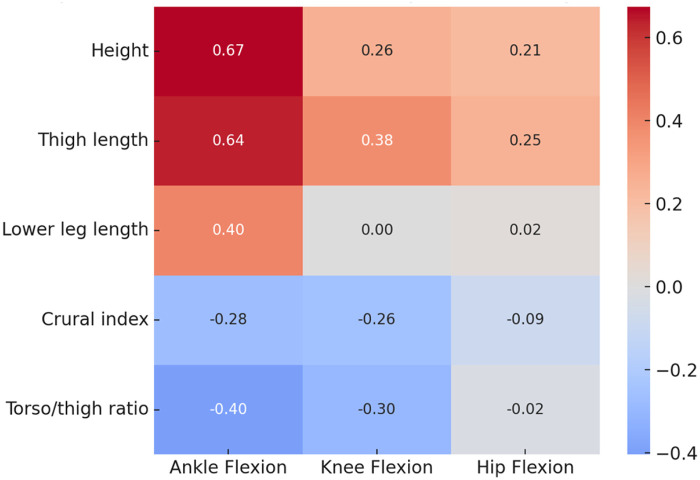 Figure 4
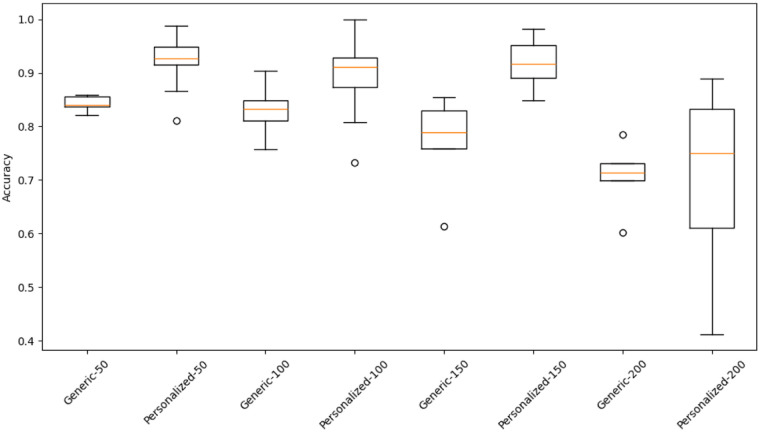 Figure 5
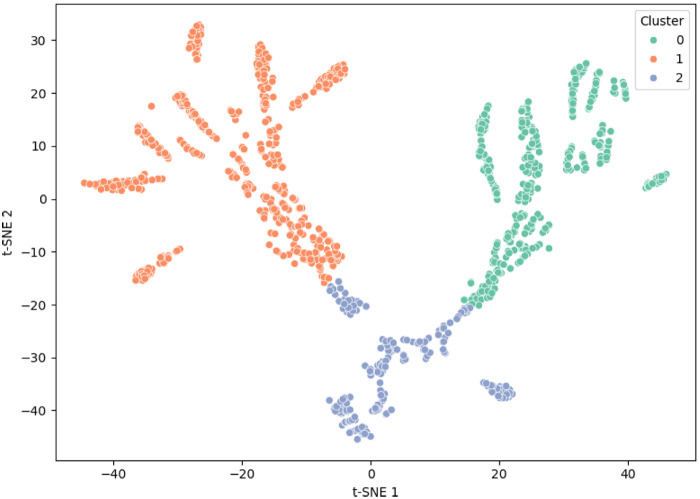 Figure 6
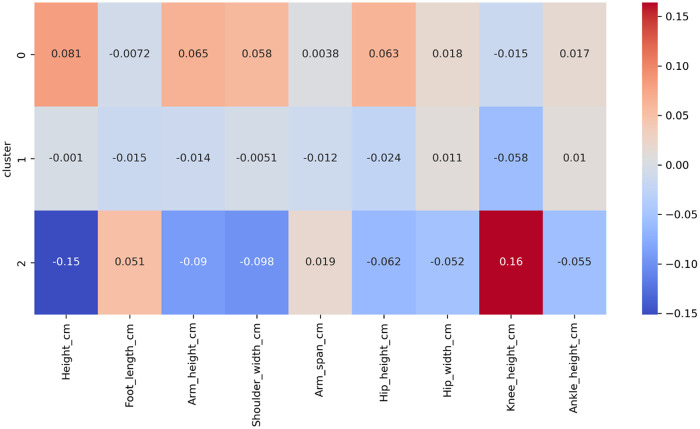 Figure 7
| Parameter | Mean | Range |
|---|---|---|
| Height (cm) | 168.9 | 153–180 |
| Foot length (cm) | 23.3 | 21–26 |
| Arm height (cm) | 137.1 | 124–147 |
| Shoulder width (cm) | 37.5 | 30–42 |
| Arm span (cm) | 170.1 | 150–181 |
| Hip height (cm) | 95.3 | 88–103 |
| Hip width (cm) | 33.5 | 27–40 |
| Knee height (cm) | 46.2 | 43–50 |
| Ankle height (cm) | 6.1 | 5–9 |
| Body parameter | Ankle flexion | Knee flexion | Hip flexion |
|---|---|---|---|
| Height | 0.674 (0.006) | 0.255 (0.360) | 0.212 (0.449) |
| Thigh length | 0.637 (0.010) | 0.376 (0.168) | 0.250 (0.369) |
| Lower leg length | 0.404 (0.134) | 0.004 (0.990) | 0.020 (0.943) |
| Crural index | |||
| Torso/thigh ratio |
| Model | Accuracy (%) | Precision | Recall | F1-score | AUC |
|---|---|---|---|---|---|
| Baseline (kinematics-only) | 86.5 | 0.864 | 0.867 | 0.865 | 0.92 |
| ADA (multimodal) | 94.8 | 0.945 | 0.953 | 0.949 | 0.98 |
| MAX_T | Generic mean | Generic SD | Personalized mean | Personalized SD |
|---|---|---|---|---|
| 50 | 0.8426 | 0.0138 | 0.9212 | 0.0443 |
| 100 | 0.8304 | 0.0477 | 0.8948 | 0.0655 |
| 150 | 0.7688 | 0.0847 | 0.9157 | 0.0398 |
| 200 | 0.7060 | 0.0596 | 0.7214 | 0.1395 |
| MAX_T | Mean diff (%) | t(4) | Cohen’s | |
|---|---|---|---|---|
| 50 |
| 4.90 | 0.007 | 1.10 |
| 100 |
| 5.33 | 0.005 | 1.20 |
| 150 |
| 7.74 | 0.001 | 1.73 |
| 200 |
| 3.87 | 0.017 | 0.86 |
| Metric | High risk | Low risk |
|---|---|---|
| Support ( | 432 | 1,068 |
| Precision | 0.942 | 0.976 |
| Recall (Sensitivity) | 0.984 | 0.976 |
| F1-score | 0.962 | 0.976 |
| Overall Accuracy = 97.8%, AUC = 0.99 | ||
Peer Reviews
No public reviews on file for this paper yet. If you reviewed it on a platform where reviews are public (OpenReview, ICLR, NeurIPS, ICML), you can paste yours below so the community can read it here.
Videos
No videos yet. Explain this paper in a talk, walkthrough, or lecture? Add one.
Taxonomy
TopicsBalance, Gait, and Falls Prevention · Context-Aware Activity Recognition Systems · Human Pose and Action Recognition
Introduction
1
The squat is a fundamental movement pattern and a cornerstone of strength and conditioning programs, widely used to improve the strength of the lower extremities, trunk stability, and overall functional capacity (1). As a compound, multi-joint exercise involving the hips, knees, and ankles, its execution directly influences biomechanical loading, muscle activation, and injury risk (2). Squats are incorporated across various disciplines, including powerlifting, CrossFit, and rehabilitation protocols, where correct technique is essential for performance optimization and injury prevention (3). Despite its apparent simplicity, the squat requires coordinated activation of multiple muscle groups, with variations in depth, stance, and load placement leading to distinct kinematic and kinetic profiles (4).
To analyze these complex movement patterns, Motion Capture (MoCap) technologies have long been considered the gold standard for quantifying joint kinematics with high spatial and temporal precision (5, 6). Both marker-based optical systems and IMU-based wearable sensors have been employed to measure joint angles, segment trajectories, and compensatory strategies during squatting (7). Squat execution is further influenced by anthropometry, training experience, and external constraints (8, 9), underlining the importance of subject-specific biomechanical context in performance evaluation.
In recent years, Human Activity Recognition (HAR) frameworks have increasingly integrated machine learning and deep learning techniques with MoCap and IMU data to automatically assess movement quality and detect deviations from ideal technique (10, 11, 24). Hybrid architectures such as Convolutional Neural Networks combined with Long Short-Term Memory (CNN–LSTM) networks have demonstrated superior performance in recognizing dynamic exercise patterns (12). Further optimizations in windowing (12), computational complexity, and reduced-sensor configurations (11) have demonstrated the feasibility of scalable, real-time feedback systems for both training and rehabilitation. Nevertheless, most studies address either biomechanical analysis or automated classification in isolation, rarely combining detailed kinematic evaluation with deep learning-based movement assessment. Moreover, the influence of individual anthropometric characteristics on exercise classification remains largely unexplored, despite evidence that body proportions significantly affect squat mechanics (13).
The state of the art in squat biomechanics research is thus characterized by two main directions: high-resolution kinematic/kinetic characterization and AI-driven movement classification. Recent studies have clarified how technique parameters such as stance width influence joint loading and muscular force generation. For example, McMahon et al. found that narrower stances enhance quadriceps force and peak power, whereas wider stances increase posterior-chain activation and medial ground reaction forces (14). Similarly, Larsen, de Zee, and van den Tillaar reported that wider stances in heavy back squats reduce knee flexion angles and extension moments while increasing hip abduction, highlighting important biomechanical trade-offs (15).
Complementing these biomechanical insights, AI approaches leveraging IMU data have achieved significant progress. Zhang et al. (16) proposed a hybrid CNN–GRU model trained on wearable sensor data from squats, lunges, and jumps, achieving robust classification accuracy across sampling rates. Likewise, (17) introduced a deep learning framework for estimating lower-limb joint kinematics from IMUs, incorporating transfer learning to adapt models to new subjects with minimal data, and identifying femur and calcaneus sensors as optimal placements for accurate predictions (18, 19). These advances illustrate the growing potential of AI-based motion analysis, yet few frameworks integrate user-specific biomechanical or diagnostic factors.
Despite this progress, most existing AI systems treat subjects as biomechanically homogeneous and overlook inter-individual variations in body structure, flexibility, or clinical conditions. This omission limits their applicability in real-world, field-deployable contexts where personalization is critical for valid exercise assessment and injury risk evaluation. As wearable-based movement monitoring expands toward personalized training and rehabilitation, incorporating subject-specific context has become increasingly essential.
The proposed ADA (Anthropometry and Diagnostic Aware) framework directly addresses these gaps by fusing individualized anthropometric dimensions and diagnostic features with IMU-derived kinematic sequences. ADA employs a multimodal deep learning network that combines temporal motion features with static subject characteristics through attention based feature fusion, enhancing both the accuracy and interpretability of personalized AI driven movement classification.
Specifically, this study aims to:
- Quantify kinematic differences between correctly and incorrectly executed squats and Romanian deadlifts (RDLs) using wearable MoCap systems.
- Examine the influence of anthropometric characteristics on squat execution parameters and their detectability by machine learning models.
- Develop an anthropometry and diagnostic aware AI model to classify squat and RDL movement quality (correct vs. incorrect) and highlight biomechanical and subject specific factors influencing performance. By integrating wearable sensors, biomechanics, and deep learning within a subject specific modeling paradigm, ADA provides a scalable approach for personalized exercise assessment and rehabilitation, bridging the gap between laboratory grade biomechanical precision and real world applicability.
Materials and methods
2
The study quantified kinematic differences between correctly and incorrectly executed squats and RDLs using a wearable inertial motion-capture system (Xsens MVN 2019.2). The primary objectives were to (i) identify kinematic deviations between correct and incorrect technique and (ii) evaluate how subject specific anthropometric and diagnostic features improve automatic movement-quality classification and risk prediction. Ethical approval was obtained from the Ethics Committee of the Faculty of Electrical Engineering and Computer Science, VSB TUO.
Subjects
2.1
Fifteen healthy adult subjects (8 males, 7 females; age 19–35 years) were recruited. Inclusion criteria were absence of acute musculoskeletal injury and ability to perform deep squats. Each subject performed 40 repetitions in total: 10 correct squats, 10 incorrect squats, 10 correct RDLs and 10 incorrect RDLs. Anthropometric summary statistics are given in Table 1 ( ). All subjects provided written informed consent prior to participation.
Instrumentation and setup
2.2
Full body kinematics were recorded with the Xsens MVN Link system using 17 IMUs placed according to the manufacturer’s protocol. Data were sampled at 60 Hz and streamed to the acquisition PC via the access point and MVN software. System calibration followed the vendor’s procedure prior to each session.
Experimental protocol
2.3
Sessions began with a 5 min dynamic warm up. Under the supervision of a certified fitness trainer, each subject performed: 10 correct deep squats (knee flexion > 90 ), 10 intentionally incorrect squats (e.g., heels lifted, excessive knee adduction, trunk flexion), 10 correct RDLs and 10 incorrect RDLs (e.g., knee hyperextension, excessive trunk flexion). Squats were executed with hands behind the head and RDLs with hands alongside the thighs. Total session duration per subject did not exceed one hour. Example correct/incorrect squat kinematics are illustrated in Figure 1.
Comparison of correct vs. incorrect squat technique (side view).
Data processing and segmentation
2.4
Raw MVN outputs (quaternions, linear accelerations, angular velocities) were exported and processed in MATLAB. Joint angles (hip, knee, ankle flexion; knee adduction) were computed via quaternion to Euler conversions. Repetition segmentation combined the IMU derived kinematic signals with synchronized video to obtain reliable start/end markers; manual annotation was used to assign frame level labels (correct, incorrect, pause) see Figure 2 for annotated joint angle data. From each repetition we extracted overlapping sequences of 50–200 frames (windowing parameters described in Supplementary Material), resulting in approximately 1,500 labelled sequences in the dataset. Sequence-level labels were used for model training and evaluation; however, inferential statistical tests (t-tests, correlations) were performed on subject level summary measures (e.g., mean peak angle per subject) to avoid pseudoreplication.
Example of annotated knee flexion signal showing correct (1), pause (0), and incorrect (2) phases.
Statistical analysis
2.5
Descriptive statistics (mean, SD) were computed for kinematic features and repetition durations. Normality was assessed with the Shapiro-Wilk test. Paired samples t-tests (or Wilcoxon signed rank tests when normality assumptions were violated) compared correct vs. incorrect executions within subjects; these tests used subject level summary statistics. Spearman rank correlations assessed relationships between anthropometric measures and joint ranges; primary correlations are reported with p-values and 95% bootstrap confidence intervals (1,000 resamples). Effect sizes for group comparisons are reported as Cohen’s (paired) with 95% CIs where applicable. All inferential tests are presented as exploratory (no correction for multiple comparisons); this is noted in the Limitations.
Anthropometry aware model architecture and training
2.6
To account for inter subject variability, we combined sequence level kinematic inputs with standardized anthropometric features (z-scored). The multimodal network comprised: (i) a 1D convolutional front end followed by stacked LSTM layers to learn temporal kinematic representations, and (ii) a fully connected branch processing static anthropometric and diagnostic inputs. Feature-level attention fused the two branches before final classification. The network produced two outputs: movement-quality classification (binary: correct vs. incorrect) and a binary risk prediction.
Training used a two stage strategy: population level pretraining (generic model) followed by subject specific fine tuning (personalized model, transfer learning). Typical training hyperparameters were: Adam optimizer, initial learning rate , batch size 32, early stopping with patience = 10 epochs, and dropout regularization. Generic models were evaluated with 5-fold subject wise cross validation; personalized models were evaluated with a 3-fold subject wise cross validation (folds defined at subject level so no sequences from the same subject appear in both train and test sets).
Diagnostic label construction and clustering
2.7
Diagnostic variables (e.g., ankle dorsiflexion, hip mobility tests, prior musculoskeletal findings) were encoded and merged with anthropometrics. The binary risk label was defined as “high” if a subject presented 1 of: (i) documented prior lower limb surgery (e.g., ACL reconstruction), (ii) clinically reduced hip mobility (hip flexion < or hip internal rotation < ), or (iii) ankle dorsiflexion < (weight-bearing lunge test); otherwise the label was “low.” In this dataset 4 subjects met at least one risk criterion (high risk) and 11 subjects were low risk; after segmentation this corresponded to high = 432 and low = 1068 sequences.
Latent features from the penultimate layer were standardized (z-score) prior to unsupervised analysis. t-SNE was used for 2D visualization and k-means ( ) for exploratory grouping. Cluster validity was quantified with the silhouette coefficient (mean silhouette 0.46), indicating moderate separation between clusters.
Performance evaluation
2.8
Model performance was assessed at sequence level. For each fold we computed accuracy, precision, recall, F1-score and area under the ROC curve (AUC). Reported metric values are the mean SD across cross-validation folds. AUCs were computed from predicted probabilities for the positive class and averaged across folds. Confusion matrices reported in Results are aggregated across folds (sum of fold level matrices). To compare generic and personalized model accuracies we used paired samples t-tests on fold wise accuracies (or Wilcoxon signed rank tests when normality was violated). Per fold accuracy vectors and analysis scripts are provided in the Supplementary Material to allow reproducibility.
All analyses were performed in MATLAB and R (RStudio); machine learning models were implemented in Python (TensorFlow/Keras). Significance was assessed at unless otherwise stated, and all statistical analyses are reported as exploratory.
Results
3
Anthropometric and kinematic findings
3.1
Subjects had a mean height of 168.9 7.6 cm, with segment lengths consistent with expected adult proportions. Clear kinematic differences were observed between correct and incorrect squat executions (Figure 3). Incorrect squats showed greater knee flexion (131.5 vs. 111.1 ) and hip flexion (123.5 vs. 114.6 ), as well as increased knee adduction (7.3 vs. 5.1 ). All joint angle values reported correspond to peak flexion extracted from each repetition and averaged at the subject level. Execution time was also longer in incorrect squats (mean difference = 1.0 s; 95% CI: [0.6, 1.4], ) as shown in Figure 3. All comparisons were conducted on subject-level summaries using paired analyses.
Group-level summary of correct vs. incorrect squat kinematics. Error bars represent ±1 SD.
Shapiro–Wilk tests indicated no evidence of non-normality for these group-level summary measures ( ), including ankle flexion in incorrect squats ( ). Spearman correlations revealed that height ( , ) and thigh length ( , ) were positively associated with maximal ankle dorsiflexion, whereas correlations with maximal knee and hip flexion were not statistically significant (Table 2; Figure 4). These results suggest that distal joint mobility may be more influenced by anthropometric variation than proximal joint angles during squatting.
Heatmap of Spearman correlations between anthropometric parameters and joint flexion angles.
Movement quality classification
3.2
The baseline kinematics only model achieved a mean accuracy of 86.5% and an AUC of 0.92. Incorporating anthropometric and diagnostic variables substantially improved performance: the multimodal ADA model reached 94.8% accuracy, with increases across all evaluated metrics (precision = 0.945, recall = 0.953, F1 = 0.949; Table 3). Confusion matrices aggregated across folds indicated more balanced and robust classification in ADA compared with the baseline.
Accuracy across temporal input lengths (MAX_T = 50, 100, 150, 200 frames) is shown in Table 4. Personalized (subject-specific) models consistently outperformed generic models for all sequence lengths. Accuracy gains ranged from +3.3% to +4.5%, with 95% bootstrap confidence intervals indicating stable improvements across folds.
Paired comparisons of fold wise accuracies confirmed statistically significant advantages for personalized over generic models (Table 5). Effect sizes were large (paired Cohen’s = 0.86–1.73), indicating that personalization contributed meaningfully to inter-subject variability reduction regardless of input-window length. Figure 5 illustrates these improvements and their reduced variance.
Fold-wise accuracy distributions for generic and personalized models across temporal input lengths.
Diagnostic aware risk prediction
3.3
The ADA risk prediction branch achieved an accuracy of 97.8% across 1,500 sequences low = 1068, high = 432. High risk classification showed excellent sensitivity (recall = 0.984), precision (0.942) and F1-score (0.962), with an AUC of 0.99 (Table 6). These results demonstrate that static diagnostic and anthropometric information meaningfully enhances detection of movement-related risk beyond kinematic data alone.
Latent space structure and subject stratification
3.4
To characterize subject specific biomechanical patterns, latent features extracted from the penultimate layer were projected using t-SNE and clustered with k-means ( ). Anthropometric inputs were standardized prior to clustering. Silhouette analysis yielded a mean value of 0.46, indicating moderate cluster separability. The three clusters captured distinct biomechanical diagnostic profiles:
- Cluster 0 (n = 520): subjects with typical anthropometry and no diagnostic flags; dominated by low-risk, correct executions.
- Cluster 1 (n = 610): subjects exhibiting altered joint mobility (e.g., reduced hip rotation or ankle dorsiflexion) or minor musculoskeletal history; mixed-risk sequences.
- Cluster 2 (n = 370): subjects with multiple diagnostic findings and non-standard segmental proportions; enriched for high-risk and mechanically suboptimal executions. Figures 6, 7 illustrate latent-space organization and cluster-level anthropometric profiles, respectively. These clusters should be interpreted as exploratory groupings rather than diagnostic categories; however, the observed structure supports the rationale for integrating static subject-specific data into movement assessment.
t-SNE projection of latent features colored by k-means cluster membership (k=3).
Standardized anthropometric feature profiles across the three clusters.
Overall, incorrect squat technique produced substantial and consistent kinematic deviations. Anthropometric effects were most pronounced at the ankle, reflecting segment length influences on mobility. The ADA multimodal framework markedly improved movement-quality classification and enabled highly accurate risk prediction. Personalized fine-tuning provided additional gains, and exploratory clustering of latent features revealed interpretable biomechanical structure aligned with subject level characteristics. All statistical findings are reported as exploratory with effect sizes and confidence intervals to support transparent interpretation.
Discussion
4
This study evaluated whether integrating subject specific anthropometric and diagnostic information enhances IMU-based assessment of squat and RDL execution. All statistical analyses were exploratory and descriptive, with effect sizes reported alongside p-values; no corrections for multiple comparisons were applied. Findings should therefore be interpreted with caution regarding potential Type I error inflation.
Interpretation of principal findings
4.1
The results demonstrate that multimodal modeling substantially improves movement-quality classification compared with kinematics only approaches. The ADA framework outperformed the baseline model across all evaluation metrics, and personalized fine tuning yielded further gains. These findings align with recent work showing that subject aware architectures and adaptive attention mechanisms improve accuracy in human motion analysis. For example, Weng et al. (20) achieved 94.7% squat assessment accuracy using attention enhanced temporal CNNs, and Chen & Fan (21) reported notable improvements in posture recognition and physiological estimation when incorporating individualized model components. Together with the present results, this growing evidence indicates that anthropometric and diagnostic features offer meaningful subject level information not captured by kinematics alone.
The improvements observed in personalized models are consistent with broader trends in rehabilitation and sports AI research emphasizing the value of fine tuning for inter-subject variability. As highlighted by Zhang et al. (16), transfer learning facilitates generalization while maintaining interpretability, which is essential when applying AI to heterogeneous clinical or athletic populations. Our observed accuracy gains at shorter sequence lengths (e.g., 92.1% vs. 84.3% at 50-frame inputs) illustrate the practical relevance of personalization, especially when only limited subject data are available.
The clustering analysis further supports the utility of multimodal feature integration. Latent representations revealed three biomechanically interpretable profiles structured by anthropometric proportions and diagnostic findings. These exploratory clusters echo previous evidence that physiologically grounded features or synthetic augmentation improve subject stratification (22). Although not intended as diagnostic categories, the clusters contribute to the interpretability of the ADA framework by demonstrating that the network organizes subjects according to meaningful biomechanical and clinical characteristics.
Finally, our findings resonate with broader trends in wearable AI. As summarized by Dudek et al. (23), wearable sensing combined with machine learning is transforming personalized training, performance monitoring, and injury prevention, while raising challenges related to data quality, model transparency, and privacy. By incorporating attention based multimodal fusion, ADA moves toward individualized and clinically relevant assessment pipelines that extend beyond traditional kinematic only models.
Limitations and future directions
4.2
This pilot study involved fifteen healthy adult subjects, which limits generalizability to clinical populations or broader demographic groups. Larger, more heterogeneous cohorts are needed to validate the Ada framework’s robustness, particularly in individuals with musculoskeletal impairments. Additionally, all statistical analyses were exploratory and uncorrected for multiple comparisons; future work should incorporate confirmatory designs with appropriate error control.
Although the 17-IMU Xsens system yields detailed kinematic information, practical field applications may require fewer sensors. Prior work suggests that reduced-sensor configurations can maintain strong predictive performance (4). Future research should evaluate whether ADA generalizes effectively under minimal sensor sets or alternative wearable technologies.
The diagnostic aware component leverages sensitive subject data, highlighting the need for transparent governance, secure data handling, and adherence to emerging guidelines for ethical AI deployment in health contexts (25). Model interpretability tools such as saliency maps or feature attribution analyses should also be explored to strengthen clinical trust and explainability beyond the exploratory clustering presented here.
Conclusions
5
This study presented ADA, a multimodal deep learning framework that integrates wearable IMU kinematics with anthropometric and diagnostic information for subject specific assessment of squat and Romanian deadlift execution. By combining temporal feature extraction (CNN–LSTM) with attention weighted static inputs, ADA demonstrated substantially higher accuracy than kinematics only models for both movement quality classification and risk prediction.
Incorporating anthropometric measures enabled the model to account for structural variability across subjects, while diagnostic variables contributed to clinically relevant stratification. These findings indicate that subject specific information provides complementary insight beyond kinematic signals and enhances both the predictive performance and interpretability of automated biomechanical assessment.
ADA provides a scalable foundation for delivering real-time, personalized feedback in sports performance, injury prevention, and remote rehabilitation. Future work should validate the framework in larger and more heterogeneous populations, investigate reduced sensor configurations for practical field use, and develop explainable AI interfaces to support transparent clinical adoption.
The reference list from the paper itself. Each links out to its DOI / PubMed record.
- 1Schoenfeld BJ. Squatting kinematics and kinetics and their application to exercise performance. J Strength Cond Res. (2010) 24(12):3497–506. 10.1519/JSC.0b 013e 3181 bac 2d 720182386 · doi ↗ · pubmed ↗
- 2Werner D Casey L Myers E Barrios JA. Lower limb squat biomechanics and select clinical measures in chronic ankle instability. Clin Biomech. (2024) 113:106211. 10.1016/j.clinbiomech.2024.10621138430783 · doi ↗ · pubmed ↗
- 3Aravena Sagardia P Barramuño Medina M Vásquez BP Pichinao Pichinao S Sepúlveda PR Herrera Valenzuela T, et al. Effects of a crossfit training program on body composition and physical fitness in novice and advanced practitioners: an inter-individual analysis. Appl Sci. (2025) 15(7):3554. 10.3390/app 15073554 · doi ↗
- 4Larsen S de Zee M van den Tillaar R. The impact of stance width on kinematics and kinetics during maximum back squats. J Strength Cond Res. (2025) 39(1):1–9. 10.1519/JSC.000000000000494939652724 · doi ↗ · pubmed ↗
- 5Suo X Tang W Li Z. Motion capture technology in sports scenarios: a survey. Sensors. (2024) 24(9):2947. 10.3390/s 2409294738733052 PMC 11086331 · doi ↗ · pubmed ↗
- 6Das K de Paula Oliveira T Newell J. Comparison of markerless and marker-based motion capture systems using 95% functional limits of agreement in a linear mixed-effects modelling framework. Sci Rep. (2023) 13:22880. 10.1038/s 41598-023-49360-238129434 PMC 10739832 · doi ↗ · pubmed ↗
- 7Lee CJ Lee JK. Inertial motion capture-based wearable systems for estimation of joint kinetics: a systematic review. Sensors. (2022) 22(7):2507. 10.3390/s 2207250735408121 PMC 9002742 · doi ↗ · pubmed ↗
- 8Karadenizli Zİ İlbakİ JorgićBM Onu I Coman M-G Iordan D-A. The relationship between anthropometric characteristics, chronological age, and training age with speed, agility, and explosive power in handball players. Appl Sci. (2025) 15(11):6276. 10.3390/app 15116276 · doi ↗