Brain metabolic connectivity in ALS due to C9ORF72 hexanucleotide expansion: a [18F]FDG-PET study
Antonio Canosa, Stefano Callegaro, Umberto Manera, Rosario Vasta, Sara Cabras, Francesca Di Pede, Filippo De Mattei, Francesca Palumbo, Barbara Iazzolino, Anastasia Dei Giudici, Enrico Matteoni, Grazia Zocco, Emilio Minerva, Alessandra Maccabeo, Giorgio Pellegrino

TL;DR
This study uses PET scans to show distinct brain metabolism patterns in ALS patients with a specific genetic mutation compared to those without.
Contribution
The study identifies unique metabolic connectivity patterns in C9ORF72-related ALS using [18F]FDG-PET imaging.
Findings
C9-ALS patients showed hypometabolism in thalami and hypermetabolism in cerebellum and brainstem compared to ctrl-ALS.
C9-ALS exhibited broader thalamus-cingulate cortex correlations and more extensive frontal negative correlations.
The salience network is more involved in C9-ALS, suggesting a link to cognitive and behavioral control.
Abstract
Our aim was to investigate brain metabolic connectivity, as assessed via [18F]FDG-PET, in ALS patients carrying the C9ORF72 expansion (C9-ALS). We compared brain metabolism of C9-ALS and patients without mutations of the main ALS-related genes (ctrl-ALS) through the two-sample t-test model of SPM12. Metabolic clusters showing a significant difference between the two groups were used as seed regions for an interregional correlation analysis (IRCA) in each group to evaluate metabolic connectivity. As compared to ctrl-ALS, C9-ALS showed a relative hypometabolism in bilateral thalamus and left precentral and postcentral gyri, and a relative hypermetabolism in bilateral cerebellum and brainstem. In the IRCA, a positive correlation was found between the thalamic seed region and the cingulate cortex, including its anterior part. This correlation was broader in C9-ALS than in Ctrl-ALS. A…
Genes, proteins, chemicals, diseases, species, mutations and cell lines named across the full text — each resolved to its canonical identifier and authoritative record.
Click any figure to enlarge with its caption.
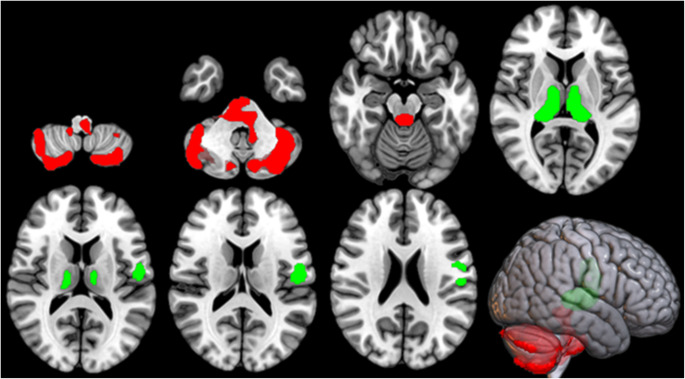 Figure 1
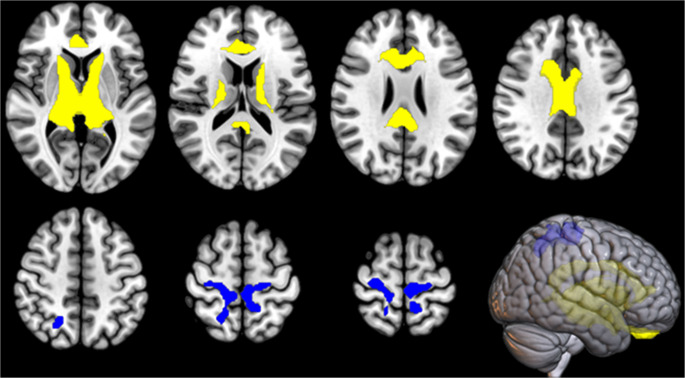 Figure 2
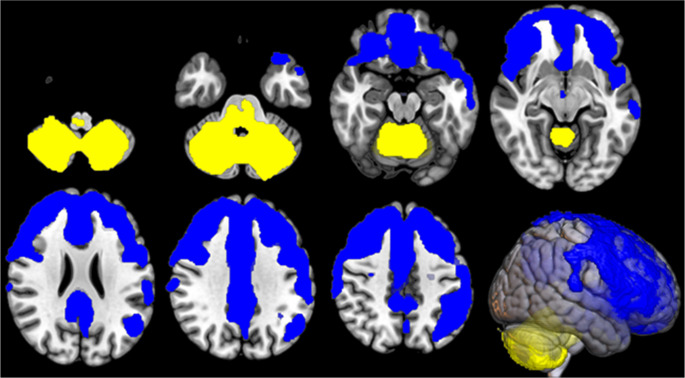 Figure 3
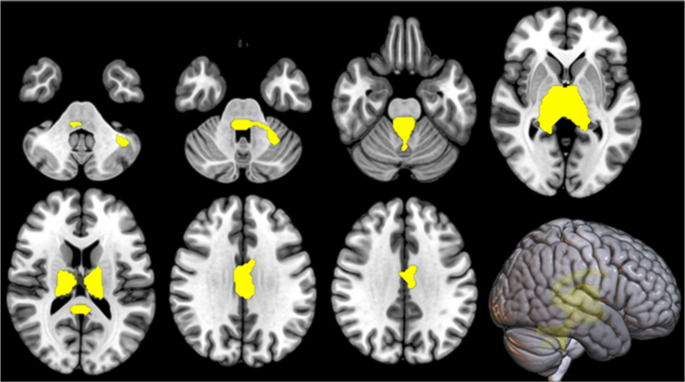 Figure 4
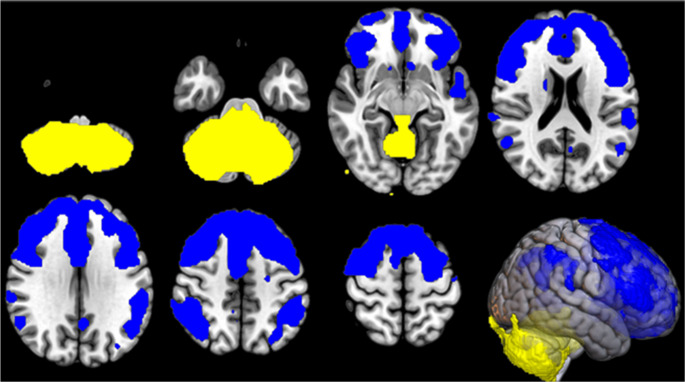 Figure 5
- —Università degli Studi di Torino
Peer Reviews
No public reviews on file for this paper yet. If you reviewed it on a platform where reviews are public (OpenReview, ICLR, NeurIPS, ICML), you can paste yours below so the community can read it here.
Videos
No videos yet. Explain this paper in a talk, walkthrough, or lecture? Add one.
Taxonomy
TopicsAmyotrophic Lateral Sclerosis Research · Genetic Neurodegenerative Diseases · Cerebrospinal fluid and hydrocephalus
Introduction
Amyotrophic lateral sclerosis (ALS) is a heterogeneous neurodegenerative disease affecting both motor and extramotor systems, with approximately 50% of patients displaying cognitive and/or behavioural deficits that fall within the spectrum of frontotemporal dementia (FTD) [1]. Overall, approximately 10% of ALS patients have a positive family history for ALS and/or FTD. The C9ORF72 expansion is the most common cause of genetic ALS [2] and is a strong risk factor for cognitive impairment up to full-blown FTD in these patients [3]. Frontotemporal syndromes associated with ALS are typically characterised by deficits in executive function, language, and behaviour [4]. In addition, FTD due to C9ORF72 mutation has peculiar manifestations. Late-onset psychosis and bipolar disorder can be the initial prodromal phase of dementia [5]. Furthermore, a recent study pointed out that a previous psychopathological history, including depressive disorder, post-traumatic stress disorder and substance abuse or dependence, is more frequently detected in C9ORF72 expansion carriers compared to the general population [6]. Neuroimaging studies on C9ORF72 expansion carriers consistently support the central role of this gene in the ALS-FTD continuum. Brain Magnetic Resonance Imaging (MRI) studies show that symptomatic C9ORF72 carriers have increasing ventricular volumes and decreasing bilateral thalamic volumes over time, compared to both control and sporadic ALS groups. These changes are accompanied by prominent cortical thinning in bilateral frontal and temporal regions [7]. On the other hand, 2-[^18^F]fluoro-2-deoxy-D-glucose-Positron-Emission Tomography ([^18^F]FDG-PET) imaging reveals relative hypometabolism in the anterior/posterior cingulate cortex, insula, caudate, thalamus, frontal cortex, and superior temporal lobe, as well as relative hypermetabolism in the midbrain, occipital cortex, globus pallidus, and middle/inferior temporal regions in ALS patients carrying the C9ORF72 expansion compared to non-mutated patients [8]. With regard to the investigation of brain connectivity, an MRI-based study showed that C9ORF72 ALS patients have a greater involvement of frontal white matter tracts and enhanced functional connectivity of the visual network than ALS patients not carrying the expansion [9].
This study aimed to investigate brain metabolic connectivity in C9ORF72 patients by applying [^18^F]FDG-PET to highlight differences compared with patients without the mutation.
Materials and methods
Participants
We included 70 patients carrying the C9ORF72 expansion (C9-ALS), diagnosed with genetically determined ALS according to El Escorial revised diagnostic criteria [10] at the ALS Centre of Turin (‘Rita Levi Montalcini’ Department of Neuroscience, University of Turin, Turin, Italy), between 2008 and 2022. A comparison cohort of 70 patients diagnosed with definite, probable, and probable laboratory-supported ALS according to El Escorial revised diagnostic criteria [10] was randomly collected from the series of 891 subjects who underwent brain [^18^F]FDG-PET at diagnosis in the same time period at the ALS Centre of Turin. These subjects did not carry any mutations in the major ALS-related genes (i.e. SOD1, TARDBP, FUS, C9ORF72) and were labeled as control ALS (ctrl-ALS). To ensure the representativeness of both the C9- and the ctrl-ALS samples, we systematically compared their principal demographic and clinical variables (i.e., age at onset, sex, cognitive status according to international diagnostic criteria [11], diagnostic delay, and ΔALSFRS-R) against those of the corresponding register population (Piemonte and Valle d’Aosta Register, PARALS [12]) up to 2022. The diagnostic delay was calculated as the time interval in months between the onset of symptoms and the date of diagnosis. The ΔALSFRS-R was calculated as the number of points lost per month from disease onset to diagnosis. These comparisons, as well as the direct comparison between C9-ALS and ctrl-ALS were based on the following tests: the Chi-square test for nominal categorical variables; the non-parametric Kruskal-Wallis test for continuous quantitative variables with significant Levene test and Shapiro-Wilk test results, where the assumptions of homogeneity of variances and normality of distribution required for ANOVA were not met.
Genetic analysis and neuropsychological assessment
We reported the procedure for genetic screening and neuropsychological evaluation elsewhere [3, 13].
[18F]FDG-PET image acquisition and pre-processing
Brain [^18^F]FDG-PET was performed according to published guidelines [14]. Patients fasted at least 6 h before the examination. Blood glucose was < 7.2 mmol/l in all cases before the procedure. After a 20-min rest, 185–200 MBq of [^18^F]FDG was injected. The acquisition started 60 min after the injection. PET/CT scans were performed on a Discovery ST-E System (General Electric). Acquisition duration was approximately 15 min. Brain CT and PET scans were performed sequentially. The former was used for attenuation correction of the PET data. The PET images were reconstructed with four iterations and 28 subsets with an initial voxel size of 2.34 × 2.34 × 2.00 mm, and data were collected in 128 × 128 matrices. The reconstruction algorithm was VUE Point HD. It does not include PSF and TOF corrections. The number of slices was 47. Images were spatially normalised to a customised brain [^18^F]FDG-PET template [15] and subsequently smoothed with a 10-mm filter in MATLAB R2018b (MathWorks, Natick, MA, USA). The voxel size after spatial normalisation into the standard brain space is 2 × 2 × 2 mm. Intensity normalisation was performed at individual level by dividing the value at each voxel by the mean value of the whole brain.
Statistical analysis of [18F]FDG-PET data
We compared C9-ALS and ctrl-ALS through the two-sample t-test model of SPM12. We did not include any covariates in this analysis after proving that the C9-ALS and the ctrl-ALS samples were adequately representative of the patients carrying and not carrying the C9ORF72 expansion in the ALS population of the PARALS. Therefore, any differences in demographic and clinical features between the two samples (C9-ALS and the ctrl-ALS) are expected reflect phenotypic variations between these two subgroups of patients within the ALS population. In this comparison the height threshold was set at P < 0.001 (P < 0.05 FWE-corrected at cluster level). Metabolic clusters showing a significant difference between C9-ALS and ctrl-ALS were then used as seed regions in a multiple regression analysis in each patient group to identify cerebral regions whose metabolism was positively or negatively correlated with that of the seed clusters (i.e., interregional correlation analysis, IRCA). IRCA applied to [^18^F]FDG-PET is a statistical method used to assess metabolic connectivity in the brain by evaluating the correlation of glucose metabolism between different brain regions. Regions showing high interregional correlation are interpreted as being metabolically connected. This method provides insights into the network organization of the brain. In this method, the [^18^F]FDG uptake values from regions of interest (seed regions) are extracted, and their correlation with other brain regions is computed to assess the degree of metabolic coupling between brain areas. The resulting correlation patterns reflect large-scale network organisation and can reveal alterations in functional integration associated with neurological disorders. For the IRCA we set the height threshold at P < 0.001 as well (P < 0.05 FWE-corrected at cluster level). In all the analyses only clusters containing > 125 contiguous voxels were considered significant. Brodmann areas (BAs) were identified at a 0–2-mm range from the Talairach coordinates of the SPM output isocenters corrected by Talairach Client (http://www.talairach.org/index.html).
Compliance with reporting guidelines
We have followed the STROBE reporting guideline.
Results
Demographic and clinical features of participants
The demographic and clinical characteristics of C9-ALS and ctrl-ALS included in the study are reported in Table 1, in comparison with the PARALS population. The ctrl-ALS group showed no statistically significant differences compared to the subjects with normal genetic screening from the register population of the PARALS in any of the considered variables. By contrast, the C9-ALS group differed from the C9ORF72 positive subjects of the register population only in terms of Strong category distribution, showing a statistically significant lower proportion of patients with comorbid frontotemporal dementia (ALS/FTD). In the direct comparison between C9-ALS and ctrl-ALS included in the study, C9-ALS patients showed a significantly lower age at onset (p = 0.0005). No other significant difference was found for the variables reported in Table 1.
Table 1. Demographic and clinical characteristics of C9-ALS and ctrl-ALS: comparison of each group with the corresponding subjects of the Piemonte and Valle d’Aosta Register for ALS (PARALS) population*C9-*ALS (study sample) (n = 70)*C9-*ALS (PARALS) (n = 143)p-valueSex, male [n(%)]37 (53)72 (50)0.843Cognitive classification, [n(%)]0.017∙ ALSbi7 (10)4 (3)∙ ALSci11 (16)21 (15)∙ ALScbi1 (1)4 (3)∙ CN28 (40)34 (23)∙ FTD10 (14)40 (28)∙ Missing13 (19)40 (28)Age at onset, years [median (IQR)]57.8 (50.7 – 64.4)61.3 (53.9 – 67.1)0.051Diagnostic delay, years [median (IQR)]0.8 (0.5 – 1.0)0.7 (0.4 – 1.1)0.372ΔALSFRS-R, points/months [median (IQR)]0.5 (0.3 – 0.9)0.7 (0.4 – 1.1)0.064Ctrl-ALS (study sample) (n = 70)Ctrl-ALS (PARALS) (n = 1808)p-valueSex, male [n(%)]39 (56)1004 (56) 1.000Cognitive classification, [n(%)]0.188∙ALSbi5 (7)90 (5)∙ALSci5 (7)212 (12)∙ALScbi2 (3)72 (4)∙CN33 (48)559 (31)∙FTD4 (5)150 (8)∙Missing21 (30)725 (40)Age at onset, years [median (IQR)]66.2 (55.7 – 73.0)67.3 (59.3 – 73.8)0.211Diagnostic delay, years [median (IQR)]0.8 (0.6 – 1.2)0.8 (0.4 – 1.2)0.246ΔALSFRS-R, points/months [median (IQR)]0.6 (0.4 – 1.1)0.6 (0.3 – 1.3)0.846Data were compared using Mann Whitney U test for continuous variables and chi-square test for categorical variablesALSbi: ALS with behavioural impairment. ALSci: ALS with cognitive impairment. ALScbi: ALS with cognitive and behavioural impairment. CN: cognitively normal. ALS-FTD: ALS with frontotemporal dementia
[18F]FDG-PET data: direct comparison between C9-ALS and ctrl-ALS
To address the soundness of the whole brain as a normalisation factor, we have followed the procedure by Borghammer et al. [16]. Specifically, we have extracted the global whole brain mean metabolic values for both C9-ALS and ctrl-ALS and performed a two-sample t-test to address whether the normalisation factors are statistically different or not between the two groups, possibly leading to biased normalisation. The average (+/- SD) metabolic intake for C9-ALS is 1588.43 +/- 375.76, compared to 1560.54 +/- 381.90 for ctrl-ALS (+ 1.8% difference of C9-ALS versus ctrl-ALS). The two-sample t-test yielded p = 0.672 (t = 0.4243, CI at 95% = [-102.14, 157.92]), not rejecting the null hypothesis that the two groups have equal means, suggesting the whole brain as a sound normalisation factor between the two groups (as there are no metabolic a-priori differences that would undermine the normalisation).
C9-ALS showed clusters of relative hypometabolism in bilateral thalamus (bilateral pulvinar and left medial dorsal nucleus) and left precentral and postcentral gyri, and clusters of relative hypermetabolism in bilateral cerebellum and brainstem (Fig. 1; Table 2). As seed regions for the IRCA, we focused on the thalamic cluster and the cerebellar/brainstem cluster, based on the peculiar involvement of these regions in C9ORF72-related ALS [8, 17]. No further segmentation of the seed regions was performed according to side or subregions. In addition, we have also run the analyses by adding age at PET as covariate, since this variable represented the only significant difference between the two study groups among demographic and clinical features. The clusters of relative hypo- and hypermetabolism of C9-ALS compared to ctrl-ALS found in the main analyses were still present after the correction for age at PET (data not shown).
Fig. 1. The regions showing a statistically significant relative hypometabolism in C9-ALS patients as compared to ctrl-ALS subjects are marked in green, while the regions showing a statistically significant relative hypermetabolism in C9-ALS patients as compared to ctrl-ALS subjects are marked in red. The clusters are reported on axial sections of a brain Magnetic Resonance Imaging template and on the brain surface of a glass brain rendering (bottom right)
Table 2. Clusters of relative hypometabolism and hypermetabolism of C9-ALS compared to ctrl-ALS. BA: Brodmann areaClusters of relative hypometabolism of *C9-*ALS compared to ctrl-ALS P (FWE- corrected)
Cluster extent
Z-score Talairach coordinates (x,* y*,* z)* Brain region
Sub-region 0.0002,0056.8420-295Right ThalamusPulvinar6.45-16-293Left ThalamusPulvinar6.19-6-134Left ThalamusMedial Dorsal Nucleus0.0117944.32-51-1315Left Postcentral GyrusBA 434.07-59-834Left Precentral GyrusBA 6Clusters of relative hypermetabolism of *C9-*ALS compared to ctrl-ALS P (FWE- corrected)
Cluster extent
Z-score Talairach coordinates (x,* y*,* z)* Brain region
Sub-region 0.0002,4416.610-35-5Left Cerebellar Anterior LobeCulmen4.47-6-37-37Left Cerebellar Posterior LobeCerebellar Tonsil4.0714-30-24Right Cerebellar Anterior LobeCulmen3.4412-39-38Right Cerebellar Posterior LobeCerebellar Tonsil0.0006,1294.71-40-52-33Left Cerebellar Posterior LobeCerebellar Tonsil4.41-12-77-21Left Cerebellar Posterior LobeDeclive4.2842-49-36Right Cerebellar Posterior LobeCerebellar Tonsil4.25-34-81-31Left Cerebellar Posterior LobePyramis4.1936-65-22Right Cerebellar Posterior LobeDeclive4.1814-71-47Right Cerebellar Posterior LobeInferior Semi-Lunar Lobule4.07-12-69-47Left Cerebellar Posterior LobeInferior Semi-Lunar Lobule3.7050-70-30Right Cerebellar Posterior LobeTuber3.7050-66-32Right Cerebellar Posterior LobePyramis
[18F]FDG-PET data: IRCA in C9-ALS
In the IRCA in C9-ALS patients, we found that the thalamic cluster metabolism was positively correlated with the metabolism of large bilateral thalamic regions, bilateral cingulum and right caudate, and negatively correlated with the metabolism of right precuneus, precentral and postcentral gyri, and left medial frontal gyrus and paracentral lobule (Fig. 2; Table 3).
Fig. 2IRCA in C9-ALS: clusters of positive (marked in yellow) and negative (marked in blue) correlation with the thalamic cluster (seed region) are reported on axial sections of a brain Magnetic Resonance Imaging template and on the brain surface of a glass brain rendering (bottom right)
Table 3IRCA in C9-ALS: clusters of positive and negative correlation with the thalamic cluster (seed region). BA: Brodmann areaIRCA in C9-ALS: cluster of positive correlation with the thalamic cluster P (FWE- corrected)
Cluster extent
Z-score Talairach coordinates (x,* y*,* z)* Brain region
Sub-region 0.00012,84965,53510-96Right ThalamusVentral Lateral Nucleus65,535-6-104Left Thalamus65,53512-235Right Thalamus6.12161527Right Cingulate GyrusBA 325.944-628Right Cingulate GyrusBA 245.934-1228Right Cingulate GyrusBA 235.79-6727Left Cingulate GyrusBA 245.788925Right Anterior CingulateBA 335.5516129Right CaudateCaudate Body5.50-41523Left Anterior CingulateBA 24IRCA in C9-ALS: cluster of negative correlation with the thalamic cluster P (FWE- corrected)
Cluster extent
Z-score Talairach coordinates (x,* y*,* z)* Brain region
Sub-region 0.0001,4374.1520-5252Right PrecuneusBA 73.8716-2855Right Sub-GyralBA 43.81-10-2262Left Medial Frontal GyrusBA 63.7328-1862Right Precentral GyrusBA 63.69-8-4059Left Paracentral LobuleBA 53.2318-4567Right Postcentral GyrusBA 7
The metabolism of the cerebellar/brainstem cluster was positively correlated with the metabolism of the whole cerebellum, the pons and the medulla oblongata, and negatively correlated with the metabolism of a large cluster including bilateral frontal cortex e left insula (Fig. 3; Table 4).
Fig. 3IRCA in C9-ALS: clusters of positive (marked in yellow) and negative (marked in blue) correlation with the cerebellar/brainstem cluster (seed region) are reported on axial sections of a brain Magnetic Resonance Imaging template and on the brain surface of a glass brain rendering (bottom right)
Table 4IRCA in C9-ALS: clusters of positive and negative correlation with the cerebellar/brainstem cluster (seed region). BA: Brodmann areaIRCA in C9-ALS: cluster of positive correlation with the cerebellar/brainstem cluster P (FWE- corrected)
Cluster extent
Z-score Talairach coordinates (x,* y*,* z)* Brain region
Sub-region 0.00019,75965,53514-69-25Right Cerebellar Posterior LobeUvula65,535-30-53-38Left Cerebellar Posterior LobeCerebellar Tonsil65,53516-68-37Right Cerebellar Posterior LobeInferior Semi-Lunar Lobule65,535-10-70-28Left Cerebellar Posterior LobePyramis65,535-18-69-23Left Cerebellar Posterior LobeUvula7.76-6-63-20Left Cerebellar Posterior LobeDeclive7.7112-61-17Right Cerebellar Posterior LobeDeclive7.67-16-72-38Left Cerebellar Posterior LobeInferior Semi-Lunar Lobule7.5226-47-40Right Cerebellar Posterior LobeCerebellar Tonsil7.49-34-60-29Left Cerebellar Posterior LobeTuber5.00-6-38-28Left Cerebellar Anterior Lobe4.728-36-27Right Cerebellar Anterior LobeIRCA in C9-ALS: cluster of negative correlation with the cerebellar/brainstem cluster P (FWE- corrected)
Cluster extent
Z-score Talairach coordinates (x,* y*,* z)* Brain region
Sub-region 0.00062,14565,535-4633Left Cingulate GyrusBA 247.0583950Right Superior Frontal GyrusBA 87.0062528Right Cingulate GyrusBA 326.96384625Right Middle Frontal GyrusBA 106.95-32362Left Middle Frontal GyrusBA 66.706933Right Cingulate GyrusBA 246.59302443Right Middle Frontal GyrusBA 86.56-242336Left Middle Frontal GyrusBA 86.55-43419Left Anterior CingulateBA 326.4838361Right Middle Frontal GyrusBA 66.3563924Right Inferior Frontal GyrusBA 96.3544620Right Medial Frontal GyrusBA 96.32-324918Left Superior Frontal GyrusBA 106.32-23548Left Superior Frontal GyrusBA 86.30-4663Left InsulaBA 13
[18F]FDG-PET data: IRCA in ctrl-ALS
In the IRCA in ctrl-ALS subjects, the thalamic cluster showed a positive correlation with a cluster encompassing bilateral cingulate cortex and bilateral cerebellar regions (Fig. 4; Table 5). No negative correlation was found.
Fig. 4IRCA in ctrl-ALS: the cluster of positive correlation with the thalamic cluster (seed region) is marked in yellow and is reported on axial sections of a brain Magnetic Resonance Imaging template and on the brain surface of a glass brain rendering (bottom right)
Table 5IRCA in ctrl-ALS: cluster of positive correlation with the thalamic cluster (seed region). BA: Brodmann areaIRCA in ctrl-ALS: cluster of positive correlation with the thalamic cluster P (FWE- corrected)
Cluster extent
Z-score Talairach coordinates (x,* y*,* z)* Brain region
Sub-region 0.0007,34565,53510-141Right Thalamus65,535-8-233Left Thalamus65,53512-231Right ThalamusMammillary Body4.40-2-2427Left Cingulate GyrusBA 234.33-4-3622Left Posterior Cingulate GyrusBA 234.132-38-18Right Cerebellar Anterior LobeCulmen3.986-4017Right Posterior Cingulate GyrusBA 293.64-40-54-29Left Cerebellar Anterior LobeCulmen3.37-18-38-23Left Cerebellar Anterior Lobe*3.180-59-17Right Cerebellar Posterior LobeDeclive
The cerebellar/brainstem cluster showed a positive correlation with the whole cerebellum and brainstem and a negative correlation with broad areas encompassing bilateral frontal, temporal and parietal cortices (Fig. 5; Table 6).
Fig. 5IRCA in ctrl-ALS: clusters of positive (marked in yellow) and negative (marked in blue) correlation with the cerebellar/brainstem cluster (seed region) are reported on axial sections of a brain Magnetic Resonance Imaging template and on the brain surface of a glass brain rendering (bottom right)
Table 6IRCA in ctrl-ALS: clusters of positive and negative correlation with the cerebellar/brainstem cluster (seed region). BA: Brodmann areaIRCA in ctrl-ALS: cluster of positive correlation with the cerebellar/brainstem cluster P (FWE- corrected)
Cluster extent
Z-score Talairach coordinates (x,* y*,* z)* Brain region
Sub-region 0.00026,23265,535-18-67-20Left Cerebellar Posterior LobeDeclive65,53512-69-22Right Cerebellar Posterior LobeDeclive65,5358-71-25Right Cerebellar Posterior LobePyramis65,535-6-71-25Left Cerebellar Posterior LobePyramis65,53532-46-30Right Cerebellar Anterior Lobe65,5358.0-51-18Right Cerebellar Anterior LobeCulmen65,535-28-54-24Left Cerebellar Anterior LobeCulmen65,53534-55-41Right Cerebellar Posterior LobeCerebellar Tonsil65,5358-62-36Right Cerebellar Posterior LobeInferior Semi-Lunar Lobule7.75-36-56-31Left Cerebellar Posterior LobeCerebellar Tonsil7.75-24-44-26Left Cerebellar Anterior LobeIRCA in ctrl-ALS: clusters of negative correlation with the cerebellar/brainstem cluster P (FWE- corrected)
Cluster extent
Z-score Talairach coordinates (x,* y*,* z)* Brain region
Sub-region 0.00041,8506.57-44524Left Inferior Frontal GyrusBA 96.18-282739Left Middle Frontal GyrusBA 86.17-403217Left Middle Frontal GyrusBA 466.12362741Right Middle Frontal GyrusBA 86.0483252Right Superior Frontal GyrusBA 66.03264337Right Middle Frontal GyrusBA 95.78-43548Left Superior Frontal GyrusBA 85.77501238Right Middle Frontal GyrusBA 85.77-301445Left Middle Frontal GyrusBA 65.7657316Right Inferior Frontal GyrusBA 455.66502817Right Inferior Frontal GyrusBA 465.62104740Right Superior Frontal GyrusBA 85.60281255Right Middle Frontal GyrusBA 65.45123419Right Anterior CingulateBA 325.42345514Right Superior Frontal GyrusBA 100.0003,8205.30-51-4647Left Inferior Parietal LobuleBA 404.27-51-5929Left Superior Temporal GyrusBA 393.89-55-488Left Superior Temporal GyrusBA 223.79-53-566Left Middle Temporal GyrusBA 393.77-30-7042Left PrecuneusBA 193.73-63-426Left Middle Temporal GyrusBA 220.0002,3764.5453-5125Right Supramarginal GyrusBA 404.5453-4446Right Inferior Parietal LobuleBA 404.0838-5847Right Superior Parietal LobuleBA 73.7663-2534Right Postcentral GyrusBA 23.7169-3020Right Superior Temporal GyrusBA 42
Discussion
The purpose of this study was to investigate the brain metabolic connectivity in ALS patients with C9ORF72 expansion. To this end, we analysed a sample of 70 patients with C9ORF72 mutation (C9-ALS) and 70 ALS patients without genetic mutations serving as the reference group (ctrl-ALS). The C9-ALS group was representative of the subgroup of patients carrying such mutation in our population-based register (PARALS), except for a lower degree of FTD in our sample. Despite this difference, we considered the group suitable for our purpose, accepting the risk of underestimating the differences compared with the ctrl-ALS group. The ctrl-ALS group was fully representative of the PARALS population.
In a direct comparison between C9-ALS and ctrl-ALS, [^18^F]FDG-PET imaging revealed relative hypometabolism in the thalami - specifically the bilateral pulvinar and left medial dorsal nucleus - and in the left precentral and postcentral gyri in C9-ALS. These findings confirm and extend previous MRI studies reporting reduced cortical thickness and gray matter volume in the same regions [18], supporting the notion that [^18^F]FDG-PET hypometabolism and structural atrophy are complementary indicators of neurodegeneration [19].
Thalamic changes, particularly hypometabolism and volumetric reduction, have been consistently reported in both symptomatic [8, 20] and presymptomatic C9ORF72 expansion carriers [21, 22]. Pathologically, the thalami in these individuals are known to accumulate both TDP-43 [17] and dipeptide repeat (DPR) proteins [23, 24], the latter produced through repeat-associated non-ATG (RAN) translation of the hexanucleotide expansion. Thalamic damage appears to be part of a broader network degeneration associated with psychotic symptoms, commonly seen in C9ORF72 patients [25], similar to networks implicated in schizophrenia [26].
A prior study on behavioural variant frontotemporal dementia (bvFTD) [27], often associated with ALS [28], showed that about one-third of bvFTD patients - mostly C9ORF72 carriers - had predominant subcortical atrophy and slower disease progression. This may explain the predominantly subcortical hypometabolism in our C9-ALS sample, as more cognitively impaired patients may have been underrepresented due to lower compliance with PET protocols. This is also consistent with the lower proportion of full-blown FTD in our C9-ALS group compared to the broader population of C9ORF72 expansion carriers in our epidemiological register (PARALS).
Focusing on the thalamic hypometabolic cluster, we used IRCA to assess metabolic connectivity. The thalamic seed region showed a broader positive correlation with the cingulate cortex, particularly its anterior region, in C9-ALS than in ctrl-ALS, suggesting a stronger involvement of the Salience Network (SN). The SN, which includes the pulvinar, medial dorsal thalamic nucleus, and anterior cingulate cortex, is crucial for processing emotionally relevant stimuli and supporting behavioural and cognitive control [20, 29]. Functional MRI data also support the idea that pulvinar degeneration contributes to bvFTD symptoms in C9ORF72 carriers through SN disruption [30]. The SN’s connectivity might also act as a path for spreading neurodegeneration, as proposed in other studies on neurodegenerative disorders [31].
Conversely, a negative correlation between the thalamic seed and the sensorimotor cortex was observed in C9-ALS but not in ctrl-ALS. Interestingly, this pattern resembles thalamic hyperconnectivity with sensorimotor cortex found in schizophrenia, even when thalamic atrophy is present, suggesting possible shared network dysfunction mechanisms [32].
Additionally, C9-ALS patients exhibited relative hypermetabolism in the brainstem and cerebellum compared to ctrl-ALS. These hypermetabolic patterns have been observed in ALS patients with cognitive impairment [33, 34]. Although cognitive status did not differ significantly between the two groups, there was a higher proportion of FTD cases in the C9-ALS group, supporting the relevance of these metabolic findings, as [^18^F]FDG-PET can reveal brain metabolic changes even in the absence of overt symptoms [21].
From a pathological perspective, TDP-43 proteinopathy rarely involves the cerebellum in ALS except in late stages, while the brainstem is affected early [35]. However, in C9ORF72 expansion carriers, the cerebellum is often affected by ubiquitin- and p62-positive, DPR-containing neuronal cytoplasmic inclusions [17]. These data demonstrate the involvement of the cerebellum in C9ORF72 expansion carriers, but are also compatible with its relative sparing compared to the frontal regions, as neurodegeneration appears to be more strongly associated with TDP-43 proteinopathy than with DPR [36].
To further explore cerebellar and brainstem involvement in C9-ALS and ctrl-ALS, we conducted IRCA using these regions as seeds in both groups. While positive correlations largely reflected local autocorrelation, negative correlations with frontal cortices were more extensive in C9-ALS. This inverse relationship between cerebellar and frontal metabolism may reflect a compensatory mechanism, with cerebellar regions attempting to offset declining frontal lobe function. This hypothesis seems to be supported by a previous study about cognitive reserve in ALS [37] and by neuroimaging and neuromodulation/neurostimulation studies suggesting that the cerebellum may undergo a compensatory reorganisation in neurodegenerative disorders causing cognitive impairment, such as AD and FTD [38].
However, this compensatory process might diminish over time, as the cerebellum becomes affected by TDP-43 pathology in advanced ALS stages [35], particularly in C9ORF72 carriers [17]. Thus, both degenerative and compensatory mechanisms may coexist in the cerebellum of ALS patients [39]. This complex interplay likely contributes to the metabolic and connectivity patterns observed in our study.
In summary, our findings suggest that C9-ALS is characterised by specific subcortical and network-level alterations, including thalamic and cerebellar metabolic changes, which may reflect both disease-specific neurodegeneration and potential compensatory responses. These insights deepen our understanding of how brain metabolic connectivity differs in genetically distinct ALS subtypes and underscore the role of intrinsic brain networks in ALS pathophysiology.
This study has some limitations. Firstly, our C9-ALS sample showed a lower percentage of cases with cognitive impairment up to FTD than C9ORF72 expansion carriers in our population-based register. This may have limited our findings, possibly due to reduced compliance with PET acquisition among FTD subjects, although it is difficult to fully assess this issue. Secondly, exhaustive and systematic data about psychotic symptoms are not available for the two study groups, thus we could not evaluate their relationship with thalamic metabolic changes, that seem a distinctive feature of ALS with C9ORF72 expansion. Regarding the possibility of identifying subgroups according to motor phenotypes, it would not provide adequately sized samples to run further analyses. Thirdly, Structural MRI scans were not available for all subjects, so we could not correct for cortical atrophy. Nevertheless, previous studies have shown that measures of metabolism were relatively independent of brain atrophy [40].
In conclusion, our study shows that C9-ALS patients have a relatively lower metabolism mainly in the thalami and a relatively higher metabolism in the brainstem and the cerebellum compared to ctrl-ALS. Together with the analysis of the metabolic connectivity of these regions, these data suggest a twofold hypothesis. On the one hand, C9-ALS seem to show a predominant involvement of the SN compared to ctrl-ALS. The SN is related to cognitive and behavioural control and could act as a pathway for brain degeneration. On the other hand, the cerebellum may be recruited to cope with cognitive impairment to a greater extent in C9-ALS than in ctrl-ALS. Further studies including longitudinal assessments are warranted to further elucidate C9ORF72-related changes in brain integrity and connectivity.
The reference list from the paper itself. Each links out to its DOI / PubMed record.
- 1Canosa A, Moglia C, Manera U, Vasta R, Torrieri MC, Arena V, et al. Metabolic brain changes across different levels of cognitive impairment in ALS: a 18F-FDG-PET study. J Neurol Neurosurg Psychiatry. 2020;jnnp-2020-323876. 10.1136/jnnp-2020-323876.10.1136/jnnp-2020-32387633229451 · doi ↗ · pubmed ↗