The second decade of DTI in TBI Part 2: a systematic review of moderate and severe TBI
Molly F. Charney, Simone Glajchen, Shawn Brain, Fahmida Rashid, Sabrina Kentis, Melvin Alexander, Arvind Dev, Jenasis Ortega, Chihiro Okada, Brian Morris, Timothy Darby, Taskin Forkan, Anthony D. Yao, Yuchen Dong, Cindy Zhou, Emily Hunt, Jane Wee, Caroline Delbourgo Patton

TL;DR
This systematic review explores how diffusion tensor imaging (DTI) has been used to study moderate to severe traumatic brain injury (TBI) from 2012 to 2022, finding consistent evidence of reduced tissue integrity in TBI patients.
Contribution
The paper provides an updated systematic review of DTI applications in moderate to severe TBI, highlighting trends and findings from the second decade of DTI use.
Findings
Lower fractional anisotropy (FA) in moderate to severe TBI patients compared to controls is consistently observed across studies.
Longitudinal studies and whole-brain analyses have increased in DTI research on TBI in recent years.
Reduced FA is associated with worse cognitive outcomes and greater TBI severity.
Abstract
Traumatic Brain Injury (TBI) is a pervasive and important public health concern. TBI can range from mild, resulting in headaches and other neurologic symptoms, to severe resulting in coma and death. Diffusion tensor imaging (DTI) offers the ability to assess tissue microstructure at a level inaccessible to classical neuroimaging methods, such as CT and structural MRI. This systematic review aims to explore studies using DTI in moderate–severe TBI (msTBI) during the 2012–2022 decade, which is the second decade of reported use. The use of DTI in mild TBI during this time period is discussed in our companion systematic review. A systematic literature review was conducted by a medical librarian in accordance with the Preferred Reporting Items for Systematic Reviews and Meta-Analyses (PRISMA) guidelines. We searched the electronic databases PubMed/MEDLINE, Embase, Cochrane Library, and Web…
Genes, proteins, chemicals, diseases, species, mutations and cell lines named across the full text — each resolved to its canonical identifier and authoritative record.
Click any figure to enlarge with its caption.
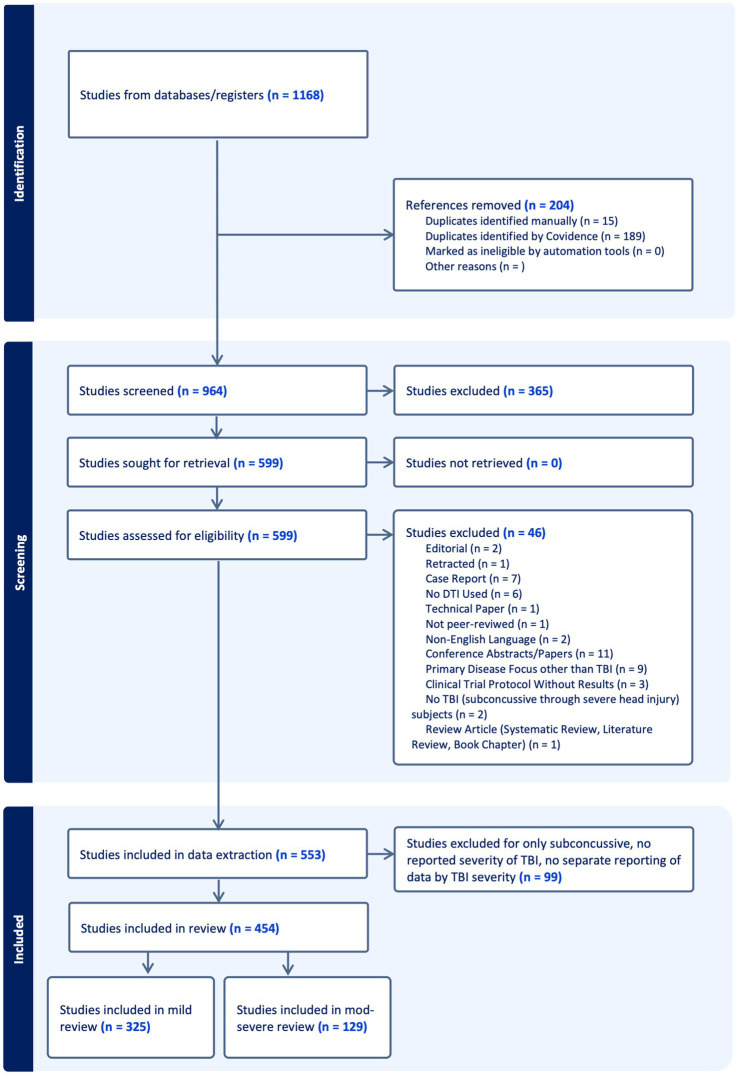 Figure 1
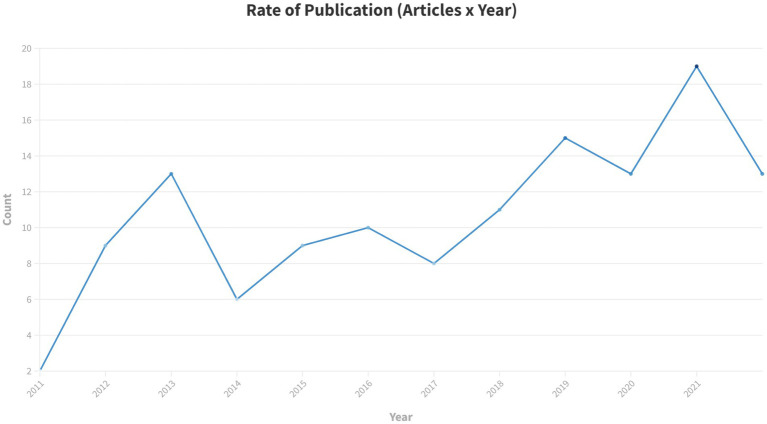 Figure 2
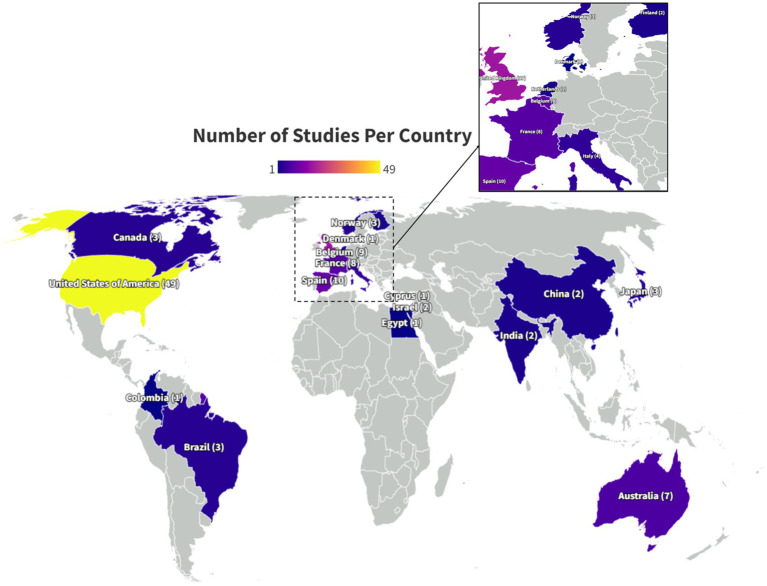 Figure 3
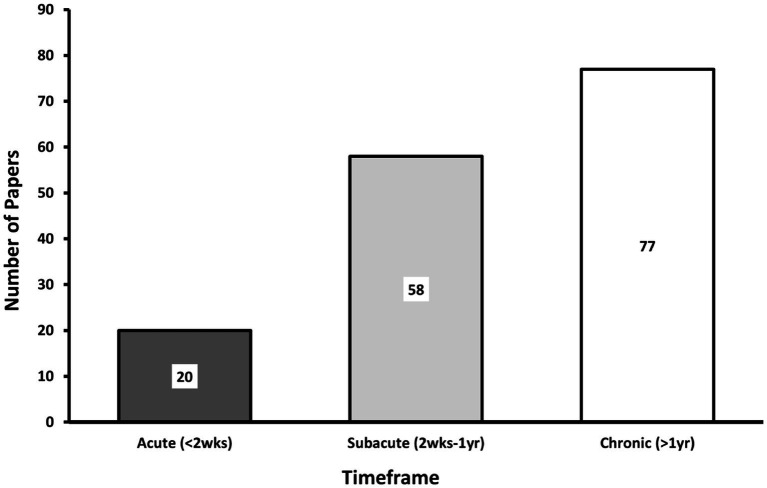 Figure 4
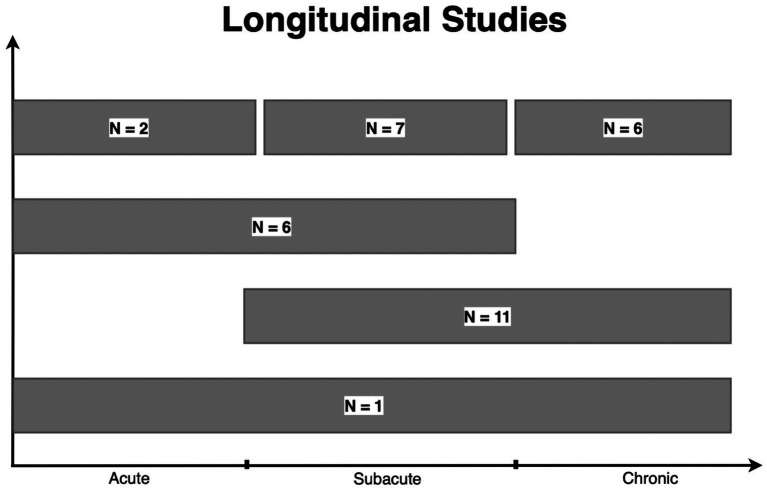 Figure 5
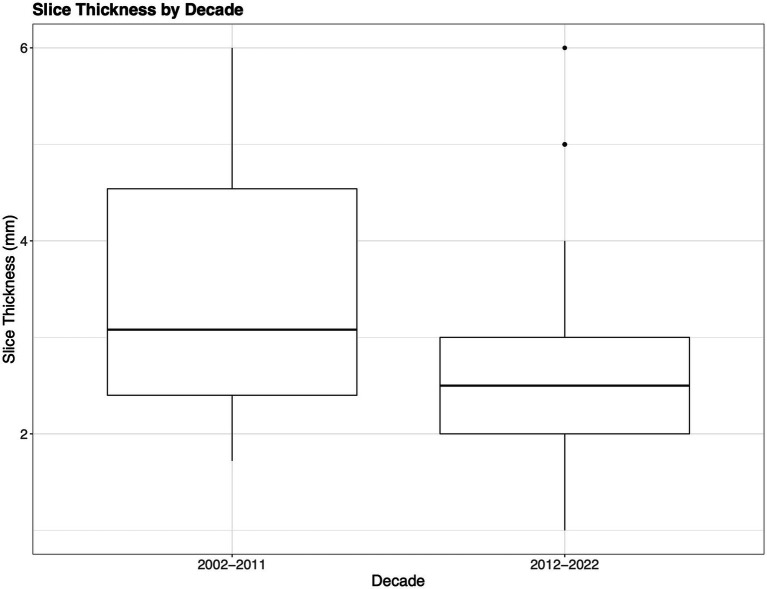 Figure 6
| Demographic variables | Value |
|---|---|
| Study subjects | |
| Total msTBI participants | 9,609 |
| Average msTBI participants per study | 74 |
| Range of msTBI participants per study | 8–246 |
| Sex | |
| Male | 76.40% |
| Female | 23.60% |
| Age | |
| Average Age (years) | 32.96 |
| Age Range (years) | 12–70 |
| Number of Studies with patients <18 years old | 23 |
| Population studied | |
| General/Civilian | 92.25% |
| Sports | 0% |
| Military | 4.65% |
| Unspecified | 4.65% |
| Mechanism of injury | |
| MVA, Falls, Assaults | 69.77% |
| Sports | 11.63% |
| Military Blasts | 3.1% |
| Mixed: Sports, MVA, Falls, Assaults | 10.08% |
| Mixed: Blast, Sports, MVA, Falls, Assaults | 1.55% |
| Not reported | 28.68% |
| DTI measure | Association | Global outcome measures | GCS | Mood symptoms | Balance | Behavior/Communication | PTA |
|---|---|---|---|---|---|---|---|
| FA | Positive |
|
|
| |||
| Negative |
|
| |||||
| None | 6(11, 26, 63, 65, 130, 133) | 2(43, 91) | 4(20, 34, 47, 71) | 1(130) | 1(83) | ||
| MD | Positive |
| |||||
| Negative |
|
|
| ||||
| None | 1(26) | 2(34, 71) | 1(83) |
| DTI measure | Association | Overall cognition | Attention | Executive function | Memory | Psychomotor/Processing Speed | Visuospatial | IQ | Verbal Fluency/Language Tasks/Reading Fluency |
|---|---|---|---|---|---|---|---|---|---|
| FA | Positive | 4 (16, 27, 53, 90) | 1 (64) | 3 (19, 41, 109) | 7 (14, 29, 37, 39, 64, 72, 127) | 13 (12, 29, 31, 33, 37, 39, 41, 45, 69, 77, 89, 109, 122) | 1 (64) | 4 (27, 39, 73, 77) | |
| Negative | 1 (27) | 2 (11, 104) | 1 (15) | 1 (104) | 2 (15, 77) | ||||
| None | 3 (29, 73, 77) | 3 (73, 77, 87) | 2 (29, 73) | 5 (68, 73, 77, 87, 122) | 4 (11, 55, 68, 87) | 1 (14) | 2 (87, 122) | 2 (64, 122) | |
| MD | Positive | 1 (104) | 1 (104) | ||||||
| Negative | 2 (16, 27) | 1 (64) | 2 (11, 109) | 4(29, 64, 69, 72) | 4 (29, 37, 89, 109) | 1 (64) | 2 (27, 64) | ||
| None | 1 (53) | 1 (87) | 1 (29) | 4(37, 39, 68, 87) | 3 (39, 68, 87) | 1 (87) | 1 (39) |
Peer Reviews
No public reviews on file for this paper yet. If you reviewed it on a platform where reviews are public (OpenReview, ICLR, NeurIPS, ICML), you can paste yours below so the community can read it here.
Videos
No videos yet. Explain this paper in a talk, walkthrough, or lecture? Add one.
Taxonomy
TopicsAdvanced Neuroimaging Techniques and Applications · Traumatic Brain Injury Research · Traumatic Brain Injury and Neurovascular Disturbances
Introduction
1
Over 5.5 million people sustain moderate or severe traumatic brain injury (msTBI) each year worldwide (1). msTBI, commonly due to motor vehicle collision (MVCs), falls, and assaults (2), is a leading cause of mortality and morbidity across the lifespan. Prognosis following injury varies considerably, with msTBI frequently associated with prolonged hospitalization, extensive rehabilitation requirements, and diminished quality of life (3). While there has been significant advancement in the care and management of patients with msTBI, prognostic indicators and therapeutic interventions for msTBI remain extremely limited.
TBI classification is based on mechanism (closed vs. penetrating) and acute clinical severity assessment (e.g., Glasgow Coma Scale). Neuroimaging offers an objective assessment of injury in patients diagnosed with msTBI. Gross injury to the brain, detectable on CT and structural MRI is a common feature of msTBI and is a key target of acute management (4). Gross imaging findings, however, do not reliably predict outcome or recovery (4). Diffusion tensor imaging (DTI) offers the ability to assess tissue microstructure at a level inaccessible to CT and structural MRI (5). Animal and human studies have shown it is well-suited to the characterization of traumatic axonal injury (5). Since its first published application to TBI in 2002, DTI has been used extensively to characterize white matter effects of TBI (6). A comprehensive systematic review reported on studies applying DTI to TBI from 2002 to 2012, its first decade of reported use (6). The present systematic review encompasses published studies of DTI applied to msTBI during 2012–2022. Due to the large number of DTI studies on TBI published since 2012, we report separately on studies of mild TBI (mTBI) in a companion paper. We present here a comprehensive review of 129 studies, describe how this landscape has changed from the previous decade; and compare msTBI findings to those reported in mTBI.
Materials and methods
2
Protocol and registration
2.1
The protocol for this systematic review was registered in Prospero (CRD42022361318) and is available online www.crd.york.ac.uk/prospero/display_record.php?RecordID=361318.
Literature review
2.2
A systematic literature review was conducted by a medical librarian in accordance with the Preferred Reporting Items for Systematic Reviews and Meta-Analyses (PRISMA) guidelines (7). We searched the electronic databases PubMed/MEDLINE, Embase, Cochrane Library, and Web of Science on September 28, 2022. A combination of controlled vocabulary and text words was used. Terms included: “diffusion tensor imaging,” “DTI,” “traumatic brain injur*,” “TBI,” and “concussion.” The searches were conducted without any geographical restrictions and were limited to English-language articles only. Only articles published between 2012 and the date of our search, September 28, 2022, were included since the purpose of this review was to update a previously published review focusing on 2002–2012. Complete search strategy is included in the Supplemental materials.
Study selection
2.3
All references were imported into Endnote 20 reference management software (Clarivate, Philadelphia, PA) and de-duplication was carried out. They were then uploaded to Covidence (Veritas Health Innovation, Melbourne, Australia), an online literature review management tool. Further de-duplication was performed, followed by screening of the articles against the eligibility criteria, first based on the title and abstract and then based on the full text. Each article was independently assessed by two reviewers who were blinded to each other’s decisions. Conflicts were resolved by the lead reviewers (MC and FR). Details of the article screening and key decisions were preserved in Covidence. Studies were included in the systematic review if they met the following criteria: (1) peer-reviewed original research; (2) written in English; (3) participants were adults and/or children (we did not exclude articles on the basis of participant age) with a TBI of any severity from subconcussive through severe; and (4) DTI was performed at one or more time points. Exclusion criteria included: (1) articles in languages other than English; (2) studies conducted on animals or in vitro; (3) the primary disease focus was a disease other than TBI (including post-traumatic stress disorder, post-traumatic headache and tumors); (4) studies not employing DTI or advanced diffusion imaging; and (5) references that were not research studies (e.g., reviews, editorials, etc.) or that lacked full peer-review (e.g., conference abstracts, protocols, etc.). Due to the large volume of literature using DTI to study TBI from 2012 to 2022, this review will report only on those studies that focus on moderate and/or severe TBI. Those that focus on mild TBI will be discussed separately, in our companion paper, “DTI in Mild Traumatic Brain Injury- The Second Decade: A Systematic Review”.
Data extraction and quality assessment
2.4
References that passed the screening process underwent data extraction and quality assessment by two members of the review team using a customized form created in Covidence. The data extraction form collected information on the study and participant characteristics – such as study design, setting, participant demographics, injury severity, mechanism of TBI, and imaging details – along with the major outcomes. In addition, a quality assessment form drawing on selected questions from the quality assessment tools developed by the national heart, lung, and blood Institute^6^ was created in Covidence and used to evaluate each study.
Results
3
A total of 1,168 articles were imported into Covidence. After removal of 204 duplicates, 964 studies underwent title and abstract screening. 365 were excluded and full text was reviewed for the remaining 599 studies. Ultimately, 553 studies underwent data extraction and quality assessment. The PRISMA flow diagram is displayed in Figure 1.
Preferred reporting items for systematic reviews and meta-analyses (PRISMA) flow diagram. Results of the initial search, title/abstract screening, and full text review, including reasons for exclusion are presented in the flow chart.
The 553 articles included in the extraction phase of the systematic review were further filtered to exclude any studies that reported exclusively on subconcussive head impacts, did not report the TBI severity of study groups, or included participants with a range of TBI severities without reporting separately for severity subgroups (n = 99). Due to the large volume of studies, the articles were divided into two subgroups- mTBI only (n = 325) and msTBI (n = 129). Articles that included both mild and moderate–severe TBI patients, but reported findings separately for each category, were categorized according to the severity (mild or moderate–severe) of the majority of the participants. The two subgroups are reported in separate companion papers, with the present paper focused on the 129 studies addressing msTBI.
Publication frequency
3.1
Over the past decade there has been an overall increase in the yearly publication rate with intermittent declines (Figure 2). The settings for papers studying moderate/severe TBI using DTI are geographically diverse (Figure 3). The studies included in this review were conducted in North and South America, Europe, Africa, Asia and Australia, with the greatest number of studies, 49/129 (38%) conducted in the US (8–56). The geographic distribution of studies is greater for studies of msTBI than for mTBI. This may be due to perceived clinical importance of more severe TBI worldwide and the hospital presentation that is typical in more severe injury.
Rate of publication of studies that use DTI to study moderate–severe TBI from 2012 to 2022.
Geographic distribution of moderate–severe TBI studies. Country of origin, determined by where each study included in this systematic review took place, is denoted on the world map. The color of the country denotes how many papers took place in that country. The number of studies is included in parentheses. The fewest studies took place in countries colored dark blue, while the most numerous studies took place in countries colored lighter purple and yellow. Parts of the world that are colored gray, without a country name identifier or number in parentheses, did not conduct a study of DTI in msTBI that was included in this systematic review.
TBI patient demographics
3.2
Demographic features of patients enrolled in msTBI studies are detailed in Table 1. More men (76.4%) than women were included as participants in the msTBI studies. This is consistent with epidemiologic cohort studies that have found that men experience msTBI at higher rates compared to women (57, 58). The variation in demographic features and mechanism of injury across studies limits integration of patient data and formulation of inferences aimed at specific features or mechanisms. While there were no specifically recruited athlete populations for msTBI, which differs from studies of mTBI where athletes are often specifically studied, 11.63% of participants were injured in the setting of athletics. It is also possible that some participants were included in more than one sample, as various studies published by the same authors reported similar patient sample characteristics. Eight pairs of studies may have overlapping participant enrollment (38, 48, 49, 54, 59–70).
Severity, chronicity, and study design
3.3
Some studies did not distinguish mTBI and msTBI in their reporting. Since these studies were excluded from the review, some msTBI patients are likely not included in our analysis. Severity of TBI was typically determined by Glasgow Coma Scale (GCS) score, with definitions of mild (GCS: 13–15), moderate (GCS: 9–12), and severe (GCS: 3–8) consistent across the studies. If a GCS score was not reported, severity reported by the authors was assumed to be accurate. Of the 129 studies that included either or both moderate and severe TBI, 98 reported on moderate TBI (8–15, 17, 20–25, 27, 29, 30, 32–38, 41, 42, 44–49, 51–55, 59–66, 69–120), and 125 reported on severe TBI (8–51, 53–56, 59–77, 79–85, 87–117, 119–138). Sixteen studies included mild with msTBI (8, 9, 13, 15, 20, 29, 30, 33, 34, 73, 74, 77, 84, 99, 101, 111). One study reported only mild and severe TBI, excluding moderate TBI patients (43).
The timing of study assessments after TBI also varied across papers. We classified papers according to 3 timeframes following TBI: acute (<2 weeks), subacute (2 weeks - 1 year) and chronic (>1 year). Most msTBI papers reported on the chronic phase of injury (Figure 4), whereas studies of the subacute phase predominated in studies published 2002–2012 (6). The ability to predict recovery from msTBI remains a clinical conundrum that is of great interest to patients, families, and clinicians. Hence, this shift of focus to chronic msTBI may reflect an interest in better understanding brain abnormalities and prognosis following injury. Clinical outcomes associated with DTI measures are discussed later in this review (Associations of DTI with Patient Outcomes).
Post-injury DTI acquisition. This bar graph denotes when DTI was acquired in the included studies. Studies were only included if there was sufficient information to determine the chronicity of individual patient injuries. Studies may be included in more than one category if they studied patients at multiple timepoints. Thus, the total number of studies represented in this graph exceeds the total of included papers (acute: <2 weeks, Subacute: 2 weeks1 year, hronic: >1 year).
Thirty Three of the 129 (25.6%) papers included in our review evaluated the same group of patients with DTI at multiple time points following injury (9–11, 18, 25, 33, 35–39, 41, 44, 52, 54, 59, 60, 63, 64, 69, 71, 76, 86, 88, 89, 93, 95, 105, 107, 119, 129, 134, 138). As shown in Figure 5, many of these studies were in the subacute-chronic phase post-injury. In comparison, the prior decade found only 13% of studies evaluated patients with DTI at multiple time points (6). Despite the logistical difficulty and costs associated with longitudinal DTI studies, they offer valuable insights into long-term changes in brain pathology and, consequently, patient prognosis.
*Longitudinal studies. A total of 33 studies reported longitudinal data. “N=” represent the number of studies within each grouping. One study examined patients in the acute, subacute, and chronic phases of TBI. Eleven studies examined patients in the subacute to chronic phase, while 6 studies examined patients within the acute to subacute phase. Finally, 2, 7, and 6 studies obtained a DTI scan on the same patient more than once in the acute, subacute, and chronic phases, respectively. Baseline represents the number of studies including a scan prior to injury among longitudinal studies. This number is not added to the total of longitudinal studies. (Acute: <2 weeks, subacute: 2 weeks–1 year, chronic: >1 year).
Most studies utilized cohort study design (82.17%) (8–13, 16, 18–23, 25–30, 32–34, 36–38, 40–44, 46–51, 53–56, 59–62, 64–66, 68, 70, 71, 73–78, 82–84, 86–94, 97–100, 102–106, 108–126, 128, 129, 131–138), followed by case–control (6.98%) (14, 15, 17, 24, 67, 72, 85, 101, 127), randomized controlled (4.65%) (35, 39, 52, 79, 95, 107), cross sectional (4.65%) (31, 45, 80, 81, 96, 130), and before-after (1.55%) (63, 69) study designs. Our classification of study design aims to clarify how studies were conducted by including additional study design descriptors to capture the breadth of literature in this field. The majority of studies from 2002 to 2012 were described as cross-sectional, indicating a single time point at which participants with TBI were studied. Many studies identified msTBI patients in the ED or hospital setting and completed the DTI scan with or without additional clinical assessment at a later date. We considered this a cohort study design, while it would have been considered a cross-sectional design in the previous review. This difference in study design assignment prevents direct comparison of our analyses on the first and second decade. This approach, however, more precisely describes the study designs reported during the second decade. Cohort studies enroll participants with an exposure, in this case TBI, and assess an outcome, in this case DTI or a clinical outcome such as cognitive performance, at a later date. Cohort studies could measure outcomes once and at multiple time points. Cross sectional studies provide a “snapshot” of exposure and outcome at a single moment in time. In msTBI where patients are often hospitalized and require intensive medical and neurologic care during the acute timeframe, outcomes are often measured in the post-acute period.
Control groups were included in 85.27% of studies (8–17, 19–27, 29–34, 36–38, 41, 44, 47–51, 53–56, 59–62, 64–78, 80–89, 91–102, 104–116, 118, 122, 123, 125–138), while 14.73% of studies did not include controls (18, 28, 35, 39, 40, 42, 43, 45, 46, 52, 63, 79, 90, 103, 117, 119–121, 124). One hundred two studies enrolled healthy controls (8–17, 19, 22–26, 31–34, 36–38, 41, 44, 48–51, 53–56, 59–62, 64–67, 69–78, 80–89, 91–98, 100–102, 104–116, 118, 122, 123, 125–138), 9 enrolled orthopedic injury controls (9, 10, 14, 20, 21, 29, 47, 74, 99), and 3 enrolled military controls (27, 29, 30). Studies that did not include a non-TBI control group investigated the association of DTI measures with clinical outcomes among patients with msTBI or stratified the msTBI group by injury, imaging, or outcome features to compare subgroups. Subgroups were based on the presence of symptoms such as weakness (118), comorbid PTSD (27), or chronicity of injury (37).
Data acquisition parameters
3.4
One hundred three studies utilized MR scanners with magnetic field strength of 3.0 T (8, 9, 11–14, 16–20, 22–34, 36–42, 44, 45, 47–56, 63–79, 82–85, 87–89, 91, 92, 94–102, 104–109, 113–117, 120, 122, 123, 125–130, 132, 133, 135, 137, 138), 28 studies used 1.5 T (10, 15, 21, 35, 43, 46, 54, 59–62, 86, 90, 93, 103, 110–112, 118, 119, 121, 123–125, 131, 132, 134, 136), and 2 studies did not report magnetic field strength (80, 81). While there was approximately equal use of 1.5 T and 3.0 T scanners in the previous decade (6), 3.0 T MRI scanners predominate in more recent DTI studies of msTBI, likely due to the increasing availability of higher field strength in clinical and research settings. Greater magnetic field strength provides enhanced signal to noise ratio (SNR), which can be leveraged to shorten acquisition time while enhancing spatial resolution and/or increase the number of diffusion-sensitizing directions, potentially allowing smaller, more subtle microstructural alterations to be detected (139). Although higher magnetic field strength scanners, such as 7.0 T, have become more widely available, no study of msTBI employed field strength greater than 3.0 T.
The b-value is a parameter that reflects the strength and timing of the diffusion-sensitizing gradient magnetic fields, with higher b-values resulting in greater diffusion-related signal effects, but lower SNR (140). Five articles did not report the b-values employed (39, 80, 82, 99, 125). Of the studies that reported b-values, 116 were single-shell studies (using one unique non-zero b-value), with a b-value ranging from 700 s/mm2 to 3,000 s/mm2 (8–15, 17–34, 36–38, 40–51, 53–56, 59–79, 81, 83–87, 90–92, 94–98, 100–115, 117–122, 124–138). There were 8 multi-shell studies (using several unique non-zero b-values) with b-values ranging from 50 s/mm2 to 3,000 s/mm2 (16, 35, 52, 88, 89, 93, 116, 123). Of these multi-shell studies, 1 study used two b-values (16), 3 studies used three b-values (35, 93, 123), 1 study used four b-values (116), 1 study used five b-values (52), and 2 studies used 6 b-values (88, 89). While the majority of studies used a single b-value, multi-shell techniques, which offer potential to more precisely characterize the nature of water diffusion in tissue and its alteration by microstructural features, are gaining popularity, as evidenced by the increasing number of studies employing advanced diffusion methodologies compared to 2002–2012 (6).
The reported number of diffusion-sensitizing directions across studies ranged from 10 to 96 with an average of 36 and a mode of 30 diffusion-sensitizing directions. Eight studies did not report the number of diffusion-sensitizing directions (36, 46, 48, 49, 80, 82, 90, 93). Increasing the number of diffusion-sensitizing directions can increase the accuracy of diffusion scalar and diffusion direction estimates, but at the cost of additional image acquisition time (140, 141). The number of diffusion-sensitizing directions used in included studies has increased compared to the previous decade, in which the range was 6 to 64 with an average value of 27 (6).
With respect to slice thickness, the mean reported value was 2.76 mm (median 2.5 mm, range 1.0–6.0 mm, mode 2.00 mm), with 24 articles not reporting slice thickness (9, 12, 23, 36, 39, 45, 48, 49, 52, 54, 55, 70, 75, 79, 80, 82, 83, 85, 89, 99, 117, 121, 133, 137). As the slice thickness decreases, the axial resolution of the images increases and SNR decreases (140). Studies during the past decade have used, on average, a somewhat thinner slice compared to 2002–2012, affording investigators better axial resolution, which is demonstrated in Figure 6 (2.76 mm compared to 3.08 mm) (6).
Slice thickness. The boxplots show the difference in acquisition slice thickness from the initial decade compared to the most recent decade. Notably decade 1 (2002–2011) includes mild–severe TBI, while decade 2 (2012–2022) only indicates slice thickness for moderate–severe TBI.
When evaluating the use of DTI across studies, it is important to consider the different imaging parameters utilized, including strength of the magnetic field, choice and number of b-values, number of diffusion-sensitizing directions, and choice of slice thickness. Choice of imaging parameters impacts sensitivity of the diffusion measures to detect tissue alterations and can determine the potential to define more detailed features using advanced models such as neurite orientation dispersion density imaging (NODDI). NODDI uses multiple b-values to model the contributions of water diffusion within the extracellular, intracellular, and CSF compartments. Understanding the variation in parameters employed across studies is important for the interpretation of results, assessment of study conclusions, as well as for advancing the field toward standardized and optimized imaging protocols. While there has been increasing emphasis on standardization and reporting of acquisition parameters, we did not observe that studies have converged on common parameters for b-values, slice thickness, or diffusion directions. Despite differences in acquisition parameters, data harmonization across sites and studies is advancing. Initiatives such as the ENIGMA consortium have created protocols to allow for harmonization across sites and scanners in order to create large datasets with greater power for detecting differences and for use in genomics studies (142, 143).
Data analysis methods
3.5
msTBI studies used either a region of interest (ROI) or whole-brain approaches. ROI were either atlas-derived or manually delineated. Twenty-eight studies employed manual ROI delineation (14, 19, 21, 23, 28, 30, 31, 39, 40, 43, 46, 61, 62, 64, 68, 77, 86, 88, 91, 96, 101, 104, 106, 110, 118, 120, 121, 133). Of these, only 6 reported reliability testing of ROI placement (19, 21, 31, 61, 88, 101). Sixty-one studies employed atlas-derived ROIs (8, 9, 11–13, 17, 18, 20, 22, 26, 29, 32, 38, 40, 45, 47, 48, 50, 53, 54, 59, 60, 65, 71, 74–76, 78, 79, 81, 82, 84, 85, 87, 89, 93, 94, 98–100, 102, 103, 105, 107–109, 111–115, 119, 120, 123, 126, 129, 132, 134–137). Of the 68 studies using whole-brain analysis, 66 studies used voxelwise approaches (8–10, 12, 13, 15, 16, 22, 23, 25, 27, 30, 33, 34, 37–39, 41, 42, 44, 48, 49, 51–53, 55, 56, 63, 65–67, 70, 72, 73, 77, 80, 81, 83, 89, 90, 92, 94, 97–100, 102–104, 106, 116, 117, 119, 120, 122, 124, 127, 128, 130–136, 138), and 2 used whole brain, hemispheric, and ROI histogram analysis (24, 92). Four studies used other analysis approaches such as fixel-based analysis and an automated multi-atlas tract extraction (36, 53, 69, 95). Thirty-two studies used a combination of ROI and whole-brain analysis (8, 9, 12, 13, 17, 22, 23, 30, 38, 39, 48, 53, 65, 77, 81, 89, 92, 94, 98–100, 102–104, 106, 119, 120, 132–136). Single subject voxelwise analysis, where abnormal regions are determined separately in each patient, was used in 8.53% of the included msTBI studies (10, 46, 48, 50, 70, 80, 85, 111, 116, 129, 138).
The ROI analysis method entails a priori specification of a region or WM tract of interest, from which diffusion scalar measures are extracted for further analysis (140). The ROI approach allows for hypothesis-driven testing of selected brain areas, perhaps on the basis of functional- or injury mechanism-related factors (140). This approach can be particularly relevant when investigators test for associations of WM microstructure in a specific region with cognitive or behavioral symptoms expected from injury to that brain region. Whole-brain approaches initially consider all brain voxels and identify abnormal diffusion measures in each voxel regardless of region (140). Voxel-based approaches are automated, provide greater spatial resolution, and do not require a priori ROI selection (140). Single subject analysis methods identify abnormalities on a per-subject basis by comparing the individual of interest to a group of controls.
Compared to 2002–2012, a greater proportion of papers in the most recent decade reported voxelwise/Tract-Based Spatial Statistics (TBSS) whole-brain analyses (50.1%) compared to the previous decade (17.0%) (6). However, more studies continue to use ROI analyses compared to voxel-wise analyses, with 19.5% of studies using both ROI and voxelwise methods. Approximately the same proportion of ROI studies (73.9%) and voxel-wise studies (72.7%) reported significant differences in DTI parameters between the groups studied. Even when both ROI and voxel-wise analyses were used within the same study, approximately the same proportion (73.3%) of studies found significant differences between the msTBI group and the control group. Notwithstanding advantages and disadvantages of each analysis method, this review indicates they are similarly likely to detect significant group differences in msTBI.
Diffusion measures studied
3.6
Diffusion MRI is performed to facilitate modeling the diffusion-weighted MRI signal from each image voxel to generate quantitative metrics, including measurements of the degree of anisotropy and dominant direction of diffusion (140). In the DTI model, the diffusion process can be represented as a 3D ellipsoid defined by three vectors (λ1, λ2, λ3). These three vectors can be used to compute scalar summary measurements at each voxel, which include but are not limited to fractional anisotropy (FA), a measure of directional coherence of water; mean diffusivity (MD, also referred to as the apparent diffusion coefficient (ADC)), a measure of total direction-independent diffusion; radial diffusivity (RD), a measure of average diffusion along 2 minor axes of the diffusion ellipsoid; and axial diffusivity (AD), a measure of diffusion along the principal axis of the diffusion ellipsoid (144).
FA was the most commonly studied DTI scalar measurement across all articles (87.6%) (8–16, 18–31, 33, 34, 36–45, 47–49, 51–54, 56, 59–69, 71–78, 80–84, 86, 87, 89–92, 94, 96–107, 109–113, 116–130, 132–138). MD/ADC was the second-most common DTI scalar measurement studied (54.26%) (9–11, 16, 19–24, 26, 27, 29, 30, 31, 34–40, 43, 44, 46–49, 51–54, 63, 64, 67–69, 71, 72, 74–76, 78, 83, 86–89, 91–93, 99, 101, 104, 107, 109, 116, 121, 123–125, 128–130, 132, 134–138) and less commonly studied were RD (28.68%) (9, 14, 22, 24, 26, 27, 29, 30, 33, 36–39, 43, 44, 51, 52, 54, 55, 59, 60, 63, 64, 72, 73, 75, 83, 89, 91, 99, 123, 129, 132–134, 136, 138) and AD (27.13%) (9, 14, 22, 24, 26, 27, 29, 30, 33, 36–38, 43, 44, 51, 52, 54, 59, 60, 63, 64, 72, 73, 75, 83, 89, 91, 99, 123, 129, 132–134, 136, 138). Of the studies that analyzed FA in msTBI, 77/112 (68.8%) reported significant group-wise differences (8–12, 14–16, 19–23, 26, 27, 29, 31, 33, 34, 36, 38, 41, 44, 47–49, 53–55, 59–62, 64–69, 71–75, 77, 78, 80–83, 86, 87, 89, 91, 96, 97, 100–102, 104–107, 109–112, 116, 118, 122, 123, 126, 128, 129, 134, 135, 137). All but one of the 77 (98.7%) studies found lower FA in msTBI compared to the controls. That one study found some brain regions with lower FA and others with higher FA in the TBI group compared to controls (10). The vast majority (36/39) of studies reporting on MD found higher MD in the msTBI group (9, 11, 22, 26, 27, 29, 36–38, 47–49, 51, 53, 54, 64, 67–69, 71, 72, 74, 78, 83, 86, 87, 91, 101, 104, 107, 109, 116, 123, 134, 135, 137). Similarly, 19/20 studies reporting on RD found higher RD in the msTBI group compared to controls (14, 26, 27, 29, 33, 36–38, 44, 51, 54, 55, 59, 72, 73, 83, 91, 107, 123). Findings of studies reporting on AD were mixed with 10/17 studies reporting higher AD in the msTBI group (9, 14, 22, 27, 29, 51, 64, 83, 123, 134) and 5/17 studies reported lower AD (33, 54, 59, 60, 75). In two of the 17 studies, the direction of the group difference was not consistent across all ROIs (44, 91). Rather than a uniform pattern across the brain, patients with TBI showed both increases and decreases in AD compared to controls depending on the region being examined. Lower FA is thought to reflect loss of microstructure elements, such as myelin and axons, as well as glial proliferation (145). These pathologic features similarly lead to elevation of MD, RD, and ADC, due to less restriction of water diffusion within injured tissue (140).
The brain region most commonly found to exhibit significant differences of DTI measures compared to controls was the corpus callosum, with 47 articles reporting significant findings in the corpus callosum among 94 articles that found significant groupwise differences (8, 10, 14, 15, 20, 23, 26, 27, 31, 33, 36–38, 44, 53, 54, 56, 59, 60, 62, 64, 65, 67–69, 71, 73, 74, 77–79, 82, 86, 89, 91, 94, 105, 110–112, 116, 118, 122, 128, 129, 133, 134). Other commonly reported regions included the thalamic radiation, cingulum, inferior fronto-occipital fasciculus, longitudinal fasciculus, and internal capsule. Indices of less restricted diffusion such as lower FA, higher MD, and higher RD in these white matter tracts is consistent with axonal damage and/or demyelination. While these findings are compatible with the proposed pathophysiology of traumatic axonal injury in patients with msTBI, it is important to note that the heterogeneity of planned analyses, reported parameters as well as the white matter tracts evaluated is a potential limitation of the literature and source of selection and publication bias.
Advanced diffusion techniques studied
3.7
Advanced diffusion imaging approaches, such as diffusion-based connectivity, diffusional kurtosis imaging (DKI), and NODDI have been less widely reported in msTBI and are not the main focus of this review. 11.63% of studies (15/129) reported results from advanced neuroimaging techniques (16, 55, 70, 84, 85, 94, 95, 106, 108, 113–116, 126, 136). Diffusion-based connectivity analysis was the most widely used advanced diffusion method (70, 84, 94, 106, 108, 113–115, 126, 136). Diffusion-based connectivity maps neuronal structural connections across brain networks to provide insight into the integrity of structural brain networks and how they are altered by injury. DKI, which characterizes non-gaussian diffusion behavior more accurately than DTI, and NODDI, which models diffusion within the intracellular, extracellular and free water compartments to provide a more precise biophysical characterization of tissue water diffusion, were each reported in a single msTBI study (16, 116). Fewer studies of msTBI (11.63%) employed advanced diffusion techniques compared to mTBI (20.7%) during this decade. These advanced methods were first described at the end of the first decade of reported use of DTI in TBI and therefore their use was not described in the initial review (6). Given that there is less variability in DTI results in msTBI compared to mTBI, there has likely been less interest in employing advanced diffusion methods. Over time as comfort with these new techniques grows, implementation is likely to rise to increase as well.
Associations of DTI with patient outcomes
3.8
Many studies went beyond group comparisons of DTI measures between patients and controls and evaluated associations of DTI measures with msTBI outcomes. Thirty studies investigated associations between clinical outcomes and DTI measures (11, 17, 20, 23, 26, 43, 47, 54, 55, 59, 60, 62, 63, 65, 71, 73, 83, 90, 91, 96, 104, 107, 112, 115, 123, 130, 133, 135, 136, 138). Thirty six studies investigated associations between cognitive tasks and DTI measure (12, 14–16, 19, 22, 27, 29, 31–33, 37, 41, 42, 45, 51, 53, 64, 67–69, 71, 72, 74, 77, 79, 86, 87, 89, 97, 109, 116, 117, 122, 127, 134). There was variability in the timing of patient outcome assessments relative to DTI acquisition. Measures like GCS and post-traumatic amnesia were obtained close to the time of injury. Cognition, global outcomes, and mood/behavior symptoms were often assessed more remote from injury (weeks-years). As above, the most common timing of DTI acquisition was in the chronic phase of injury (>1 year). Table 2 summarizes studies that investigated associations of the most common clinical measures with FA or MD. Clinical measures evaluated included global outcome measures such as the Glasgow Outcome Scale-Extended (GOS-E) and Coma Recovery Scale-Revised (CRS-R). More specific outcome domains included mood (e.g., anxiety, depression), balance, behavior and communication, and symptoms scores. GCS and post-traumatic amnesia represent clinical scales that characterize injury severity. Individual assessment tools varied among studies, however grouping these outcomes by domains allowed us to summarize study findings and draw conclusions despite the heterogeneous range of reported outcome measures. Global outcomes and mood symptoms were the most commonly studied clinical outcome measures. The majority of studies did not find a significant association of FA or MD with global outcome measures or with mood symptoms for msTBI patients. For the 11 studies reporting an association of DTI with global outcomes, the most consistent was for GCS, with higher GCS (less severe injury) associated with higher FA and lower MD (Table 2).
Table 3 summarizes analyses of cognitive performance associations with FA or MD. Individual tests of cognition were grouped by domain to better understand the trends, as a variety of individual tests were used across the various studies. The strongest evidence from studies of cognitive function is for the association of FA with psychomotor speed, including tests of simple reaction time and more complex psychomotor functions. Thirteen out of 18 studies found that lower FA was associated with poorer psychomotor or processing speed. The results for the remaining domains were more mixed. 7/13 studies found that lower FA was associated with poorer memory, with 5 out of the remaining 6 studies finding no association and one study finding lower FA associated with better memory performance. Half of studies that investigated the association between FA and composite cognition scores, reported lower FA was associated with poorer overall cognitive performance. Half of the studies that investigated language (reading, verbal fluency) also found that lower FA was associated with poorer language performance. MD was less commonly investigated, but across domains, when a significant association was identified, higher MD was associated with poorer cognitive function. For overall cognition, attention, executive function, memory, psychomotor speed, IQ, and language, about half of studies in each domain found a significant association of higher MD with poorer cognitive performance, while the other half found no association. A single study reported an association between higher MD and better executive function and psychomotor speed.
Risk of Bias assessment
3.9
Structured risk of bias assessment was completed for each study included in the review, with questions depending on the study design. For the 123 studies categorized as cohort, case–control, or cross-sectional studies, 100% clearly stated the research question or objective. 92.7% (110/123) clearly specified and defined the study population. 89.4% (110/123) of studies selected or recruited subjects from the same or similar populations throughout the study. 99.2% (122/123) of studies clearly defined and implemented valid and reliable exposure measures across study participants. 86.2% (106/123) of studies identified key potential confounding variables and adjusted statistically for their impact. Thus, the overwhelming majority of studies adhered to essential principles of study quality. Identification of and adjustment for confounding variables was the most notable pitfall.
Limitations
3.10
Our review must be considered in the light of several limitations. We have limited our search to English-language peer reviewed original research articles. This search strategy therefore does not encompass gray literature (conference papers, abstracts, etc.) and papers published in languages other than English. However, given our broad search criteria, we believe our search results comprehensively capture the landscape of peer-reviewed literature on DTI in TBI over the decade 2012–2022. We cannot exclude publication bias toward those studies that reported positive results and had larger sample sizes, which are more likely to be submitted and accepted for publication. In classifying the studies by TBI severity, those that did not specify TBI severity or included more than one TBI severity without specifying the sample breakdown by severity were excluded from the review. However, only 11 of the 553 articles did not report TBI severity. These exclusions, therefore, are unlikely to bias our conclusions regarding the msTBI literature over the past decade. Since eight pairs of studies may have overlapping participant enrollment (38, 48, 49, 54, 59–70), some findings may be disproportionately represented. We did not exclude potentially overlapping participants. However, given the limited number of overlapping studies, this is unlikely to significantly impact our overall findings. Finally, due to the broad scope of this review, heterogeneity across studies with respect to factors such as design, acquisition and analysis methods, and result reporting preclude a more quantitative analysis of this literature such as meta-analysis.
Conclusion
4
Since its first decade (2002–2012) of reported use, DTI applications to msTBI have continued to expand in both quantity and scope, including notable increases in the proportions of larger and longitudinal studies, those employing whole brain analyses and those addressing clinical outcomes. The most salient finding across studies remains similar to 2002–2012, that despite heterogeneity of clinical and technical features of the individual studies, lower FA is consistently identified in msTBI patients compared to controls. While there are advantages and disadvantages of analysis methods, whole brain and region of interest approaches had approximately the same rate of significant groupwise findings. Further standardization of reporting and methods for data harmonization hold potential for the pursuit of larger “meta-studies,” with potential to confirm and advance knowledge beyond the power of individual cohorts.
The reference list from the paper itself. Each links out to its DOI / PubMed record.
- 1Dewan MC Rattani A Gupta S Baticulon RE Hung Y-C Punchak M . Estimating the global incidence of traumatic brain injury. J Neurosurg. (2019) 130:1080–97. doi: 10.3171/2017.10.JNS 17352, 29701556 · doi ↗ · pubmed ↗
- 2Centers for Disease Control and Prevention. CDC grand rounds: reducing severe traumatic brain injury in the United States. MMWR Morb Mortal Wkly Rep. (2013) 62:549–52. 23842444 PMC 4604943 · pubmed ↗
- 3Kaplan ZLR Van Der Vlegel M Van Dijck JTJM PisicăD Van Leeuwen N Lingsma HF . Intramural healthcare consumption and costs after traumatic brain injury: a collaborative European Neuro Trauma effectiveness research in traumatic brain injury (CENTER-TBI) study. J Neurotrauma. (2023) 40:2126–45. doi: 10.1089/neu.2022.0429, 37212277 PMC 10541942 · doi ↗ · pubmed ↗
- 4Douglas DB Muldermans JL Wintermark M. Neuroimaging of brain trauma. Curr Opin Neurol. (2018) 31:362–70. doi: 10.1097/WCO.0000000000000567, 29878909 · doi ↗ · pubmed ↗
- 5Shenton ME Hamoda HM Schneiderman JS Bouix S Pasternak O Rathi Y . A review of magnetic resonance imaging and diffusion tensor imaging findings in mild traumatic brain injury. Brain Imaging Behav. (2012) 6:137–92. doi: 10.1007/s 11682-012-9156-5, 22438191 PMC 3803157 · doi ↗ · pubmed ↗
- 6Hulkower MB Poliak DB Rosenbaum SB Zimmerman ME Lipton ML. A decade of DTI in traumatic brain injury: 10 years and 100 articles later. AJNR Am J Neuroradiol. (2013) 34:2064–74. doi: 10.3174/ajnr.a 339523306011 PMC 7964847 · doi ↗ · pubmed ↗
- 7Page MJ Mc Kenzie JE Bossuyt PM Boutron I Hoffmann TC Mulrow CD . The PRISMA 2020 statement: an updated guideline for reporting systematic reviews. Int J Surg. (2021) 88:105906. doi: 10.1136/bmj.n 71, 33789826 · doi ↗ · pubmed ↗
- 8Zane KL Gfeller JD Roskos PT Stout J Buchanan TW Malone TM . Diffusion tensor imaging findings and neuropsychological performance in adults with TBI across the spectrum of severity in the chronic-phase. Brain Inj. (2021) 35:536–46. doi: 10.1080/02699052.2021.1887521, 33593218 · doi ↗ · pubmed ↗