Game load dynamics in basketball: influence of playing position and match progression
Sebastián Feu, Juan Manuel García-Ceberino, Pablo López-Sierra, Sergio José Ibáñez

TL;DR
This study shows how basketball players' physical workload changes during a game and varies by position, helping coaches design better training and substitution strategies.
Contribution
The study introduces a detailed analysis of how playing position and match progression affect internal and external load dynamics in professional basketball.
Findings
External load indicators like total distance and high-intensity actions decrease progressively from the first to later quarters.
Guards perform more high-intensity actions per minute than centers.
High inter-individual variability suggests the need for individualized player monitoring.
Abstract
This study explored the variability of internal and external load in professional basketball as a function of playing position and match quarter. Fourteen ACB League players were monitored across three official games using ultra-wideband tracking and inertial measurement units (113 observations). Linear mixed-effects models assessed the influence of match progression and positional roles on kinematic, neuromuscular, and physiological load variables. External load indicators, specifically total distance covered (p < 0.001; ηp 2 = 0.172), neuromuscular load (p < 0.001; ηp 2 = 0.178), and high-intensity actions (p = 0.038; ηp 2 = 0.030), declined progressively from the first to later quarters, confirming that the opening quarter imposes the highest physical demands. Guards performed more high-intensity actions per minute than centers (p = 0.045; ηp 2 = 0.473). High…
Genes, proteins, chemicals, diseases, species, mutations and cell lines named across the full text — each resolved to its canonical identifier and authoritative record.
Click any figure to enlarge with its caption.
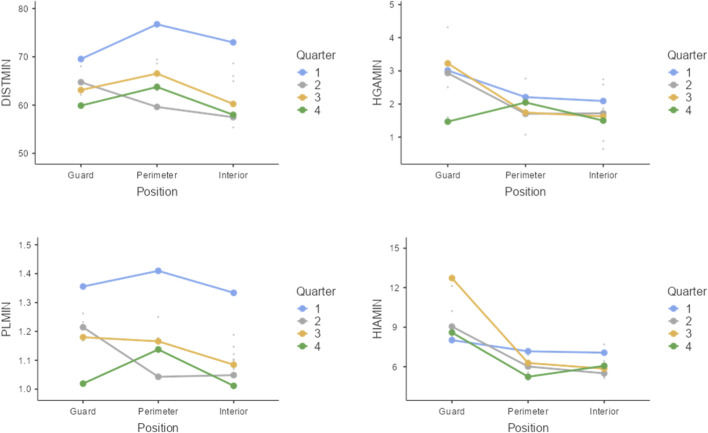 FIGURE 1
| Demand type | Variable | Abbrev. | Description |
|---|---|---|---|
| Kinematic eTL | Distance/min | DIST/MIN | Distance covered in meters per minute |
| High-intensity actions | HIA/MIN | Number of high-demand actions per minute. This is the sum of the following variables: Take offs (>3G), landings (>5G), impacts (>8G), accelerations (>3 m/s2), decelerations (<-3 m/s2), relative sprints (>95% max speed), and relative HSR (>75.5% max speed) | |
| High G actions | HGA/MIN | Actions involving a G-force greater than 8G | |
| Accelerations | ACC+2/MIN | Number of accelerations >2 m/s2 per minute | |
| Decelerations | DEC+2/MIN | Number of decelerations < -2 m/s2 per minute | |
| Acc.-Dec. Difference/min | ACC-DEC/MIN | Mean difference between high accelerations and decelerations (>3 m/s2) per minute | |
| Jumps/min | J+3G/MIN | Number of take-offs and jumps per minute. These involve a flight time >400 m | |
| Landings/min | L+5/MIN | Number of landings per minute | |
| Neuromuscular eTL | Impacts | IMP+8/MIN | Number of impacts per minute, defined as the vector sum of G-forces sustained in the x, y, and z planes |
| Player Load/min | PL/MIN | Vector magnitude derived from triaxial accelerometry data | |
| iTL | Average heart rate | HRAVG | Arithmetic mean of heart rate in beats per minute |
| Max heart rate | HRMAX | Arithmetic mean of the maximum heart rate in beats per minute |
| Skewness | Kurtosis | Shapiro-wilk | ||||||||
|---|---|---|---|---|---|---|---|---|---|---|
| Variable | Position players |
|
|
|
|
|
|
|
|
|
| DIST/MIN | Point guards | 64.992 | 654.25 | 8.092 | −0.537 | 0.550 | 0.129 | 1.063 | 0.965 | 0.726 |
| Perimeter | 66.788 | 660.21 | 11.854 | 0.536 | 0.369 | 2.513 | 0.724 | 0.954 | 0.094 | |
| Interior | 63.149 | 635.63 | 14.495 | −0.244 | 0.322 | 0.580 | 0.634 | 0.986 | 0.762 | |
| HIA/MIN | Point guards | 9.398 | 77.50 | 5.125 | 19.018 | 0.550 | 3.974 | 1.063 | 0.798 | 0.002 |
| Perimeter | 6.182 | 60.57 | 2.389 | 12.808 | 0.369 | 4.158 | 0.724 | 0.907 | 0.003 | |
| Interior | 6.285 | 56.43 | 2.430 | 0.471 | 0.322 | 0.639 | 0.634 | 0.948 | 0.018 | |
| ACC2/MIN | Point guards | 22.318 | 226.21 | 2.326 | 0.423 | 0.550 | −0.392 | 1.063 | 0.938 | 0.297 |
| Perimeter | 20.713 | 198.46 | 5.388 | 32.918 | 0.369 | 12.202 | 0.724 | 0.600 | <0.001 | |
| Interior | 19.908 | 201.18 | 2.978 | −0.861 | 0.322 | 2.036 | 0.634 | 0.960 | 0.062 | |
| DEC2/MIN | Point guards | 22.350 | 220.00 | 2.223 | 0.526 | 0.550 | −0.460 | 1.063 | 0.947 | 0.411 |
| Perimeter | 20.815 | 198.89 | 5.403 | 32.898 | 0.369 | 12.217 | 0.724 | 0.595 | <0.001 | |
| Interior | 19.975 | 202.35 | 2.977 | −0.840 | 0.322 | 2.014 | 0.634 | 0.961 | 0.070 | |
| ACC-DEC/MIN | Point guards | 44.668 | 445.52 | 4.527 | 0.4754 | 0.550 | −0.427 | 1.063 | 0.943 | 0.351 |
| Perimeter | 41.528 | 395.56 | 10.781 | 32.989 | 0.369 | 12.249 | 0.724 | 0.595 | <0.001 | |
| Interior | 39.884 | 403.53 | 5.944 | −0.854 | 0.322 | 2.040 | 0.634 | 0.961 | 0.072 | |
| J3G/MIN | Point guards | 0.180 | 0.12 | 0.172 | 14.421 | 0.550 | 2.797 | 1.063 | 0.871 | 0.023 |
| Perimeter | 0.124 | 0.09 | 0.123 | 0.775 | 0.369 | −0.510 | 0.724 | 0.872 | <0.001 | |
| Interior | 0.164 | 0.14 | 0.135 | 0.968 | 0.322 | 0.836 | 0.634 | 0.922 | 0.002 | |
| L5MIN | Point guards | 0.217 | 0.14 | 0.155 | 0.368 | 0.550 | −1.021 | 1.063 | 0.934 | 0.256 |
| Perimeter | 0.222 | 0.21 | 0.193 | 13.732 | 0.369 | 2.582 | 0.724 | 0.892 | <0.001 | |
| Interior | 0.180 | 0.18 | 0.147 | 0.607 | 0.322 | −0.113 | 0.634 | 0.935 | 0.005 | |
| HGA/MIN | Point guards | 3.032 | 34.44 | 1.354 | −0.251 | 0.550 | −0.988 | 1.063 | 0.945 | 0.387 |
| Perimeter | 1.926 | 18.60 | 1.022 | 0.653 | 0.369 | 0.273 | 0.724 | 0.964 | 0.209 | |
| Interior | 1.746 | 14.29 | 1.178 | 0.704 | 0.322 | −0.337 | 0.634 | 0.931 | 0.004 | |
| IMP8/MIN | Point guards | 1.825 | 20.00 | 0.767 | −0.219 | 0.550 | −1.447 | 1.063 | 0.903 | 0.077 |
| Perimeter | 1.010 | 0.91 | 0.648 | 12.048 | 0.369 | 1.852 | 0.724 | 0.918 | 0.006 | |
| Interior | 1.032 | 0.81 | 0.791 | 0.910 | 0.322 | −0.153 | 0.634 | 0.898 | <0.001 | |
| PL/MIN | Point guards | 1.201 | 11.99 | 0.205 | 0.096 | 0.550 | −1.032 | 1.063 | 0.967 | 0.761 |
| Perimeter | 1.186 | 11.97 | 0.277 | −11.006 | 0.369 | 6.602 | 0.724 | 0.866 | <0.001 | |
| Interior | 1.123 | 10.75 | 0.282 | 0.051 | 0.322 | 1.094 | 0.634 | 0.968 | 0.146 | |
| HRAVG | Point guards | 158.176 | 1.570.00 | 13.616 | 0.704 | 0.550 | −0.541 | 1.063 | 0.904 | 0.080 |
| Perimeter | 153.610 | 1.580.00 | 16.131 | −24.051 | 0.369 | 9.200 | 0.724 | 0.782 | <0.001 | |
| Interior | 146.512 | 1.510.00 | 19.767 | −0.589 | 0.361 | −0.451 | 0.709 | 0.949 | 0.056 | |
| HRMAX | Point guards | 182.647 | 1.820.00 | 9.740 | −0.156 | 0.550 | −0.919 | 1.063 | 0.954 | 0.525 |
| Perimeter | 181.829 | 1.830.00 | 15.274 | −30.693 | 0.369 | 13.256 | 0.724 | 0.693 | <0.001 | |
| Interior | 175.581 | 1.810.00 | 17.637 | −18.456 | 0.361 | 3.719 | 0.709 | 0.805 | <0.001 | |
| Skewness | Kurtosis | Shapiro-wilk | ||||||||
|---|---|---|---|---|---|---|---|---|---|---|
| Variable |
|
|
|
|
|
|
|
|
|
|
| DIST/MIN | 1 | 74.344 | 765.03 | 14.069 | −2.172 | 0.441 | 7.845 | 0.858 | 0.821 | <0.001 |
| 2 | 59.811 | 609.47 | 9.852 | −0.495 | 0.414 | 0.478 | 0.809 | 0.971 | 0.540 | |
| 3 | 63.565 | 660.54 | 10.186 | −0.784 | 0.448 | 0.605 | 0.872 | 0.953 | 0.260 | |
| 4 | 61.712 | 610.10 | 12.066 | 1.747 | 0.456 | 6.396 | 0.887 | 0.857 | 0.002 | |
| HIA/MIN | 1 | 7.330 | 74.42 | 2.556 | −0.851 | 0.441 | 1.763 | 0.858 | 0.915 | 0.027 |
| 2 | 6.344 | 55.66 | 2.488 | 1.717 | 0.414 | 3.838 | 0.809 | 0.851 | <0.001 | |
| 3 | 7.061 | 56.67 | 4.411 | 2.748 | 0.448 | 9.326 | 0.872 | 0.706 | <0.001 | |
| 4 | 6.155 | 56.83 | 2.905 | 2.086 | 0.456 | 6.285 | 0.887 | 0.804 | <0.001 | |
| ACC2/MIN | 1 | 19.343 | 198.73 | 2.808 | −1.797 | 0.441 | 5.070 | 0.858 | 0.866 | 0.002 |
| 2 | 20.483 | 202.56 | 2.509 | 0.525 | 0.414 | 0.455 | 0.809 | 0.975 | 0.642 | |
| 3 | 20.933 | 213.12 | 5.266 | 2.318 | 0.448 | 9.369 | 0.872 | 0.781 | <0.001 | |
| 4 | 21.591 | 203.51 | 4.903 | 3.454 | 0.456 | 14.896 | 0.887 | 0.637 | <0.001 | |
| DEC2/MIN | 1 | 19.278 | 196.64 | 2.742 | −1.919 | 0.441 | 5.634 | 0.858 | 0.850 | <0.001 |
| 2 | 20.590 | 203.49 | 2.467 | 0.378 | 0.414 | 0.609 | 0.809 | 0.980 | 0.804 | |
| 3 | 21.150 | 212.50 | 5.301 | 2.434 | 0.448 | 10.051 | 0.872 | 0.771 | <0.001 | |
| 4 | 21.626 | 205.57 | 4.874 | 3.340 | 0.456 | 14.224 | 0.887 | 0.661 | <0.001 | |
| ACC-DEC/MIN | 1 | 38.621 | 394.83 | 5.539 | −1.870 | 0.441 | 5.398 | 0.858 | 0.856 | 0.001 |
| 2 | 41.074 | 404.83 | 4.951 | 0.470 | 0.414 | 0.564 | 0.809 | 0.979 | 0.770 | |
| 3 | 42.082 | 425.62 | 10.561 | 2.380 | 0.448 | 9.734 | 0.872 | 0.775 | <0.001 | |
| 4 | 43.217 | 409.08 | 9.773 | 3.402 | 0.456 | 14.587 | 0.887 | 0.650 | <0.001 | |
| J3G/MIN | 1 | 0.200 | 0.20 | 0.165 | 0.555 | 0.441 | −0.382 | 0.858 | 0.933 | 0.074 |
| 2 | 0.131 | 0.09 | 0.109 | 0.983 | 0.414 | 0.276 | 0.809 | 0.890 | 0.004 | |
| 3 | 0.147 | 0.12 | 0.146 | 1.825 | 0.448 | 5.143 | 0.872 | 0.830 | <0.001 | |
| 4 | 0.133 | 0.10 | 0.123 | 0.462 | 0.456 | −1.268 | 0.887 | 0.877 | 0.005 | |
| L5/MIN | 1 | 0.230 | 0.18 | 0.189 | 0.438 | 0.441 | −1.034 | 0.858 | 0.913 | 0.024 |
| 2 | 0.196 | 0.21 | 0.134 | 0.232 | 0.414 | −0.750 | 0.809 | 0.958 | 0.237 | |
| 3 | 0.177 | 0.18 | 0.131 | 0.326 | 0.448 | −0.607 | 0.872 | 0.952 | 0.236 | |
| 4 | 0.201 | 0.13 | 0.208 | 1.859 | 0.456 | 4.283 | 0.887 | 0.821 | <0.001 | |
| IMP8/MIN | 1 | 1.366 | 11.51 | 0.940 | 0.344 | 0.441 | −1.268 | 0.858 | 0.928 | 0.054 |
| 2 | 1.091 | 0.91 | 0.691 | 0.760 | 0.414 | −0.166 | 0.809 | 0.934 | 0.049 | |
| 3 | 1.054 | 0.82 | 0.720 | 1.049 | 0.448 | 0.634 | 0.872 | 0.907 | 0.019 | |
| 4 | 1.060 | 0.91 | 0.782 | 0.960 | 0.456 | 0.292 | 0.887 | 0.889 | 0.009 | |
| PL/MIN | 1 | 1.363 | 13.78 | 0.281 | −2.162 | 0.441 | 8.149 | 0.858 | 0.822 | <0.001 |
| 2 | 1.077 | 10.41 | 0.269 | −1.155 | 0.414 | 6.850 | 0.809 | 0.844 | <0.001 | |
| 3 | 1.128 | 11.27 | 0.158 | −0.244 | 0.448 | 1.477 | 0.872 | 0.961 | 0.379 | |
| 4 | 1.066 | 10.01 | 0.247 | 1.318 | 0.456 | 3.637 | 0.887 | 0.898 | 0.014 | |
| HGA/MIN | 1 | 2.359 | 21.67 | 1.408 | 0.179 | 0.441 | −1.308 | 0.858 | 0.937 | 0.091 |
| 2 | 1.936 | 16.89 | 1.134 | 0.526 | 0.414 | −0.354 | 0.809 | 0.967 | 0.412 | |
| 3 | 1.922 | 18.46 | 1.143 | 1.079 | 0.448 | 1.536 | 0.872 | 0.929 | 0.066 | |
| 4 | 1.793 | 17.95 | 1.193 | 0.638 | 0.456 | −0.358 | 0.887 | 0.925 | 0.060 | |
| HRAVG | 1 | 153.800 | 158.00 | 18.014 | −1.341 | 0.464 | 2.316 | 0.902 | 0.872 | 0.005 |
| 2 | 149.897 | 152.00 | 20.944 | −1.401 | 0.434 | 3.039 | 0.845 | 0.886 | 0.005 | |
| 3 | 152.375 | 154.50 | 15.542 | −0.762 | 0.472 | 1.114 | 0.918 | 0.938 | 0.144 | |
| 4 | 149.478 | 151.00 | 16.306 | −0.761 | 0.481 | 0.770 | 0.935 | 0.926 | 0.092 | |
| HRMAX | 1 | 178.120 | 180.000 | 16.097 | −2.190 | 0.464 | 7.644 | 0.902 | 0.810 | <0.001 |
| 2 | 179.379 | 184.000 | 20.365 | −2.566 | 0.434 | 6.821 | 0.845 | 0.679 | <0.001 | |
| 3 | 181.875 | 183.500 | 10.723 | −0.933 | 0.472 | 0.789 | 0.918 | 0.934 | 0.117 | |
| 4 | 177.826 | 179.00 | 13.885 | −1.412 | 0.481 | 2.041 | 0.935 | 0.853 | 0.003 | |
| Variable | Comparison |
|
|
|
|
|
|
|---|---|---|---|---|---|---|---|
| DIST/MIN | Quarter | 6.508 | 3 | 94.0 | <0.001 | 0.304 | <0.001 |
| Position | 0.599 | 2 | 10.9 | 0.567 | |||
| Quarter ✻ position | 0.475 | 6 | 93.0 | 0.826 | |||
| HIA/MIN | Quarter | 1.60 | 3 | 92.82 | 0.194 | 0.063 | <0.001 |
| Position | 4.36 | 2 | 9.70 | 0.045 | |||
| Quarter ✻ position | 1.50 | 6 | 91.76 | 0.188 | |||
| ACC2/MIN | Quarter | 1.167 | 3 | 93.92 | 0.326 | 0.040 | <0.001 |
| Position | 2.081 | 2 | 8.80 | 0.182 | |||
| Quarter ✻ position | 2.219 | 6 | 93.02 | 0.970 | |||
| DEC2/MIN | Quarter | 1.447 | 3 | 94.12 | 0.234 | 0.023 | <0.001 |
| Position | 2.012 | 2 | 9.18 | 0.189 | |||
| Quarter ✻ position | 0.171 | 6 | 93.22 | 0.984 | |||
| ACC-DEC/MIN | Quarter | 1.304 | 3 | 94.03 | 0.278 | 0.047 | <0.001 |
| Position | 2.049 | 2 | 9 | 0.185 | |||
| Quarter ✻ position | 0.194 | 6 | 93.13 | 0.978 | |||
| J3G/MIN | Quarter | 2.632 | 3 | 90.48 | 0.055 | 0.225 | 0.069 |
| Position | 0.784 | 2 | 9.14 | 0.485 | |||
| Quarter ✻ position | 1.292 | 6 | 89.72 | 0.269 | |||
| L5/MIN | Quarter | 0.602 | 3 | 94.5 | 0.615 | 0.589 | 0.006 |
| Position | 0.498 | 2 | 11.6 | 0.620 | |||
| Quarter ✻ position | 0.297 | 6 | 93.6 | 0.937 | |||
| HGA/MIN | Quarter | 0.923 | 3 | 90.9 | 0.038 | 0.16 | 0.01 |
| Position | 0.894 | 2 | 10.2 | 0.439 | |||
| Quarter ✻ position | 1.608 | 6 | 90.4 | 0.154 | |||
| IMP8/MIN | Quarter | 1.928 | 3 | 91.9 | 0.148 | 0.145 | <0.001 |
| Position | 1.608 | 2 | 10.7 | 0.232 | |||
| Quarter ✻ position | 0.794 | 6 | 91.2 | 0.577 | |||
| PL/MIN | Quarter | 6.842 | 3 | 94.6 | <0.001 | 0.199 | <0.001 |
| Position | 0.689 | 2 | 10.4 | 0.523 | |||
| Quarter ✻ position | 0.449 | 6 | 93.7 | 0.844 | |||
| HRAVG | Quarter | 0.522 | 3 | 82.40 | 0.668 | 0.405 | <0.001 |
| Position | 1.075 | 2 | 9.98 | 0.378 | |||
| Quarter ✻ position | 0.546 | 6 | 81.69 | 0.771 | |||
| HRMAX | Quarter | 0.231 | 3 | 82.8 | 0.875 | 0.001 | <0.001 |
| Position | 0.608 | 2 | 11.1 | 0.562 | |||
| Quarter ✻ position | 0.428 | 6 | 82.2 | 0.858 |
| Variable |
|
|
|
|
|
| |
|---|---|---|---|---|---|---|---|
| DIST/MIN | 0.217 | 0.369 | 887.815 | 869.778 | 0.194 | 6.93 ** | |
| HIA/MIN | 0.205 | 0.393 | 572.692 | 587.862 | 0.237 | 8.02 ** | |
| ACC2/MIN | 0.088 | 0.118 | 650.353 | 658.973 | 0.033 | 0.265 | |
| DEC2/MIN | 0.091 | 0.127 | 649.832 | 658.423 | 0.039 | 0.382 | |
| ACC-DEC/MIN | 0.099 | 0.123 | 806.468 | 798.464 | 0.036 | 0.324 | |
| J+3G/MIN | 0.018 | 0.543 | −140.957 | 51.412 | 0.488 | 26.8 *** | |
| L+5/MIN | 0.043 | 0.228 | −70.988 | 12.788 | 0.193 | 8.72 ** | |
| HGA/MIN | 0.115 | 0.660 | 321.953 | 361.596 | 0.615 | 47.8 *** | |
| IMP+8/MIN | 0.130 | 0.572 | 231.598 | 281.445 | 0.508 | 39.0 *** | |
| PL/MIN | 0.220 | 0.278 | 20.688 | 95.694 | 0.074 | 1.35 | 0.244 |
| HRAVG/MIN | 0.086 | 0.317 | 874.965 | 844.656 | 0.253 | 10.3 ** | |
| HRMAX/MIN | 0.061 | 0.336 | 848.497 | 821.086 | 0.293 | 15.4 *** |
- —Consejería de Educación y Empleo, Junta de Extremadura10.13039/501100008432
- —Ministerio de Ciencia, Innovación y Universidades10.13039/100014440
Peer Reviews
No public reviews on file for this paper yet. If you reviewed it on a platform where reviews are public (OpenReview, ICLR, NeurIPS, ICML), you can paste yours below so the community can read it here.
Videos
No videos yet. Explain this paper in a talk, walkthrough, or lecture? Add one.
Taxonomy
TopicsSports Performance and Training · Knee injuries and reconstruction techniques · Sport Psychology and Performance
Introduction
1
Load monitoring and analysis, both during training and competition, has become a key component of preparation in high-performance sports (Feu et al., 2023; García et al., 2022). In intermittent sports such as basketball, where physical demands vary considerably and depend on multiple contextual factors (López-Sierra et al., 2025; Sansone et al., 2021), understanding the load borne by each player is crucial for adequately planning sessions, facilitating effective recovery, and reducing the risk of injuries associated with excessive or poorly distributed loads (Fox et al., 2017). To achieve this, it is not only necessary to have evidence regarding the average values recorded during competition (Conte et al., 2022), but also about the peak demand scenarios that players face throughout the games (García et al., 2022).
The monitoring and quantification of the intensity to which players are exposed, commonly referred to as load demands, is one of the most important aspects of training and competition management (Staunton et al., 2022; Scanlan et al., 2014; García-Cuevas et al., 2025). An effective approach to this analysis involves differentiating between external and internal load. External load (eTL) refers to the physical stimuli imposed on the player and can be measured objectively using technologies such as accelerometers, positioning systems, or GPS tracking devices (e.g., total distance covered, number of sprints, or accelerations (Gómez-Carmona et al., 2020). These measurements are particularly relevant given that basketball is a contact sport characterized by frequent accelerations and decelerations (Wellm et al., 2024). Conversely, internal load (iTL) refers to the individual’s physiological or perceptual response to those stimuli, which can be assessed using indicators such as heart rate or rating of perceived exertion (Scanlan et al., 2014; Gómez-Carmona et al., 2020). The complementary use of both perspectives allows for a more accurate and context-specific understanding of the actual effort sustained by the athlete.
In the competitive context, this analysis becomes even more relevant. The demands of actual gameplay often differ substantially from those encountered in training, not only in terms of intensity and duration but also in tactical complexity (Feu et al., 2023). Therefore, monitoring load during official matches serves not only to verify whether training appropriately reflects the demands of competition but also to assess whether load is adequately individualized. Furthermore, being a team sport, basketball load can be influenced by factors such as the opponent, the phase of the match, or the player’s tactical role, highlighting the need for detailed and context-aware monitoring. Load demands may vary depending on the game quarter (Miró et al., 2024; García et al., 2020; Salazar et al., 2024; Pérez-Chao et al., 2022; Fox et al., 2021).
Accordingly, conducting inferential analyses that account for players’ specific positions becomes essential. Not all roles within the game involve the same physical demands (Vázquez-Guerrero et al., 2018; Sanchez-Castillo and Pons, 2022; Stojanovic et al., 2018; Svilar et al., 2018). For instance, point guards typically accumulate more high-speed actions, changes of direction, and short-distance movements, whereas centers are often subject to increased physical contact, isometric efforts, and strength-based actions near the basket (Miró et al., 2024; Ibanez et al., 2024). Ignoring such differences can lead to inaccurate interpretations or suboptimal training plans that do not reflect the actual needs of each player profile. Position-specific statistical analysis allows for the identification of significant differences between roles, enabling more precise planning aligned with the specific demands of the game.
Ultimately, integrating both iTL and eTL analysis within the competitive context, while also considering positional differences, supports more informed decision-making in physical preparation. This approach not only enhances performance but also contributes to more effective load management across the season, with the aim of preserving athlete health and sustaining long-term performance (Sánchez et al., 2019; Tuttle et al., 2024). The aim of this study was to analyze the variables that determine physical exercise demands in professional basketball, considering both the context of measurement (i.e., the game quarter during official competition) and the specific playing position of each athlete.
Materials and methods
2
Study design
2.1
An associative methodological strategy was adopted, with a comparative and cross-sectional design (Ato et al., 2013). The study was conducted in the natural sports environment, with no intervention by the research team in the development conditions, following an ex post facto analysis approach (Montero and León, 2007).
Participants and sample
2.2
Fourteen professional players from the Spanish first division basketball league were monitored during three competitive microcycles in the 2022–2023 season. The sample consisted of each player’s participation in each quarter of the competition. A total of 113 records were analyzed from three official matches. Thirty-two variables were collected, resulting in a data matrix of 3,616 cases. Research examining coaches’ behaviors in team-sport settings frequently relies on relatively small samples. Nevertheless, this does not diminish the validity of the knowledge produced or its capacity to contribute meaningfully to the scientific community. In this context, our study aligns with the criteria proposed by Lago et al. (2020) for generating robust scientific evidence: (1) supplementing traditional significance testing with magnitude-based metrics (such as effect sizes); (2) increasing the number of observations whenever feasible; and (3) striving to develop explanatory principles of players’ behavior based on Merton’s middle-range theory.
Variables
2.3
From the total variables collected in the study, Table 1 includes the iTL and eTL variables, considered as dependent variables. All variables were normalized per minute.
Intensity-related metrics were derived using two complementary approaches. First, the High-Intensity Actions (HIA) variable integrated several mechanically demanding events automatically detected by the WIMU-PRO system, including take-offs (>3G), landings (>5G), high-intensity impacts (>8G), accelerations and decelerations above the device-defined thresholds, and speed-based actions. High-speed running (HSR) was identified when players exceeded 75.5% of their individual maximal in-game speed, while sprinting was defined as movement above 95% of maximal speed. All HIA events were subsequently normalised per minute of effective playing time to quantify the frequency of high-demand actions.
Second, accelerations and decelerations were also examined as independent kinematic variables. These were defined as the number of occurrences exceeding a fixed threshold of ±2 m s^-2^. As count-based measures, no minimum dwell time was required, and events were detected at the device’s 100 Hz sampling frequency. This threshold enables the identification of meaningful changes in speed within the movement patterns typical of basketball play.
For statistical analysis, specific positions were recoded into three groups: point guards, perimeter players (shooting guards, small forwards), and interior players (power forwards, centers).
Instruments
2.4
Data collection took place in indoor facilities using IMU technology with ultra-wideband (UWB) tracking at 100 Hz, to record distances covered at various speeds, as well as accelerations and decelerations. This monitoring system has shown high reliability and validity for indoor data collection (Bastida-Castillo et al., 2019). Eight portable radiofrequency antennas were installed and interconnected following the same protocol used in similar studies (Reina et al., 2022; Ibáñez et al., 2023). In that way, prior to the data-collection, inter-device reliability was assessed by walking the perimeter of the court while carrying two WIMU-PRO units attached together. This procedure ensured optimal signal quality and confirmed that both units recorded data consistently at the expected sampling frequency (100 Hz). After data extraction, the inter-device distance was examined using rolling averages calculated along the entire perimeter trajectory. A mean absolute error below 7 cm was required to verify minimal measurement error across the playing surface. When deviations greater than 7 cm were detected, the antenna configuration was reassembled and the validation protocol repeated until optimal reliability was achieved.
Each athlete was equipped with a GARMINTM heart rate pectoral band (Garmin Ltd., Olathe, KS, United States), and a WIMU-PROTM inertial device. The heart rate band was synchronized to the inertial unit via ANT + protocol. Data were collected using S-PROTM software (RealTrack Systems, Almería, Spain; now part of Hudl, United States) and later exported to statistical software for analysis.
To measure impacts, accelerations, decelerations, jumps, and landings, the inertial device incorporated several microsensors (four accelerometers: two 16 g, one 32 g, and one 400 g; three gyroscopes: 2000°/s; and one magnetometer). These microsensors operated at 100 Hz and demonstrated near-perfect validity for raw accelerometer data. Heart rate was recorded simultaneously using a chest-strap sensor operating at 1 Hz, with values expressed in beats per minute.
Procedure
2.5
The technical directors of the participating clubs were contacted and informed about the study’s objectives and invited to participate. Upon agreement, the rest of the coaching staff and players were informed. Ethical approval was obtained from the University Bioethics Committee (do not fill in the initial submission, do not delete in the initial submission). The study adhered to the ethical standards of the 1975 Declaration of Helsinki (as revised in later years) (Harriss and Atkinson, 2015), and to the Spanish Organic Law 3/2018, of December 5, on the Protection of Personal Data and Guarantee of Digital Rights (BOE, 294, 06/12/2018).
Before each game, eight portable antennas were installed around the court in an octagonal configuration, placed at a height of 3 m. Sixty minutes prior to tip-off, players were fitted with a tight anatomical vest positioned at the scapular level (T2–T4), into which the WIMU-PROTM device was inserted. A heart rate band was placed underneath. During competition, the S-VIVOTM software (RealTrack Systems, Almería, Spain; now part of Hudl, United States of America) was used to mark the active competition periods (start and end of each quarter). Data were not collected during inactive moments (e.g., breaks, time-outs, bench time), in order to prevent them from skewing the results.
After each match, data were downloaded to a laptop and processed using the manufacturer’s S-PROTM software to extract iTL and eTL variables. An individual performance report was generated after each training session and official game and shared with the technical staff, detailing relevant data for each athlete.
Statistical analysis
2.6
Descriptive statistics including mean, median, and standard deviation were calculated to characterize the load variables. Data normality was assessed using the Kolmogorov-Smirnov test (Field, 2013). Load analyses were conducted using linear mixed-effects models, with the player ID as the random factor and position and game quarter as fixed effects. Model fit was evaluated using AIC/BIC values and marginal and conditional R ^ 2 ^. Intraclass correlation coefficients (ICC) and their significance were calculated to determine whether the random subject effect was relevant. Bonferroni post hoc tests were used for pairwise comparisons of fixed effects. All analyses were performed using JAMOVI software.
Effect sizes were reported using partial eta squared (partial η ^ 2 ^), which quantifies the proportion of variance explained by each effect while excluding variance from other sources. The interpretation thresholds were: ∼0.01 for small effect, ∼0.06 for medium effect, and ∼0.14 for large effect.
Results
3
Table 2 presents the descriptive statistics of the load variables according to player position.
In Table 3, the descriptive statistics of the load variables are presented according to the game quarter.
Across game quarters, the descriptive results indicate relatively stable patterns for both kinematic and neuromuscular variables, with Q1 generally presenting the highest values of the match. Total distance per minute, high-intensity actions, accelerations and decelerations above 2 m s^-2^, jumps and landings over 3G and 5G, impacts per minute, and Player Load per minute all showed their greatest magnitudes in Q1, followed by a moderate reduction in Q2 and Q3 and, in some cases, a partial recovery in Q4. Internal load indicators exhibited a similar pattern, with both average and maximum heart rate reaching slightly higher values in Q1. Overall, these findings suggest that players begin the game with comparatively elevated mechanical and physiological outputs, after which workload stabilizes at slightly lower levels for the remainder of the match.
Table 4 shows that there were significant differences between quarters for the variables DIST/MIN (F = 6.508; p < 0.001; partial η ^ 2 ^ = 0.172; large effect), PL/MIN (F = 6.842; p < 0.001; partial η ^ 2 ^ = 0.178; large effect), and HGA/MIN (F = 0.923; p = 0.038; partial η ^ 2 ^ = 0.030; small effect). No significant differences were observed across quarters for the variables HIA/MIN, ACC2/MIN, DEC2/MIN, ACC-DEC/MIN, J3G/MIN, L5/MIN, IMP8/MIN, HRAVG/MIN, and HRMAX/MIN (p > 0.05). However, HIA/MIN did show a significant difference by playing position (F = 4.36; p = 0.045; partial η ^ 2 ^ = 0.473; large effect).
Post hoc analyses using Bonferroni correction (Figure 1) revealed significant differences in DIST/MIN between Q1 and Q2 (t = 3.98; p < 0.001), Q1 and Q3 (t = 2.91; p = 0.027), and Q1 and Q4 (t = 3.57; p = 0.003). For the HGA/MIN variable, values were significantly higher in Q1 compared to Q4 (t = 2.91; p = 0.027). For PL/MIN, significant differences were found between Q1 and Q2 (t = 3.80; p = 0.002), Q1 and Q3 (t = 2.99; p = 0.021), and Q1 and Q4 (t = 3.99; p < 0.001), with no significant differences observed by position. For the HIA/MIN variable, significant differences were found between guards and centers/power forwards (t = 2.75; p = 0.047).
Effects plots. Note: Random effects are plotted by players.
Table 5 presents the results of the random effect control for each load variable considering the game quarter and the player’s specific position. When the conditional R ^ 2 ^ is significantly greater than the marginal R ^ 2 ^, this indicates that random effects contribute valuable information, thus justifying the use of a mixed-effects model. In the case of variables such as IMP+8/MIN (0.130 vs. 0.572), HGA/MIN (0.115 vs. 0.660), HRAVG/MIN (0.317 vs. 0.086), and HRMAX/MIN (0.336 vs. 0.061), a strong contribution from random effects is observed.
The ICC measures the proportion of total variance attributable to random effects; an ICC ≥ 0.1 suggests that random effects (e.g., the player) should be modeled. The ICC values for IMP+8/MIN (0.508) and HRMAX/MIN (0.293) indicated a strong influence of the individual player. This effect was even more pronounced for HGA/MIN (0.615), revealing that over 60% of the variance is due to individual differences, highlighting the necessity of using a mixed model. In contrast, ACC2/MIN and DEC2/MIN showed poor model fit, with non-significant low R ^ 2 ^ values indicating that linear mixed models was of limited usefulness for these variables.
Discussion
4
The present study aimed to analyze iTL and eTL according to the quarter of the game and the specific playing position of basketball players in real competitive contexts at the professional level. The results confirmed significant variations in certain eTL variables throughout the game, with the first quarter imposing the greatest physical demands. Additionally, relevant differences were identified based on specific playing positions in the variable HIA/MIN, highlighting the necessity to tailor load according to the player’s role. The use of linear mixed models further revealed that a substantial proportion of the variance is attributable to individual factors, thus justifying the appropriateness of this statistical approach. Together, these findings reinforce the importance of individualized and contextualized load monitoring to optimize performance and reduce injury risk (Pernigoni et al., 2021).
Analyzing competition load in real contexts provides essential insights for understanding the physical and physiological demands of professional basketball (Russell et al., 2021). Our findings show that players experienced significant iTL and eTL during official matches, consistent with previous research emphasizing basketball’s high demands in terms of high-intensity actions, repeated impacts, and cardiovascular requirements (Feu et al., 2023), as well as PL/min (Alonso et al., 2023; Pernigoni et al., 2021). Basketball is an intermittent sport in which players alternate prolonged periods of low intensity with intervals of very high intensity (Ibáñez et al., 2023). The fact that average values during competition are so high implies that the worst-case scenarios represent extreme physical demands faced by players (Vázquez-Guerrero and Garcia, 2021). Players must be prepared to transition from very low-intensity situations, such as a stoppage for free throws where they are practically stationary, to very intense moments involving high speed and large accelerations. Strength and conditioning coaches must prepare players during training to optimize their capacity to perform intermittently. These findings highlight the importance of exposing players to training tasks that alternate between prolonged low-intensity phases and abrupt transitions to maximal actions, replicating the oscillatory demands observed in competition. Incorporating drills that combine controlled pacing with sudden accelerations, impacts, and high-speed efforts may help players better tolerate the rapid shifts in intensity characteristic of elite match play.
Regarding load variation by game quarter, significant differences were observed in variables such as distance per minute (DIST/MIN), neuromuscular load (PL/MIN), and high-intensity accelerations (HGA/MIN), with a decreasing trend as the game progressed (Pérez-Chao et al., 2022; Salazar et al., 2024). Understanding the evolution of kinematic and neuromuscular load is essential for implementing strategies to enhance performance and prevent injuries (Ibáñez et al., 2023). Evidently, the first quarter tends to be the most demanding in terms of iTL, with important implications for physical preparation and effort management during competition (Garcia et al., 2022). Several studies have reported higher intensity during the first quarter compared to the last, both in players (García et al., 2020; Garcia et al., 2022; Vazquez-Guerrero et al., 2019; Salazar et al., 2024) and referees (Garcia-Santos et al., 2019). This may be due to factors such as the use of all available timeouts in the last quarter, a higher number of fouls, shorter possession times, and greater fatigue. The magnitude of loads recorded during competition and the differences found depending on the quarter underscore the importance of evaluating not only the total workload of the match but also the quality and intensity at different moments, and even by specific playing position, especially in elite competitions such as the ACB League. From an applied perspective, these patterns suggest that early-game periods may require greater physical readiness and neuromuscular freshness, reinforcing the need to design warm-up protocols and initial rotation strategies that anticipate the heightened demands of the first quarter. Additionally, conditioning programs may benefit from incorporating quarter-specific drills that simulate the progressive reduction in intensity across the game, helping players optimize pacing behaviours and sustain performance under accumulated fatigue.
One possible explanation for the lower eTL observed in professional players, as reflected by reduced HIA/MIN, DIST/min, HGA/MIN, and PL/min, as quarters progress may be an increase in fatigue (Salazar et al., 2024). These authors emphasized that this decrease may be independent of the level of competition, suggesting the need for further studies to objectively determine the causes of this performance decline and/or strategies to minimize it. Conversely, managing the load during the match and for each player, as well as considering the influence of game pace across different periods, constitutes a key decision for coaches who must ensure that the most suitable players are on the court during critical moments of the final quarter, enabling them to achieve higher performance peaks (Pérez-Chao et al., 2021).
Regarding analysis by playing position, significant differences were found in the variable HIA/MIN, demonstrating that high-intensity physical demands vary according to the player’s tactical role (Ibanez et al., 2024; Ferioli et al., 2020). Other studies with professional players have identified differences in multiple eTL and iTL variables depending on position (Gamonales et al., 2023; Puente et al., 2017; Vázquez-Guerrero et al., 2018). For example, Vázquez-Guerrero et al. (2018) found differences in accelerations and decelerations by position, with lower values for perimeter players compared to interior players. Point guards are generally involved in a greater number of explosive actions and short displacements, while centers experience more impacts and perform more eccentric and contact efforts to maintain position and during screens (Stojanovic et al., 2018). High-intensity physical demands vary according to the player’s specific position, reflecting differences in actions such as accelerations, movements, and impacts, which highlights the need for individualized training based on tactical roles. Therefore, strength and conditioning coaches should design specific loads and tasks tailored to the particular demands of each playing position. These positional distinctions reinforce the importance of prescribing conditioning loads that mirror the dominant movement patterns and mechanical stresses associated with each role. Integrating position-specific drills, such as repeated accelerations for guards or high-impact and contact-tolerance tasks for centers, may enhance the specificity and effectiveness of physical preparation throughout the competitive season.
No differences in iTL (HRAVG/MIN and HRMAX/MIN) were found in the present study; however, previous research, such as Puente et al. (2017), reported lower physiological demands in centers compared to guards and forwards. In general, perimeter players tend to cover greater distances and execute actions at higher speeds (Ponce Bordón et al., 2021; Martinho et al., 2025). Overlooking these positional differences may result in suboptimal training design and inappropriate load distribution, especially when a uniform training approach is applied to a heterogeneous group of athletes (Martinho et al., 2025). Although this study did not observe significant differences in iTL, existing evidence suggests that guards and forwards typically experience higher physiological demands than centers. Therefore, implementing a homogeneous training plan may be ineffective, and it is recommended that training loads be adjusted according to the specific demands and characteristics of each playing position. From an applied standpoint, the absence of positional differences in iTL in the present sample does not preclude the need for individualized cardiovascular conditioning, particularly given the consistent evidence showing higher physiological demands for perimeter players. Incorporating role-specific aerobic and anaerobic conditioning profiles may therefore help ensure that each position receives an appropriate stimulus aligned with its typical match demands.
The use of linear mixed models allowed joint evaluation of the effects of game quarter, specific position, and individual (random) player effects. The difference between marginal and conditional R ^ 2 ^ in variables such as IMP+8/MIN, HGA/MIN, and HRAVG/MIN fully justifies this modeling approach, evidencing that a substantial portion of the variance is due to individual factors not explained by fixed effects. Moreover, high ICC values (>0.25) in these variables indicated strong player dependency, reinforcing the need to individualize load even within the same position or game situation. This statistical approach aligns with current methodological recommendations for load analysis in invasion sports (Iannaccone et al., 2021). The ICC values reflected the influence of innate individual differences on the monitored load variables. Metrics such as high-intensity jumps, actions involving elevated G-forces, and impacts exceeding 8G showed differences, of which at least 50% can be attributed to inter-individual variability. Similar patterns of neuromuscular load differences between athletes have also been observed in other sports, such as handball (Antúnez et al., 2024). It is essential to account for individual differences when planning training sessions, identifying which physical components can be addressed collectively during on-court team practice, and which should be targeted through individualized sessions with the strength and conditioning coach. These results highlight the relevance of monitoring load at the individual level rather than relying solely on group averages, as players with similar roles may respond very differently to identical stimuli. In practice, integrating individualized thresholds, personalized recovery strategies, and athlete-specific conditioning prescriptions may improve the effectiveness of load management throughout the competitive microcycle.
In summary, this study contributes to the understanding of the distribution and variability of competition load in professional basketball, highlighting the influence of the game quarter. Only one load variable showed differences by specific position, indicating the need for further research to consider contextual aspects of competition (preseason, tournaments, playoffs) and the game (offense, defense, winning vs. losing, match balance, playing time) (Garcia et al., 2022; Miró et al., 2024; Sansone et al., 2025; Scanlan et al., 2025). The results reinforce the necessity of individualized contextualized load monitoring, especially in official competitions, considering both the moment of the game and player-specific characteristics to optimize performance and reduce injury risk.
Limitations
4.1
This study has several limitations. First, the sample size was small, as it was restricted to three games, and the analysis did not account for more specific tactical roles. Additionally, the study did not examine the mechanisms that may explain variations in load (e.g., fatigue accumulation or tactical adjustments). It should also be noted that no contextual variables, such as score differential, game outcome, opponent quality, or playing venue; were incorporated into the analysis, despite their potential influence on external and internal load patterns. Future research should address these limitations by increasing the sample size, including a greater number of teams, considering competitive and contextual variables, exploring the relationship between load and technical–tactical performance, and incorporating subjective perceptions of effort alongside physiological measures.
Practical applications
4.2
The results indicate that the highest physical demands occur at the beginning of the game; however, from an applied standpoint, it is essential that players are prepared not only to perform effectively in the first quarter but also to repeatedly execute high-intensity actions throughout the entire game, particularly in the final minutes, when accumulated fatigue often constrains performance. In this regard, coaches are encouraged to include training tasks that develop the ability to sustain repeated efforts under fatigue, using small-sided games, interval-based drills with incomplete recovery, and targeted blocks placed at the end of training sessions to simulate decision-making and technical execution under fatigue.
Furthermore, the positional differences and high inter-individual variability observed highlight the need for training programs tailored to the specific profile of each player. Guards may benefit from tasks that involve frequent accelerations, changes of direction, and repeated transition actions, whereas forwards and centers require an emphasis on eccentric strength, physical contact, and repeated interior actions performed under fatigue. Integrating these positional needs with the temporal evolution of game demands supports more precise preparation and enhances players’ ability to maintain performance across all phases of competition.
In terms of load management across congested competition schedules, the present findings suggest that coaches should adjust training volume and intensity according to the temporal distribution of match demands. During weeks with two or more games, sessions should prioritize technical–tactical content while reducing the volume of high-impact and high-acceleration actions, as these represent the most fatiguing neuromuscular components identified in competition. Monitoring variables such as impacts/min and PlayerLoad/min on a daily basis can help practitioners detect residual fatigue and adapt microcycle structure, ensuring that players arrive fresh for high-demand periods such as the first quarter and the closing minutes of games.
These results may also assist in designing evidence-based substitution strategies. Since the first quarter concentrates the highest physical outputs and the final quarter reflects performance under accumulated fatigue, coaches may benefit from planning rotations that preserve key players’ ability to perform high-intensity actions late in the match. Substitution timing can be optimized by monitoring individual in-game load trends, particularly in players with higher accelerometry-based loads or greater susceptibility to fatigue. Implementing individualized thresholds for in-game monitoring, whether through live Player Load, impact counts, or high-acceleration events, can support real-time decision-making and help prevent performance decrement or excessive neuromuscular stress.
Conclusion
5
This study shows that the physical demands of professional basketball fluctuate markedly across the quarters of play, with the opening quarter consistently imposing the greatest external and neuromuscular loads. Positional differences were most evident in the frequency of high-intensity actions, particularly among point guards compared with centers. The application of linear mixed-effects models highlighted substantial inter-individual variability, underscoring that load behavior cannot be fully explained by group factors alone. These findings emphasize the importance of individualized and context-specific monitoring to capture the true dynamics of competition. Future research should extend this work by examining larger samples, incorporating contextual variables such as match status and tactical phases, and exploring how physical load interacts with technical and tactical performance indicators.
The reference list from the paper itself. Each links out to its DOI / PubMed record.
- 1Alonso E. Trapero J. Ribas C. Sosa C. Gómez M. A. Lorenzo A. (2023). External peak demands are not affected by playing venue (home vs away) during official male basketball games. Int. J. Perform. Analysis Sport 23, 334–342. 10.1080/24748668.2023.2238164 · doi ↗
- 2Antúnez A. López-Sierra P. Vila-Suárez H. Ibáñez S. J. (2024). Neuromuscular load in professional women's handball: segmentation of the player load and the Impacts at group and individual level. Sensors 24 (17), 5750. 10.3390/s 24175750 39275660 PMC 11398247 · doi ↗ · pubmed ↗
- 3Ato M. López J. J. Benavente A. (2013). A classification system for research designs in psychology. An. Psicol. 29, 1038–1059. 10.6018/analesps.29.3.178511 · doi ↗
- 4Bastida-Castillo A. Gómez-Carmona C. D. De la Cruz-Sánchez E. Reche-Royo X. Ibáñez S. J. Pino-Ortega J. (2019). Accuracy and inter-unit reliability of ultra-wide-band tracking system in indoor exercise. Appl. Sci. 9 (5), 939. 10.3390/app 9050939 · doi ↗
- 5Conte D. Palumbo F. Guidotti F. Matulaitis K. Capranica L. Tessitore A. (2022). Investigating external and internal loads in Male older adult basketball players during official games. J. Funct. Morphol. Kinesiol. 7, 111. 10.3390/jfmk 7040111 36547657 PMC 9782224 · doi ↗ · pubmed ↗
- 6Ferioli D. Rampinini E. Martin M. Rucco D. Torre A. Petway A. (2020). Influence of ball possession and playing position on the physical demands encountered during professional basketball games. Biol. Sport 37, 269–276. 10.5114/biolsport.2020.95638 32879549 PMC 7433335 · doi ↗ · pubmed ↗
- 7Feu S. García-Ceberino J. M. López-Sierra P. Ibáñez S. J. (2023). Training to compete: are basketball training loads similar to competition achieved? Appl. Sci. 13 (22), 12512. 10.3390/app 132212512 · doi ↗
- 8Field A. (2013). Discovering statistics using SPSS. London: Sage Publications.