HS6ST1 regulates acute myeloid leukemia chemotherapy resistance via TGF-β1 signaling
Christina Termini, Kelsey Woodruff, Diya Patel, Jack Peplinski, Nicollette Setiawan, Matthew Hagen, Soheil Meshinchi

TL;DR
This study shows that HS6ST1 helps AML cancer cells resist chemotherapy by boosting TGF-β1 signaling, which could lead to new treatment strategies.
Contribution
The novel finding is that HS6ST1 promotes chemotherapy resistance in AML through TGF-β1 signaling, offering a new therapeutic target.
Findings
High HS6ST1 expression in AML patients with KMT2A-rearrangements correlates with worse survival and higher relapse risk.
HS6ST1 depletion increases AML cell sensitivity to cytarabine and reduces TGF-β1 signaling.
Blocking heparan sulfate with surfen enhances cytarabine's effectiveness in killing AML cells.
Abstract
Despite therapeutic advances, relapse remains the leading cause of death in patients with acute myeloid leukemia (AML). Growth factor signaling controls AML survival, proliferation, relapse, and chemotherapy resistance. Here, we studied heparan sulfate proteoglycans, a class of molecules that bind growth factors via their heparan sulfate chains to change their signaling ability. Heparan sulfate-growth factor interactions are controlled by the addition of sulfate groups catalyzed by heparan sulfotransferases, such as those encoded by HS2ST1 and HS6ST1. Using AML patient cohort analyses, we demonstrate that increased HS6ST1 expression is associated with worse survival and increased relapse risk for AML patients harboring KMT2A-rearrangements. Using cell line derived xenografts, we show that AML cells depleted of HS2ST1, but not HS6ST1, have increased bone marrow leukemic burden. Further,…
Genes, proteins, chemicals, diseases, species, mutations and cell lines named across the full text — each resolved to its canonical identifier and authoritative record.
Click any figure to enlarge with its caption.
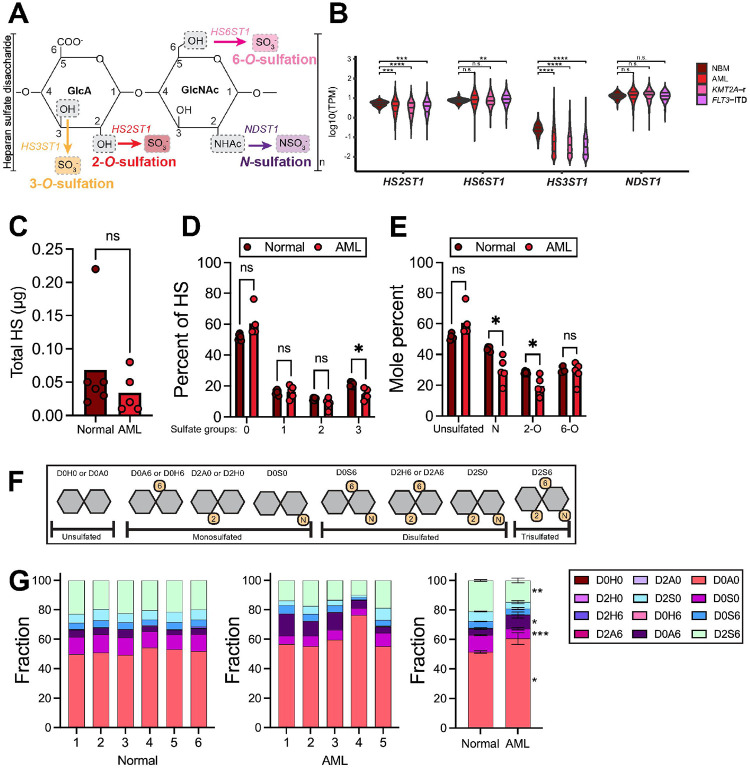 Figure 1
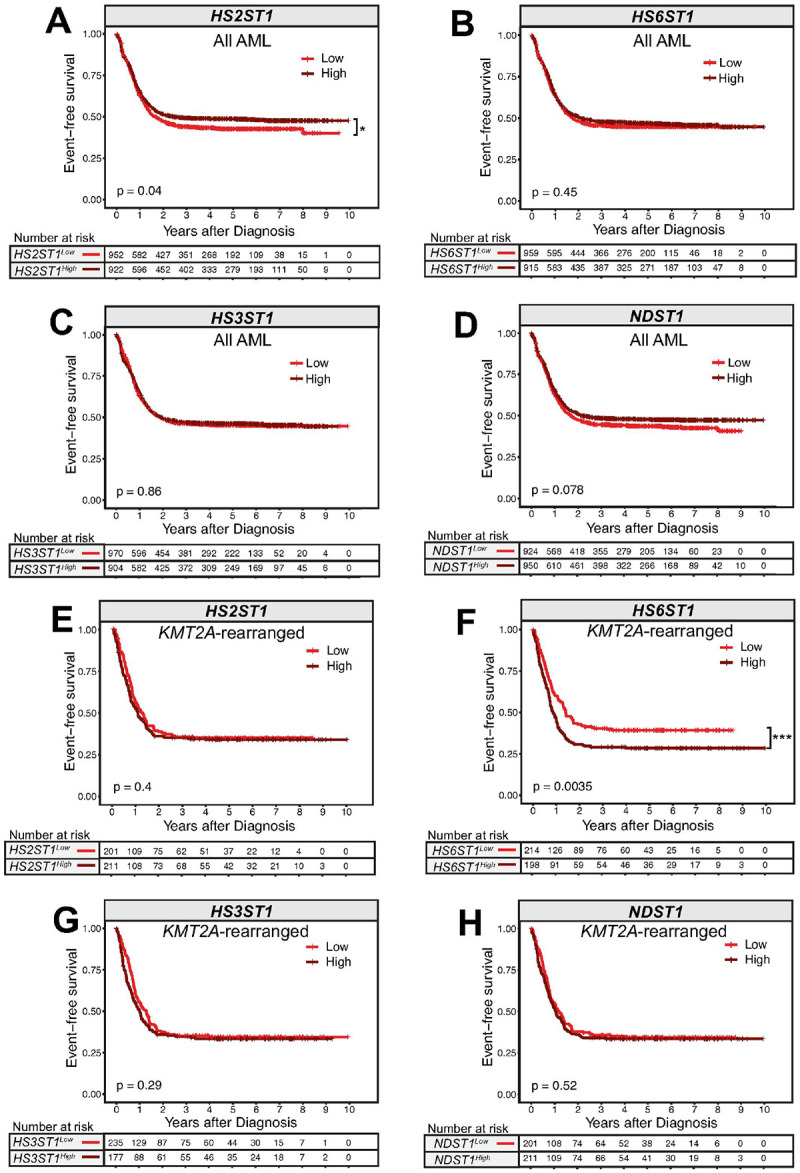 Figure 2
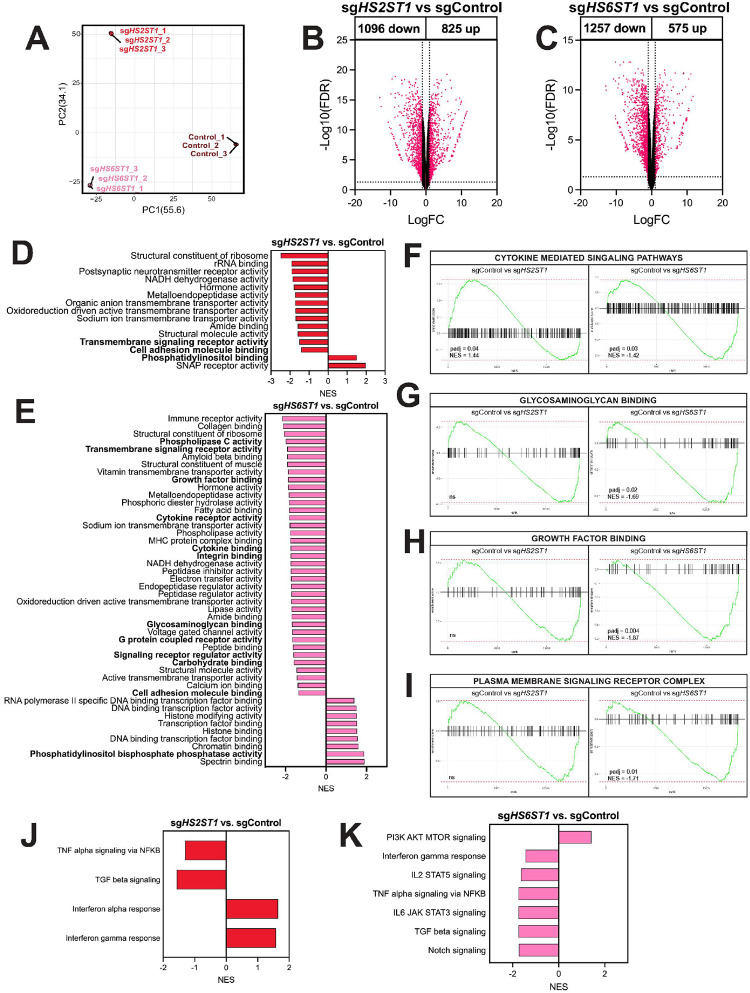 Figure 3
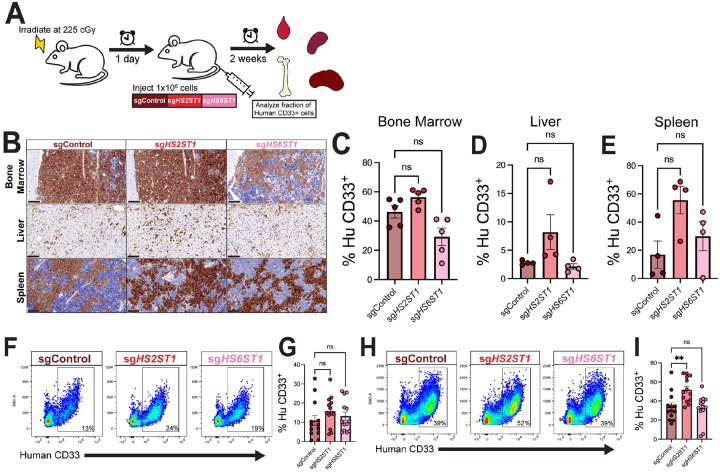 Figure 4
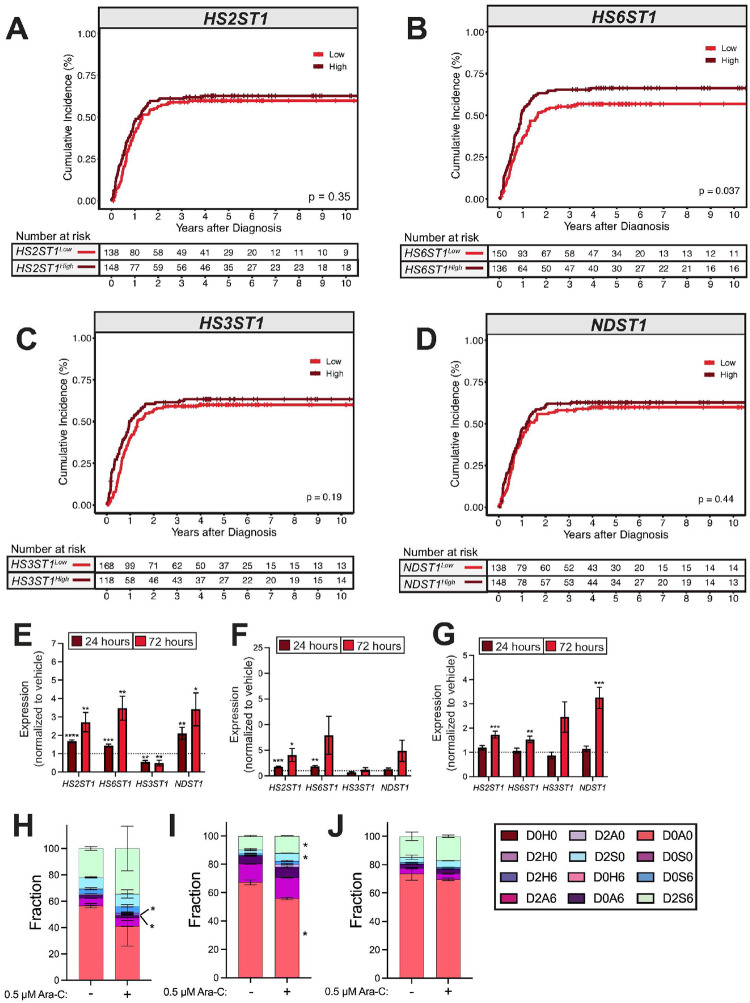 Figure 5
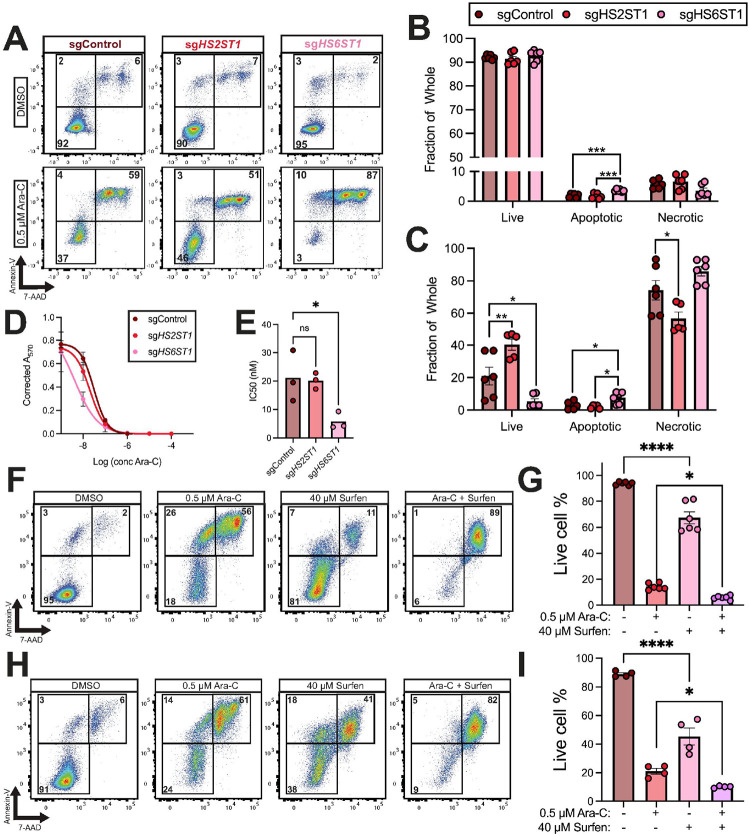 Figure 6
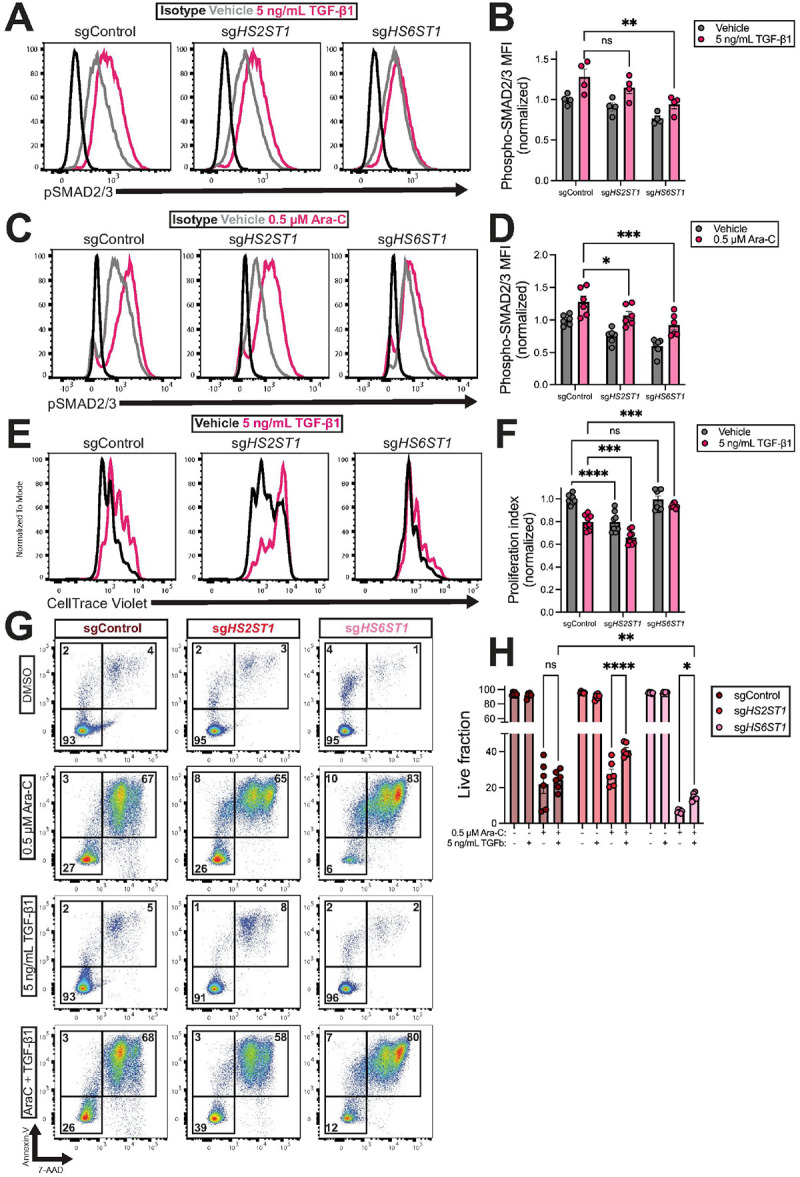 Figure 7
Peer Reviews
No public reviews on file for this paper yet. If you reviewed it on a platform where reviews are public (OpenReview, ICLR, NeurIPS, ICML), you can paste yours below so the community can read it here.
Videos
No videos yet. Explain this paper in a talk, walkthrough, or lecture? Add one.
Taxonomy
TopicsProteoglycans and glycosaminoglycans research · Glycosylation and Glycoproteins Research · Hippo pathway signaling and YAP/TAZ
INTRODUCTION
Acute myeloid leukemia (AML) is the deadliest blood cancer, with a 5-year overall survival rate stagnating around 30% (1, 2). One aggressive form of AML occurs when patients harbor fusions of the lysine methyltransferase 2A (KMT2A) gene with various partners (3, 4). Daunorubicin or idarubicin and cytarabine (Ara-C) are frontline chemotherapeutic agents for AML (5, 6). While many patients achieve remission following initial chemotherapy treatments, disease relapse remains high because of the persistence of drug resistant cells that can expand following treatment (1, 7).
The AML growth factor milieu influences disease progression and AML chemotherapy resistance (8–10). Heparan sulfate proteoglycans are transmembrane proteins that facilitate growth factor signaling in normal and malignant cells (11–14). Heparan sulfate proteoglycans bear glycan chains that are composed of repeating disaccharide units (15). Heparan sulfates can be modified by the addition of negatively charged sulfate moieties at the N-, 2-O, 6-O, or 3-O positions. Sulfation modifications are catalyzed by enzymes encoded by the genes NDST1–4, HS2ST1, HS6ST1–3, or HS3ST1–7, respectively (12, 15). The type and amount of sulfate modifications present on the glycan chain influences heparan sulfate-growth factor interactions and signaling (16, 17). Heparan sulfate proteoglycans and heparan sulfate modifications have important roles in cancer cell adhesion, proliferation, migration, drug resistance, and vascularization (13, 18–21). Recent work identified syndecan-2 as an important regulator of hematopoietic stem cell quiescence via TGF-β1 signaling, and other work has demonstrated that heparan sulfate structure is important for B-cell maturation (22, 23). Several cytokines important for normal and malignant hematopoiesis, including TGF-β1, CXCL12, FGF1 and 2, and PDGF, bind heparan sulfate (24). However, the impact of precise heparan sulfation patterns in AML is largely undefined.
In this study, we show that heparan sulfation is dysregulated at the transcript and glycan levels in AML cells compared to normal hematopoietic cells. We identify an association between high HS6ST1 expression and poor survival outcomes for *KMT2A-*rearranged AML patients. Using CRISPR-edited MOLM-13 cells, we demonstrate that HS6ST1 is crucial for AML cell survival in response to Ara-C, and this occurs via TGF-β1 signaling. Our data highlights the critical function of heparan sulfation in AML, enabling us to expand current models of chemotherapy resistance by incorporating this crucial glycan modification.
MATERIALS AND METHODS
Study resources
Detailed information for resources used throughout this study is included in Supplementary Table 1.
Patients and Samples
Samples were obtained from 2072 children and young adults (age 0–29 years) enrolled in clinical trials CCG-2961 (NCT00002798, n = 81), AAML03P1 (NCT00070174, n = 121), AAML0531 (NCT00372593, n = 795), and AAML1031 (NCT00372593, n = 1075) with written, informed consent collected from patients and their legal guardians in accordance with the Declaration of Helsinki. Each protocol was approved by the National Cancer Institute’s central institutional review board (IRB) and the local IRB for each participating institution. Clinical data were available for all 2072 patients, with 1874 of those patients also having accompanying survival and transcriptomic data, and analyses were performed for that cohort with complete data. 68 normal bone marrow (NBM) samples were used as controls for expression analysis.
Expression Analysis
Batch-corrected mRNA data aligned to GRCh38 with STAR was used. Resulting normalized gene counts were converted into transcripts per million. Violin plots were generated with log10(TPM) using ggplot2 (v3.4.2). Wilcoxon test with Benjamini Hochberg adjustment was used to determine significance between AML subtypes and NBM expression levels for Heparan sulfation genes HS2ST1 (ENSG00000153936), HS6ST1 (ENSG00000136720), HS3ST1 (ENSG00000002587), and NDST1 (ENSG00000070614).
Survival Analysis
Kaplan-Meier survival curves were generated using the survival (v3.5–5) and survminer (v0.4.9) packages in R (v. 4.3.2). Survival times were calculated from time of diagnosis. Competing events such as death or induction failure were removed from cumulative incidence calculations to determine relapse risk. Survival curves were generated by binning samples into above (high) and below (low) median expression of the gene of interest.
Glycosaminoglycan profiling
Cryopreserved de-identified peripheral blood specimens from AML patients were obtained from the Fred Hutchinson Cancer Center/University of Washington Hematopoietic Diseases Repository. All participants provided written informed consent in accordance with the Declaration of Helsinki under the oversight of the Fred Hutch Institutional Review Office. Preparation and analysis was performed by the University of California San Diego GlycoAnalytics Core as previously reported (25).
Mouse models
Animal procedures were performed in accordance with the Fred Hutchinson Cancer Center Institutional Animal Care & Use Committee (PROTO2100049). Mice were housed and maintained in the Fred Hutch Comparative Medicine facility; mixed-sex adult mice 8–12-weeks of age were used for all studies. Mice were bred in house or purchased from the Fred Hutch Translational Research Model Services core.
Cell culture
MOLM-13, THP-1, and Kasumi-1 cells were obtained from the American Type Culture Collection and maintained per the manufacturer’s instructions. Cell lines were authenticated using the CLA IdentiFiler Plus PCR Amplification Kit.
Cell line xenografts
Mice were irradiated using a Mark 1 cesium irradiator (225 cGy). The following day, mice were intravenously injected with 1×10^6^ MOLM-13 cells via tail vein. For leukemic burden studies, 14 days post-injection, mice were euthanized and bone marrow was isolated from one femur, lysed with ACK buffer, and processed in complete IMDM (IMDM + 10% FBS + 1% penicillin-streptomycin). For homing assays, 16 hours post-injection, bone marrow was isolated from two femurs and two tibias, lysed with ACK buffer, and processed in complete IMDM. Spleens were harvested, tissue was dissociated, lysed with ACK buffer, and processed in complete IMDM. Peripheral blood was collected into EDTA immediately prior to euthanasia, lysed using ACK buffer, and processed in 10% FBS/PBS. Lysed cells were stained using antibodies or isotype controls (Supplemental Table 1) and analyzed by flow cytometry (LSRFortessa X-50 or BD FACSymphony A5). Data were analyzed using FlowJo software (v10.10.0). Frequencies are displayed as percent of live cells. Investigators were not blinded. No randomization was used. Sample sizes were estimated using power analyses to quantify the number of replicates needed to achieve at least 80% power and detect a ratio of 1.2 vs. null hypothesis of 1.0 with significance level of α = 0.013.
Histology
Organs were formalin fixed for 72 hours and washed with PBS. Femurs were decalcified for 14 days (0.5M EDTA, 4°C). Samples were paraffin-embedded and sectioned at 4 μm. Sections were stained with anti-human CD33 with nuclear counterstain. Broad regions of interest encompassing the full section (spleen and liver) or BM compartment, excluding the epiphysis (bone), were defined by a single observer. Primary classifiers were trained to exclude glass, fold and tear artifacts and (bone only) cortical bone. In the remaining tissue, the CD33^+^ area fraction was determined using the areaquant analysis plugin within HALO software (v3.6.4134).
Lentiviral transductions
A 24-well plate was coated with retronectin (50 μg, 2 hours) and blocked for 30 minutes (2% BSA). 5×10^4^ MOLM-13 cells were seeded on the retronectin-coated wells and infected with lentiviral vectors containing guide RNAs targeting Control, HS2ST1, or HS6ST1 (MOI = 25) (Supplementary Table 1). Cells were spin occulated (30 minutes, 1000 rpm, 32°C) and incubated for two days before the media was changed. 1–2 weeks after transduction, GFP^+^ cells were sorted using a BD FACSymphony S6 and expanded.
In vitro chemotherapy treatment
2.5×10^5^ MOLM-13 cells were seeded in complete RPMI supplemented with DMSO vehicle or Ara-C to a final concentration of 0.5 μM and incubated at 37°C, 5% CO_2_ for 24 or 72 hours. Cells were then stained in 1X Annexin binding buffer with fluorochrome conjugated Annexin V and 7-AAD and analyzed via flow cytometry. For surfen experiments, cells were treated with surfen to a final concentration of 40 μM. For TGFβ-1 co-treatment experiments, cells were treated with recombinant human TGFβ-1 to a final concentration of 5 ng/mL.
RT-qPCR and RNA Sequencing:
RNA was isolated using the Qiagen RNeasy Micro Kit. For RT-qPCR analyses, RNA was reverse transcribed using the Applied Biosystems High-Capacity cDNA Reverse Transcription Kit. Gene expression was analyzed using an Applied Biosystems QuantStudio 5 PCR machine. For RNA sequencing, library preparation and sequencing was performed using a NextSeq 2000 P2–100. Gene set enrichment analysis was performed against the C5: Ontology Gene Sets. Data are deposited in GEO (GSE314673).
Intracellular flow cytometry
Cells were stained with BD Fixable Viability Stain, washed, and fixed with BD Fixation/Permeabilization solution. Cells were stained with primary and secondary antibodies, washed, and analyzed via flow cytometry. Mean fluorescence intensity (MFI) was calculated using FlowJo.
CellTrace Violet
2.5×10^5^ MOLM-13 cells were stained with CellTrace Violet according to manufacturer instructions, seeded in complete RPMI, and treated with either vehicle or human TGF-β1 to a final concentration of 5 ng/mL. Cells were incubated at 37°C, 5% CO_2_ for 72 hours, stained with 7-AAD and analyzed via flow cytometry.
Western Blotting
1×10^7^ MOLM-13 cells were harvested and lysed in RIPA buffer supplemented with protease and phosphatase inhibitors. 10–25 μg of each sample was separated using gel electrophoresis and transferred onto a PVDF membrane. Membranes imaged using a Li-Cor Odyssey system after antibody staining. Quantification was performed using the Image Studio Lite software (v5.2.5).
RESULTS
Heparan sulfate is dysregulated at the transcriptional and glycan scales in AML
We first assessed the expression of heparan sulfotransferase genes HS2ST1, HS3ST1, HS6ST1, and NDST1 in healthy individuals and AML patients from the Therapeutically Applicable Research to Generate Effective Treatments (TARGET) database (Fig. 1A). Bulk RNA sequencing revealed significantly lower HS2ST1 and HS3ST1 expression in AML patient bone marrow mononuclear cells than normal bone marrow (NBM) mononuclear cells, while HS6ST1 and NDST1 expression were similar among these groups (Fig. 1B). AML patients with *KMT2A-*rearrangements and *FLT3-*ITD mutations expressed significantly less HS2ST1 and HS3ST1 than NBM cells. In contrast, patients harboring *FLT3-*ITD mutations expressed significantly more HS6ST1 compared to NBM, while NDST1 expression was similar between these groups (Fig. 1B). These data suggest that the transcriptional profile of heparan sulfotransferase genes differs in AML and NBM cells.
We next used liquid chromatography mass spectrometry to analyze heparan sulfate modifications of peripheral blood mononuclear cells (PBMCs) from normal patients and AML patients. AML patient characteristics are detailed in Supplemental Table 2. Total heparan sulfate amounts were similar in AML and normal cells (Fig. 1C). Each heparan sulfate disaccharide can bear zero, one, two, or three sulfate groups. Heparan sulfate disaccharides containing three sulfate groups were less frequent in AML PBMCs compared to normal PBMCs (Fig. 1D). AML PBMCs had lower fractions of N- and 2-O heparan sulfate compared to normal PBMCs (Fig. 1E). AML PBMCs had significantly less D0S0 *N-*monosulfated and D2S6 trisulfated disaccharides and significantly more D0A0 unsulfated and D0A6 6-O monosulfated disaccharides compared to normal PBMCs (Fig. 1F–G). Taken together, these data suggest that AML cells express distinct heparan sulfate landscapes with fewer sulfate modifications compared to normal cells.
Increased HS6ST1 expression is associated with worse survival outcomes in KMT2A-rearranged AML patients
We next assessed whether heparan sulfotransferase gene expression is associated with differential AML patient outcomes. We classified TARGET AML patients according to their bone marrow expression of HS2ST1, HS6ST1, HS3ST1, and NDST1 relative to the cohort median. Among all AML patients, individuals with lower HS2ST1 expression had significantly worse event-free survival than those with high HS2ST1 expression, but overall survival outcomes were similar (Fig. 2A; Supplemental Fig. 1A). Overall survival (Supplemental Fig. 1B-D) and event-free survival (Fig. 2B–D) were similar in AML patients regardless of HS6ST1, HS3ST1, or NDST1 expression levels. However, among AML patients with KMT2A-rearrangements, increased HS6ST1 expression correlated with significantly worse event-free and overall survival compared to patients expressing less HS6ST1 (Fig. 2F; Supplemental Fig. 1F). HS2ST1, HS3ST1, and NDST1 expression did not stratify patients harboring KMT2A-rearrangements according to differential survival outcomes (Fig. 2E, G–H; Supplemental Fig. 1E, G-H). These data indicate that increased HS6ST1 expression correlates with worse survival outcomes in AML patients with *KMT2A-*rearrangements.
Depletion of heparan sulfotransferases remodels the AML transcriptome
Previous studies highlight that heparan sulfation controls cancer cell functions (13, 14, 19, 26), leading us to hypothesize that heparan sulfation may regulate AML cells to support disease progression. To test this, we used CRISPR-Cas9 to knockdown HS2ST1 and HS6ST1 in the MOLM-13 cell line, which harbors KMT2A-MLLT3 and FLT3-ITD mutations. Compared to sgControl cells, sgHS2ST1 and sgHS6ST1 cells had decreased HS2ST1 and HS6ST1 protein expression, respectively, and high indel contribution in target genes. (Supplemental Fig. 2A-D).
Bulk RNA sequencing and principal component analysis revealed sgControl, sgHS2ST1, and sgHS6ST1 cells cluster distinctly, suggesting unique transcriptional profiles (Fig. 3A). Compared to sgControl cells, 1096 genes were downregulated, and 825 genes were upregulated in sgHS2ST1 cells (Fig. 3B). In sgHS6ST1 cells, 1257 downregulated genes and 575 upregulated genes were detected compared to sgControl cells (Fig. 3C). Gene Set Enrichment Analysis revealed differentially enriched heparan sulfate proteoglycan-dependent processes in sgHS2ST1 and sgHS6ST1 cells compared to sgControl cells (Fig. 3D–E). More specifically, sgHS2ST1 cells were negatively enriched for gene sets associated with transmembrane signaling receptor activity and cell adhesion molecule binding and positively enriched for phosphatidylinositol binding and cytokine mediated signaling pathways (Fig. 3D, F). sgHS2ST1 cells were also negatively enriched for TNF-α and TGF-β signaling and positively enriched for interferon alpha and gamma response hallmark gene sets (Fig. 3J). sgHS6ST1 cells were negatively enriched for gene sets associated with growth factor binding, cytokine receptor activity, cytokine binding, glycosaminoglycan binding, signaling receptor regulator activity, plasma membrane signaling receptor complex, and carbohydrate binding compared to sgControl cells (Fig. 3E, F–I). sgHS6ST1 cells were also negatively enriched for the interferon gamma response, IL2-STAT5, TNF-α, IL6-JAK-STAT3, TGF-β, and Notch signaling hallmark gene sets and positively enriched for PI3K/AKT/MTOR genes (Fig. 3K). These data indicate that heparan sulfate modifications catalyzed by HS2ST1 and HS6ST1 have distinct and farreaching effects on proteoglycan-mediated signaling processes in AML cells.
Depletion of HS2ST1 increases AML bone marrow burden in vivo
Signaling-related pathways identified from our RNA sequencing analyses are known to impact cancer cell proliferation, leading us to test the potential function of heparan sulfation in AML cell growth (27–29). We tested the impact of HS2ST1 and HS6ST1 expression on AML growth in vivo using xenograft studies. sgControl, sgHS2ST1, or sgHS6ST1 cells were intravenously transplanted into irradiated NSG mice, and AML burden was quantified using quantitative histology and flow cytometry at 2 weeks-post injection (Fig. 4A). Bone marrow immunohistochemistry showed similar AML burden between all groups, however there was a trend towards increased burden in sgHS2ST1-transplanted animals (Fig. 4B–C). Spleen, liver, and peripheral blood AML burden was similar in all groups (Fig. 4B, D–G). Flow cytometry showed a significant increase in AML bone marrow burden upon transplant with sgHS2ST1 cells compared to sgControl cells (Fig. 4H–I). These data reveal that depletion of HS2ST1, but not HS6ST1, enhances AML bone marrow burden in vivo.
We also assessed cell homing by transplanting sgControl, sgHS2ST1, and sgHS6ST1 into NSG mice (225 cGy) and analyzing AML burden 16 hours post-transplant (Supplemental Fig. 3A). sgControl, sgHS2ST1, or sgHS6ST1 cell homing to the bone marrow or spleen were similar (Supplemental Fig. 3B-C), suggesting that HS2ST1-mediated changes in AML bone marrow burden occur independently of homing.
Higher HS6ST1 expression correlates with increased relapse risk in KMT2A-r AML patients
Disease relapse driven by chemotherapy-resistant AML cells is a major barrier to long term patient survival (30). We therefore interrogated whether heparan sulfotransferase expression correlated with relapse risk in AML. Low HS2ST1 expression predicted higher relapse risk across AML subtypes (Supplemental Fig. 4A). There were no significant differences in relapse risk based on HS3ST1, HS6ST1, and NDST1 expression across AML subtypes (Supplemental Fig. 4B-D). HS2ST1, HS3ST1 and NDST1 expression were not correlated with *KMT2A-*rearranged patient relapse risk (Figs. 5A, C–D). In contrast, high bone marrow HS6ST1 expression was associated with significantly increased relapse risk in *KMT2A-*rearranged AML patients (Fig. 5B). These data demonstrate that high HS6ST1 correlates with increased relapse in patients with KMT2A-rearranged leukemias.
Cytarabine treatment alters heparan sulfotransferase gene expression in AML cell lines
Previous studies show that the heparan sulfate landscape differs in therapy-refractory residual breast cancer tumor cells compared to the primary tumor (20). These findings led us to test whether therapy-refractory AML cells express distinct heparan sulfate landscapes that enable them to resist chemotherapy and promote relapse. MOLM-13 cells expressed increased HS2ST1, HS6ST1, and NDST1 and decreased HS3ST1 at 24- and 72-hours post-Ara-C treatment compared to vehicle-treated controls (Fig. 5E). Kasumi-1 cells had significantly increased HS2ST1 and HS6ST1 expression at 24-hours post-Ara-C treatment compared to vehicle, but HS3ST1 and NDST1 expression were unchanged (Fig. 5F). HS2ST1, HS6ST1, and NDST1 expression were significantly elevated in THP-1 cells at 72 hours post-Ara-C treatment compared to vehicle controls (Fig. 5G). These data suggest that chemotherapy resistant AML cells express different heparan sulfate transcriptomic profiles compared to their chemosensitive counterparts.
Liquid chromatography mass spectrometry revealed significantly increased D2H6 and decreased D2A0 disaccharides in MOLM-13 cells treated with Ara-C compared to vehicle-treated cells (Fig. 5H). In Kasumi-1 cells, there was significantly decreased D0A0 and significantly increased D2S0 and D2S6 disaccharides upon Ara-C treatment (Fig. 5I). There were no significant changes in the heparan sulfate disaccharide composition in THP-1 cells after treatment with Ara-C (Fig. 5J). These data show that Ara-C remodels the AML heparan sulfate landscape at the glycan level, suggesting that the precise structure of heparan sulfate may influence AML cells chemotherapy responses.
HS6ST1 depletion promotes sensitivity to cytarabine
Because Ara-C treatment increases heparan sulfotransferase gene expression, we investigated whether HS2ST1 or HS6ST1 regulate AML sensitivity to Ara-C. After 72 hours, Vehicle-treated sgControl, sgHS2ST1, and sgHS6ST1 cells exhibited similar levels of live and necrotic cells, while sgHS6ST1 cells had slightly increased apoptotic cells (Fig. 6A–B). However, upon Ara-C treatment, sgHS2ST1 cells had significantly more live cells than sgControl cells, suggesting they are more resistant to chemotherapy (Fig. 6C). sgHS6ST1 cells had significantly fewer live cells compared to sgControl cells, accompanied by increased apoptotic cells, indicating they are more chemosensitive (Fig. 6C). Consistent with these data, there was a four-fold reduction in the Ara-C IC50 for sgHS6ST1 cells compared to sgControl cells (Fig. 6D–E). Together, these data show that HS6ST1 and HS2ST1 distinctly regulate AML chemotherapy sensitivity.
Surfen is a small molecule antagonist of heparan sulfate (31). To evaluate whether heparan sulfate blockade is therapeutically effective for AML, we treated MOLM-13 and THP-1 cells with surfen alone and in combination with Ara-C. Compared to vehicle treatment, surfen treatment decreased cell viability in MOLM-13 and THP-1 cells, but not to the same level as Ara-C. However, combinatorial treatment of MOLM-13 or THP-1 cells with Ara-C and surfen significantly decreased cell viability compared to Ara-C treatment alone (Fig. 6F–I). These data show that heparan sulfate antagonism synergizes with Ara-C to promote AML cytotoxicity.
HS6ST1 is promotes TGF-β1 signaling to regulate AML survival upon chemotherapy treatment
Our RNA sequencing data indicates that compared to sgControl cells, sgHS6ST1 cells were negatively enriched for pathways related to growth factor signaling including TGF-β1 (Fig. 3C). Bone marrow TGF-β1 levels are significantly increased in relapsed/refractory AML patients, and high TGFB1 expression predicts adverse prognoses (32, 33). TGF-β1 supplementation promotes AML chemoresistance in vitro by inducing a quiescent-like G_0_ shift (34, 35). We therefore hypothesized that depleting HS6ST1 may impact TGF-β1 signaling in AML, rendering cells more susceptible to Ara-C. Using intracellular flow cytometry, we measured phospho-SMAD2/3, a response element downstream of TGF-β1. TGF-β1 stimulation increased phospho-SMAD2/3 levels in sgControl and sgHS2ST1 compared to vehicle treatment (Fig. 7A–B). However, phospho-SMAD2/3 expression upon TGF-β1 stimulation of sgHS6ST1 cells was muted compared to sgControl cells (Fig. 7A–B). Similarly, Ara-C treatment induced SMAD2/3 phosphorylation in all cell lines relative to vehicle treatment (Fig. 7C–D). However, phospho-SMAD2/3 expression was significantly lower in Ara-C-treated sgHS2ST1 and sgHS6ST1 than Ara-C-treated sgControl cells (Fig. 7C–D). We next measured cell divisions at baseline and upon TGF-β1 stimulation using CellTrace Violet staining. sgHS2ST1 cells had a lower proliferation index than sgControl cells at baseline and after stimulation with TGF-β1. sgHS6ST1 proliferation index was not significantly different from sgControl cells at baseline, but it was significantly higher than sgControl cells after TGF-β1 treatment (Fig. 7E–F). These data indicate that depletion of HS6ST1 decreases TGF-β1-mediated SMAD2/3 activation and supports cell proliferation.
As TGF-β1 is known to promote AML chemotherapy resistance (32), we reasoned that sgHS6ST1 cells may exhibit reduced cell survival abilities compared to sgControl cells due to an impaired ability to respond to TGF-β1. To test this, cells were treated with Ara-C and TGF-β1 and cell death was quantified with Annexin-V/7-AAD staining. TGF-β1 treatment alone had no impact on cell survival (Fig. 7G–H). However, TGF-β1 treatment in combination with Ara-C promoted the viability of sgHS2ST1 cells and sgHS6ST1 cells compared to Ara-C treatment alone. However, even with this increase in viability, sgHS6ST1 cells do not achieve the level of cell survival detected in sgControl cells. These data suggest that HS6ST1 cells have an impaired ability to respond to TGF-β1 signaling, which sensitizes cells to Ara-C. Taken together, our findings indicate that HS6ST1 regulates AML chemotherapy resistance, and depletion of HS6ST1 can sensitize AML cells to Ara-C, while impairing their ability to respond to TGF-β1 stimuli.
DISCUSSION
We reported previously that the heparan sulfate proteoglycan syndecan-2 regulates normal hematopoietic stem cell functions (36); however, the effect of heparan sulfates in malignant hematopoiesis had not been fully analyzed. Our study identified a crucial link between the heparan sulfate biosynthesis machinery and AML patient survival outcomes and chemotherapy resistance. This work adds to a growing body of literature defining the roles of heparan sulfation in cancer physiology, such as work from others showing that 6-O sulfation is necessary for survival-promoting signaling in treatment refractory dormant breast cancer residual tumor cells (20). Further, the presence and structures of syndecan-1 heparan sulfate chains regulate multiple myeloma proliferation and signaling (37, 38). Our findings provide a foundation to better understand the function of heparan sulfates in other hematological malignancies and hematopoietic disorders.
Mechanistically, we show that HS6ST1 regulates TGF-β1 signaling to support AML cell survival upon Ara-C. Several studies highlight critical functions for heparan sulfate proteoglycans in regulating TGF-β1 signaling (39–42). Work on hepatocellular carcinoma demonstrated a connection between the 6-O heparan sulfate endosulfatase SULF1 and TGF-β1 signaling (41). However, HS6ST1 decorates heparan sulfates during the biosynthesis process in the endoplasmic reticulum, while SULF1 acts extracellularly after heparan sulfate proteoglycan trafficking. Therefore, the push and pull of heparan sulfate biosynthesis and post-synthesis processing should be carefully analyzed in the future to resolve the distinct contributions of these processes in AML and how they change during disease.
Correlations between TGF-β1 and AML survival outcomes are well-characterized, but inhibiting TGF-β1 receptors in AML can induce expression of drug efflux pumps, weakening treatment efficacy (32, 33, 35, 43). Targeting heparan sulfate to extrinsically reprogram TGF-β1 signaling in AML cells could represent a therapeutic avenue to improve patient outcomes. In our study, we show that the heparan sulfate antagonist surfen promotes AML cell killing alone and in combination with Ara-C. Other groups showed that surfen decreases tumorigenicity of Ewing sarcoma cells by reprogramming growth factor signaling (44). Surfen can also inhibit glioblastoma invasion by blocking chondroitin sulfate, another type of glycosaminoglycan (45). Further, others have shown heparan sulfate mimetics can therapeutically target colorectal cancer stem cells (46). Our results build on these studies by supporting the notion that targeting extracellular glycans represents a viable way to inhibit blood cancer progression, starting with therapeutic relevance in AML.
We showed that AML patient peripheral blood mononuclear cells express heparan sulfate disaccharide profiles that are distinct from normal donor cells. However, open questions regarding heparan sulfate structural changes in AML remain. A landmark study using single-chain variable fragment antibodies targeting differentially modified heparan sulfate showed that distinct heparan sulfate patterns can identify hematopoietic cells primed for different lineages (47). However, heparan sulfate chains are between 40 and 300 sugar residues long, and sulfate modifications and patterning are both important to coordinate growth factor signaling (12, 17). While disaccharide analysis can provide insight into which modifications are present, tools have yet to be created to depict heparan sulfate patterning and chain length with sufficient resolution to accurately discern complete structural motifs. The field will benefit from more robust mass spectrometry methods to characterize the structures of entire heparan sulfate chains, another layer of information that likely informs AML cell responses to chemotherapy.
Supplementary Files
This is a list of supplementary files associated with this preprint. Click to download.
The reference list from the paper itself. Each links out to its DOI / PubMed record.
- 1Forsberg M, Konopleva M. AML treatment: conventional chemotherapy and emerging novel agents. Trends in Pharmacological Sciences. 2024;45(5):430–48.38643058 10.1016/j.tips.2024.03.005 · doi ↗ · pubmed ↗
- 2Sasaki K, Ravandi F, Kadia TM, Di Nardo CD, Short NJ, Borthakur G, De novo acute myeloid leukemia: A population-based study of outcome in the United States based on the Surveillance, Epidemiology, and End Results (SEER) database, 1980 to 2017. Cancer. 2021;127(12):2049–61.33818756 10.1002/cncr.33458 PMC 11826308 · doi ↗ · pubmed ↗
- 3Zehtabcheh S, Soleimani Samarkhazan H, Asadi M, Zabihi M, Parkhideh S, Mohammadi MH. Insights into KMT 2A rearrangements in acute myeloid leukemia: from molecular characteristics to targeted therapies. Biomark Res. 2025;13(1):73.40361241 10.1186/s 40364-025-00786-y PMC 12077025 · doi ↗ · pubmed ↗
- 4Issa GC, Zarka J, Sasaki K, Qiao W, Pak D, Ning J, Predictors of outcomes in adults with acute myeloid leukemia and KMT 2A rearrangements. Blood Cancer J. 2021;11(9):162.34588432 10.1038/s 41408-021-00557-6PMC 8481264 · doi ↗ · pubmed ↗
- 5Sobas MA, Turki AT, Ramiro AV, Sánchez AH, Elicegui JM, González T, Outcomes with intensive treatment for acute myeloid leukemia: an analysis of two decades of data from the HARMONY Alliance. haematol [Internet]. 2025 Nov 6 [cited 2026 Jan 15]; Available from: https://haematologica.org/article/view/12972
- 6Kantarjian HM, Di Nardo CD, Kadia TM, Daver NG, Altman JK, Stein EM, Acute myeloid leukemia management and research in 2025. CA A Cancer J Clinicians. 2025;75(1):46–67.
- 7Zhang J, Gu Y, Chen B. Mechanisms of drug resistance in acute myeloid leukemia. OTT. 2019;Volume 12:1937–45.
- 8Allert C, Müller-Tidow C, Blank MF. The relevance of the hematopoietic niche for therapy resistance in acute myeloid leukemia. Intl Journal of Cancer. 2024;154(2):197–209.